
The TIPP Happiness Index posted a positive reading of 60.6 in April. Coming out of a pandemic, Americans are happy despite many challenges. High energy prices, rising food prices, stock market correction, and high crime rates affect everyone. Yet, they are going about their lives with a smile.
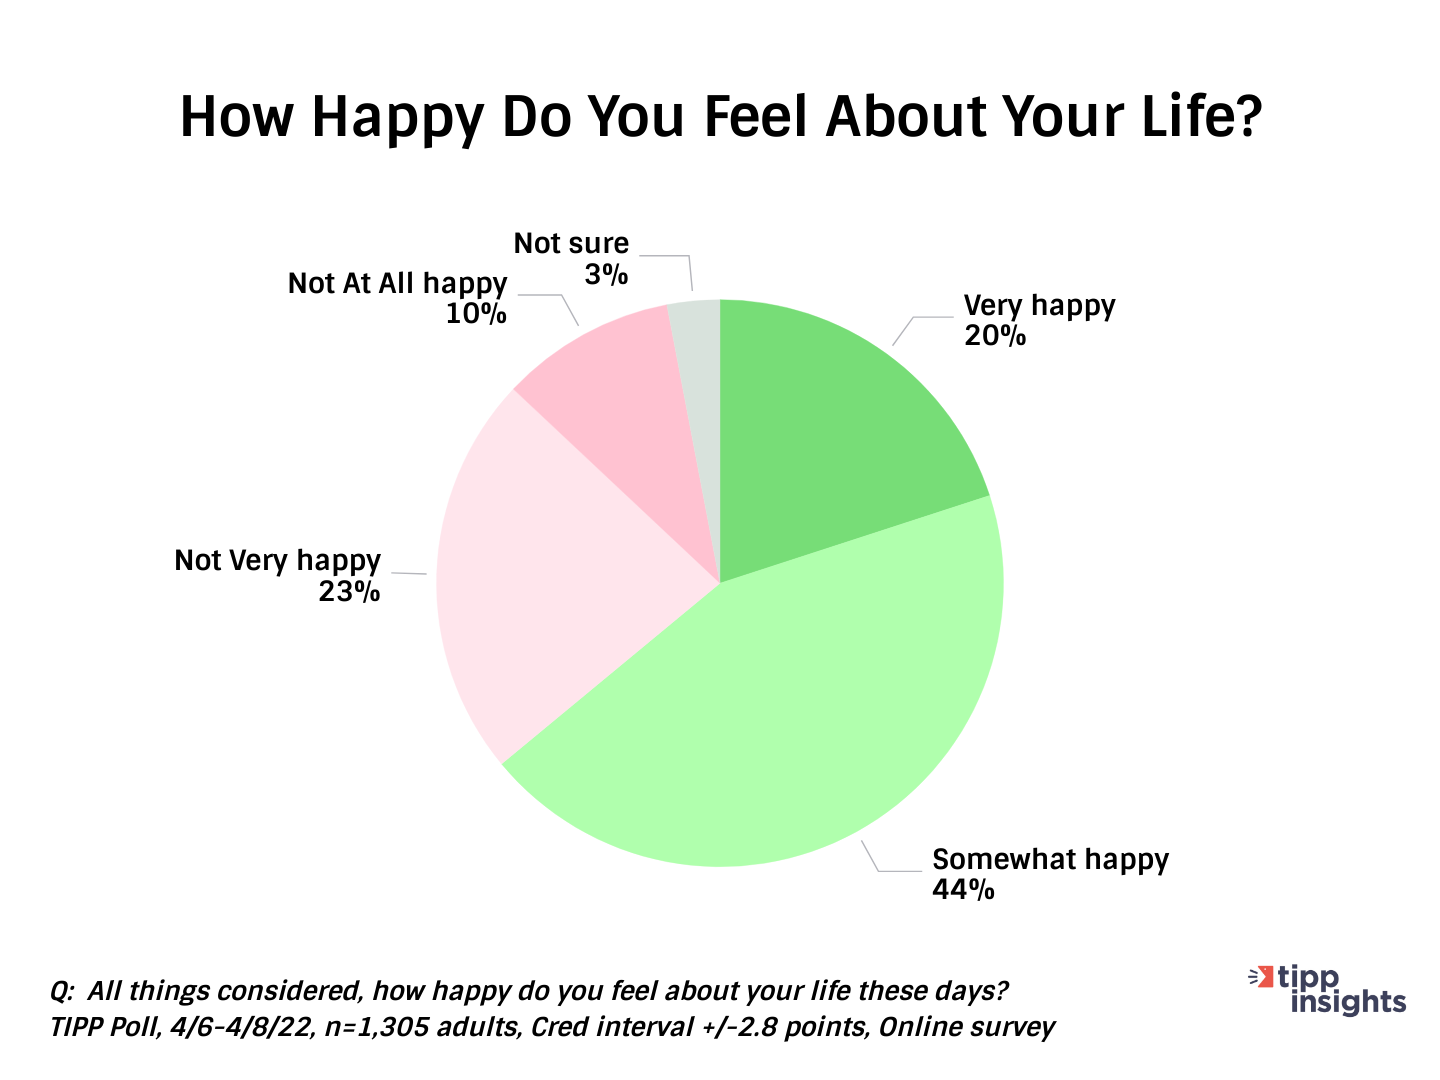
Six in ten Americans (64%) say they are happy about their lives these days. A majority of all 36 demographic groups we analyzed are either "very happy" or "somewhat happy."
The data comes from a TIPP Poll of 1,305 adults nationwide completed in early April.
Happiness Index
TechnoMetrica, in its tradition of out-of-box thinking, developed the Happiness Index, a barometer of Americans' happiness, based on the question: All things considered, how happy do you feel about your life these days?
The chart shows the answers to the question.
We converted the raw responses to a compact index to compare demographic segments and track happiness over time.
The index ranges from 0 to 100. Higher numbers indicate greater happiness, while lower numbers indicate decreased happiness. 50 is a neutral value.
This month marks the second month of the index's tracking.
Under The Hood
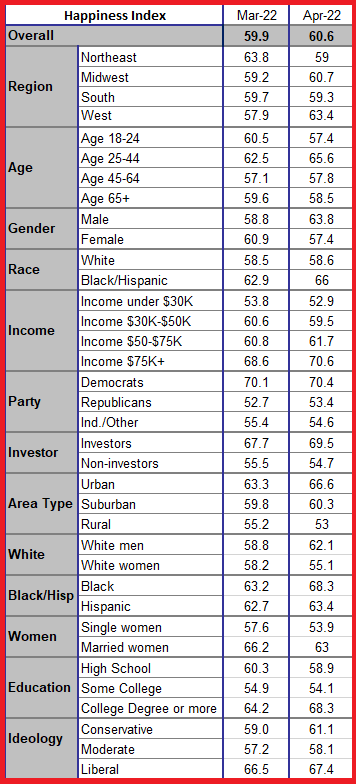
In April, all 36 demographic groups we track are above 50, indicating happiness.
The demographic groups with the highest Happiness Index scores are households with income of $75K+, Democrats, investors, Blacks, and those with a college degree or higher.
On the other end, the groups with the lowest Happiness Index scores are households with incomes under $30K, rural residents, Republicans, single women, those with some college education, and Independents.
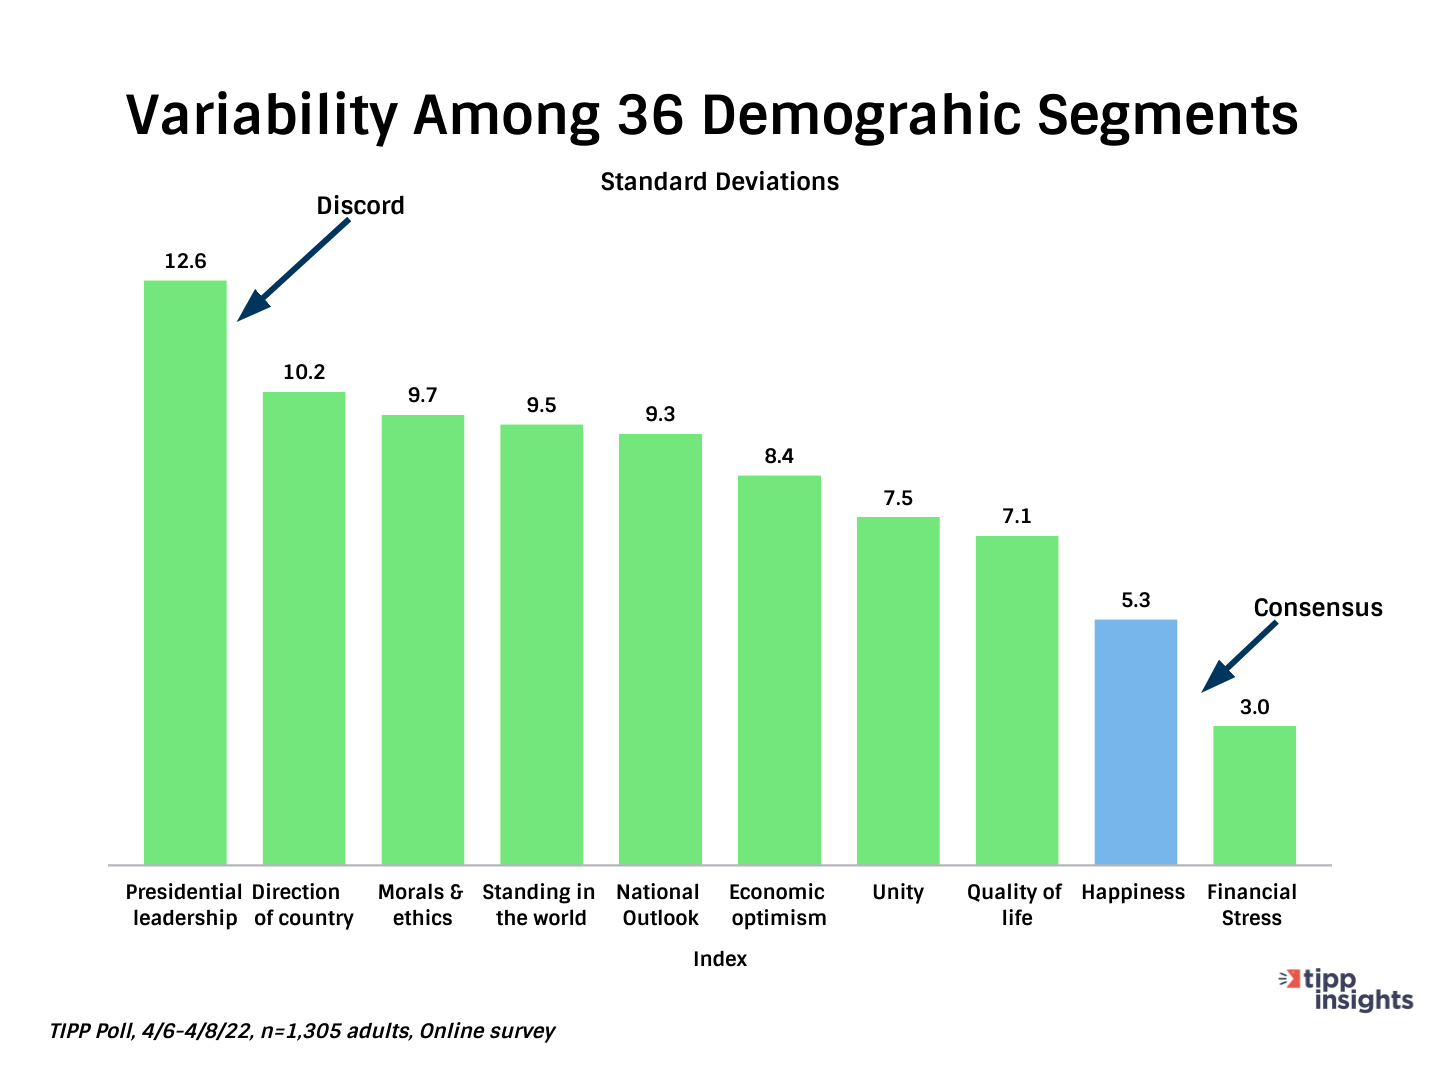
To better understand the variability of TIPP indexes across the 36 demographic groups, we compared their standard deviations.
The chart below shows that financial stress and quality of life exhibit the least variation, meaning better consensus among the 36 groups. The presidential leadership index and the country's direction exhibit the greatest variation, meaning a lack of consensus among the 36 groups.
Note the position of the Happiness Index.
Financial Stress And Happiness Index
According to our data, happiness points were higher among higher-income groups. In April, the scores by income:
- 52.9, income under $30K
- 59.5, income $30K-$50K
- 61.7, income $50-$75K
- 70.6, income $75K+
To better understand the relationship between financial stress and happiness, we plotted the IBD/TIPP Financial Stress Index and the TIPP Happiness Index for selected demographic groups. We divided the data into four quadrants using the overall index values for the Financial Stress Index and Happiness index.
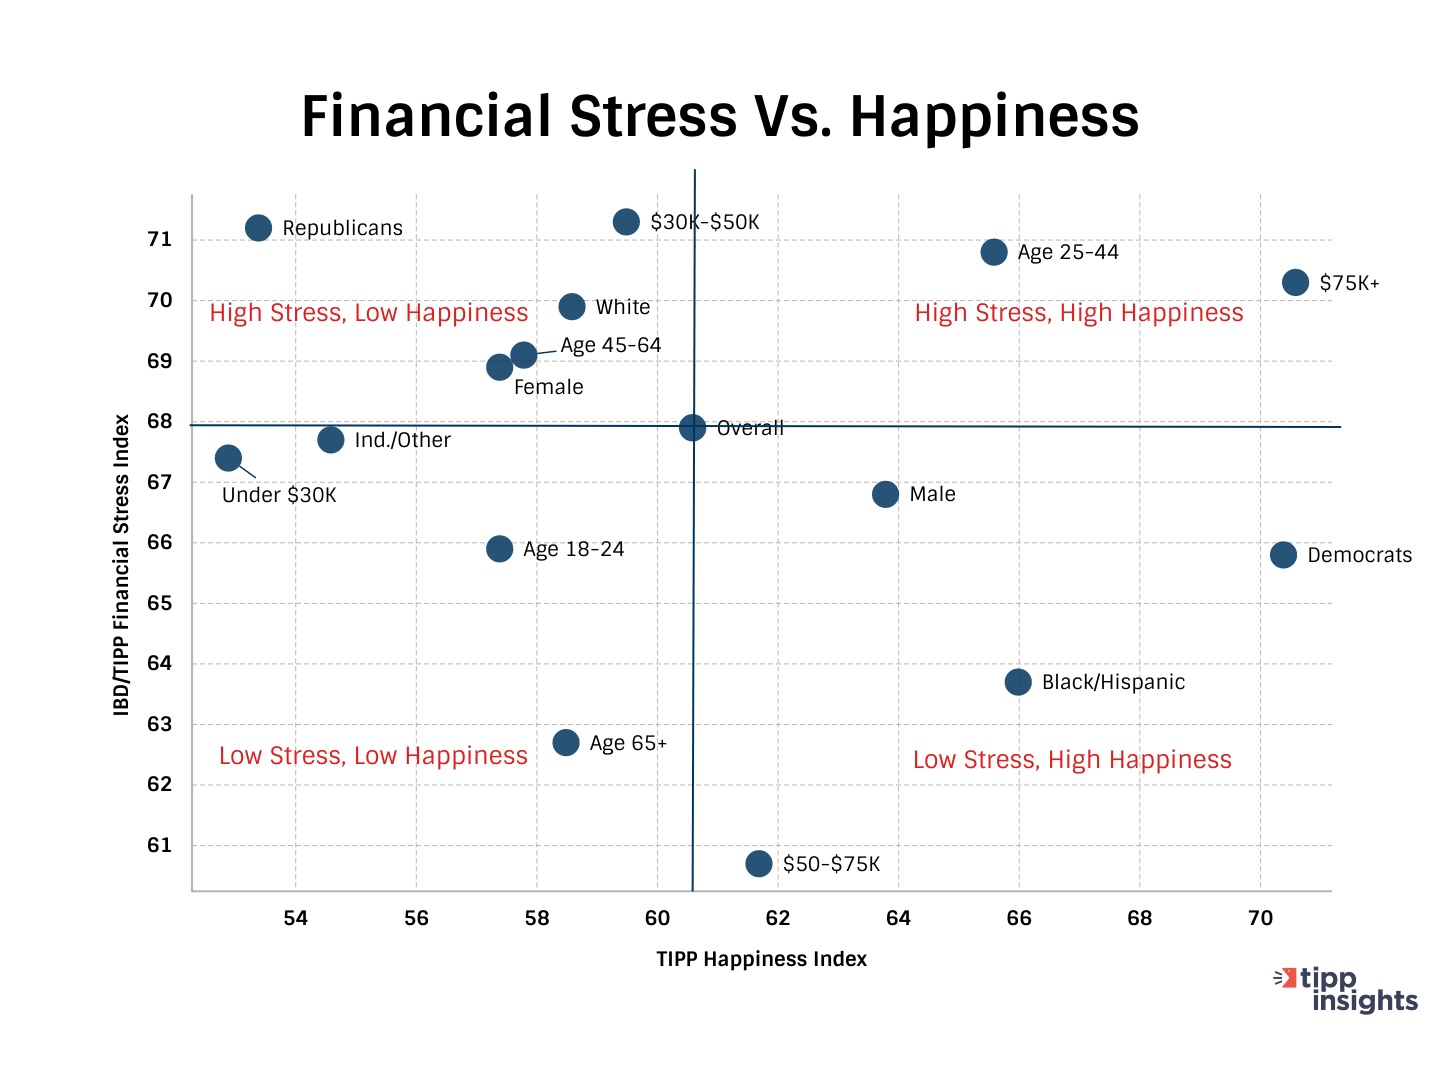
Quadrant 1: Low Stress And High Happiness
Four demographic groups, Democrats, Male, Black/Hispanic, and incomes $50K-$75K, fell into this quadrant.
Quadrant 2: High Stress And High Happiness
Households with incomes $75K+ and the 25-44 age group are the two groups in this quadrant.
Quadrant 3: High Stress And Low Happiness
Five groups occupy quadrant 3. They are Republicans, White, Age 45-64, Female, and $30K to $50K income households.
Quadrant 4: Low Stress And Low Happiness
The four groups in quadrant 4 include under $30K households, Independents, age 18-24 group, and age 65+
A positive Happiness Index is a good news for the economy, and the country, in general. Despite the many pressures, Americans remain upbeat. This could have a constructive impact on pandemic recovery and overcoming the current stagflation.
Please share with anyone who would benefit from the tippinsights newsletter. Please direct them to the sign-up page at:
https://tippinsights.com/newsletter-sign-up/


