- Bidenflation at 19.5% squeezes Americans’ wallets
- The sixth consecutive month of increase
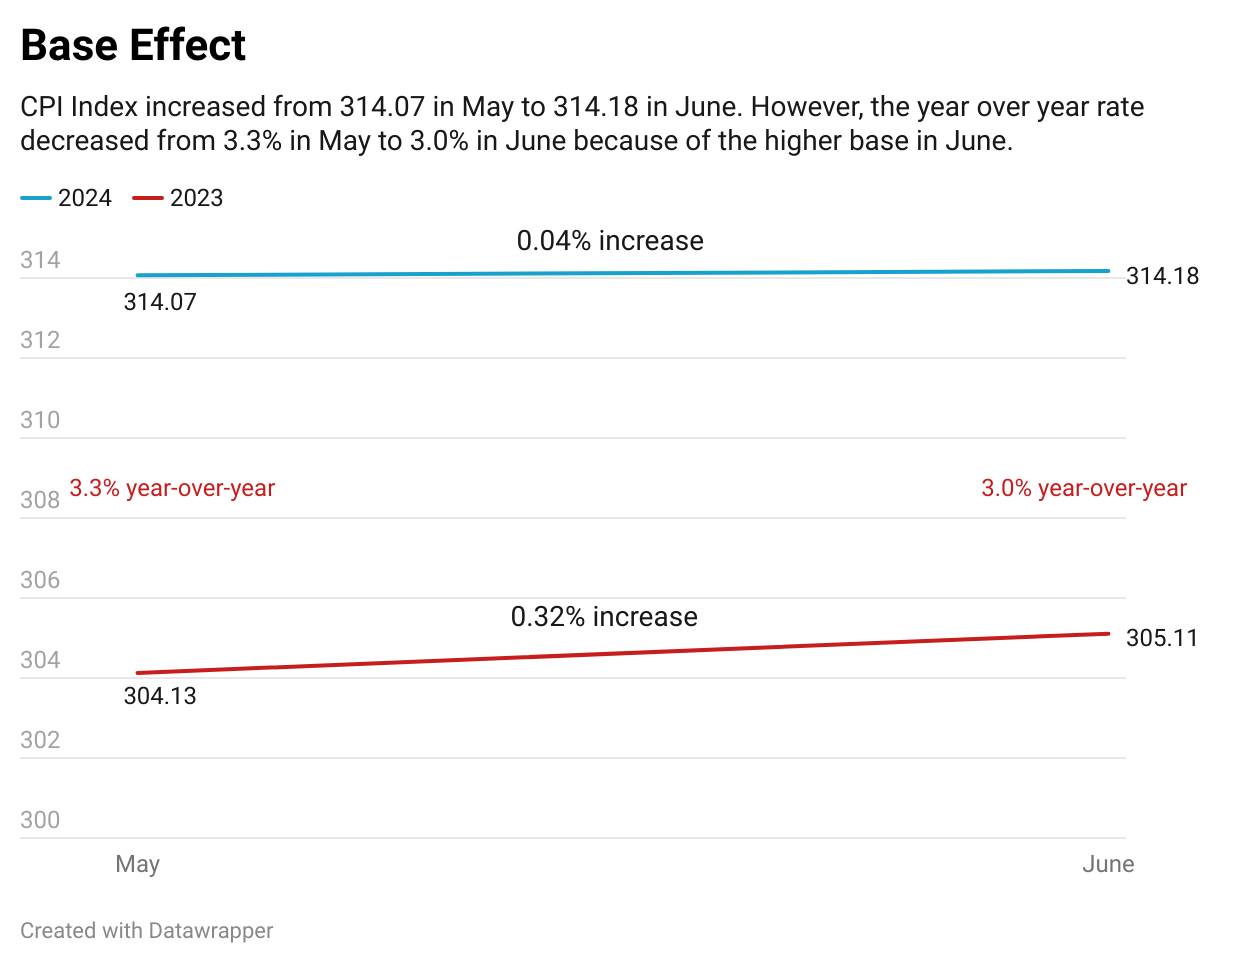
- Inflation improvement is an illusion due to the base effect
- Annualized Bidenflation is 5.7%
- Core inflation remains stubborn at 3.3%
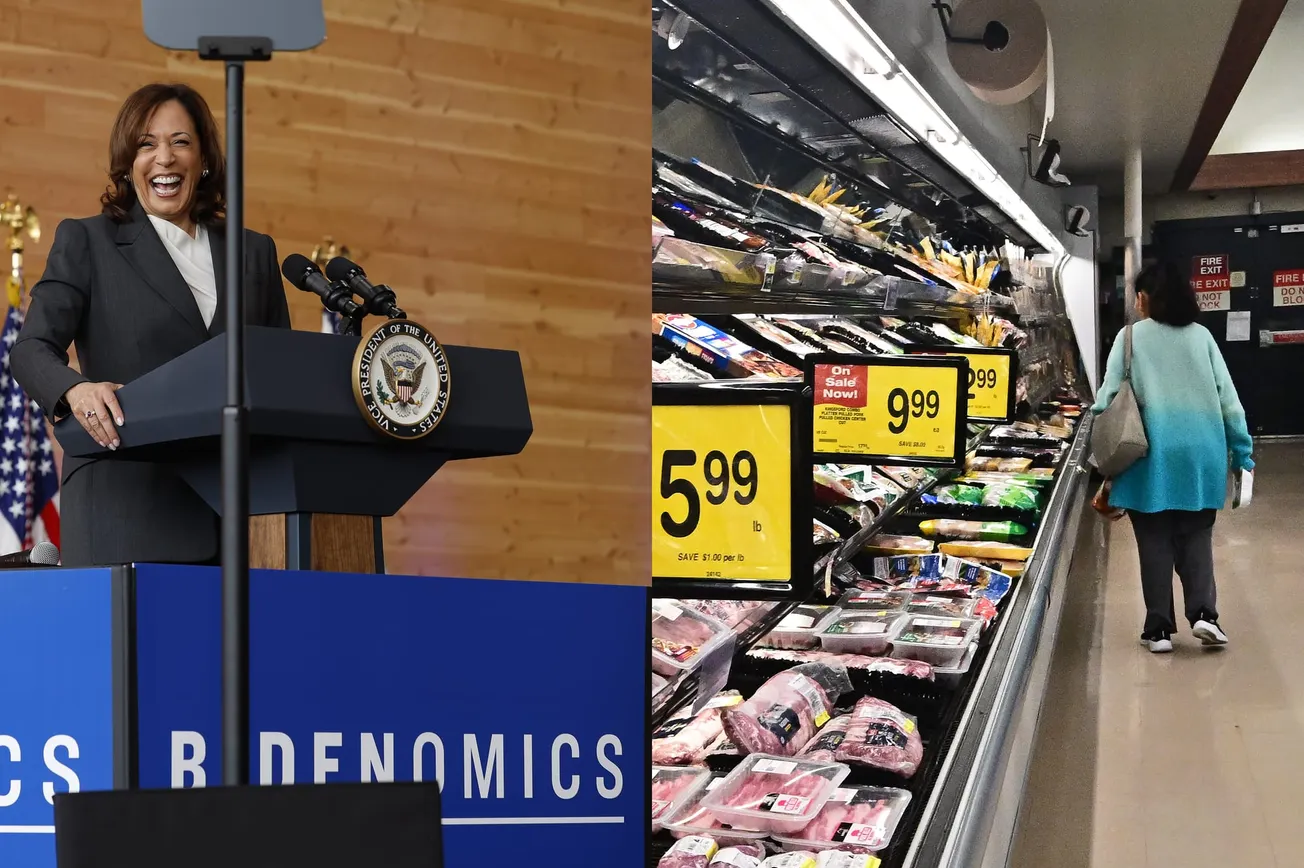
- RELATED: Bidenflation’s Hunger Games: Soaring Food Prices Leave Americans Struggling
The dark reality of Bidenomics is the alarming 19.5% inflation under the President’s watch, which is 5.7% annually. When he took office, inflation was at just 1.4%. Since March 2021, inflation has consistently remained above the Federal Reserve's 2% target for 40 consecutive months.
Under Biden, the federal debt has increased by $6.9 trillion. To finance his spending spree, the Federal Reserve printed money from nothing. The increased money supply, without a corresponding increase in goods and services, reduced the value of each dollar, causing prices to rise quickly and leading to high inflation, effectively acting as a hidden tax on everyone.
Prices have increased by 19.5%, while real wages have declined by 1.8%. Average hourly earnings for all employees dropped 1.8% to $11.18 in June 2024 from $11.39 in January 2021, when Biden took office.
The typical U.S. household now requires $1,069 more each month (equivalent to $12,828 annually) compared to three years ago.
Many Americans feel a single income is insufficient to sustain their lifestyle. According to Bankrate’s Side Hustles Survey, more than one-third (36%) of U.S. adults work second jobs to earn extra money, often through gig apps, freelancing, or weekend jobs. Many rely on this additional income to cover essential living expenses like rent and groceries, with 32% believing they will always need this extra work to make ends meet. A survey by GOBankingRates from October 2023 also found that about four in ten adults continue to need side jobs.
Credit card debt and delinquencies are surging amid high interest rates. According to WalletHub analysis, credit card debt hit a new record high of $1.27 trillion in May 2024, 4% more than in May 2023. The average credit card debt is $10,479. According to the WalletHub survey, nearly one in three people say they will have more credit card debt by the end of 2024, and nearly one in four Americans are extremely stressed about their credit card debt.
Credit-card delinquency rates hit a record high of almost 3.5% in Q4, according to the Federal Reserve Bank of Philadelphia. This is the highest rate since the data series began in 2012, up by 30 basis points from the previous quarter.
Housing affordability has also collapsed under the weight of Bidenomics, and due to skyrocketing home prices and high mortgage rates, it is likely to become a significant issue in the 2024 election.
Persistent inflation and the Federal Reserve's stance on interest rates have contributed to the decline in home affordability. According to First American’s Real House Price Index (RHPI) report for May, affordability in the housing market is at its worst in over three decades, with no relief expected this year. The report shows a 9% year-over-year decline in affordability, driven by a 5.9% increase in nominal home prices and a 0.6% rise in the 30-year fixed mortgage rate.
The median home price when Biden took office was $335,000; it was $445,000 in June, an increase of 32.8%. The home price-to-income ratio has reached a record high of nearly 6-to-1. The monthly mortgage payment on a median-priced home has increased 115%. According to a recent analysis by the real estate site Redfin, prospective homebuyers need an annual income of $113,520 to afford a typical house in the U.S., which is 35% higher than the average household income of $84,072The last time the typical household income exceeded the amount needed to afford a median home was in February 2021, ironically, the month after Biden took office.
Nearly half of all renters spend more than 30% of their income on rent, with a quarter spending over 50%, making it difficult to save for a down payment.
Inflation is hitting wallets hard. According to a recent LendingTree survey, nearly 80% of Americans now consider fast food a 'luxury' due to its high prices. The survey found that 78% of consumers view fast food as a luxury purchase because of rising costs, with 62% eating it less frequently.
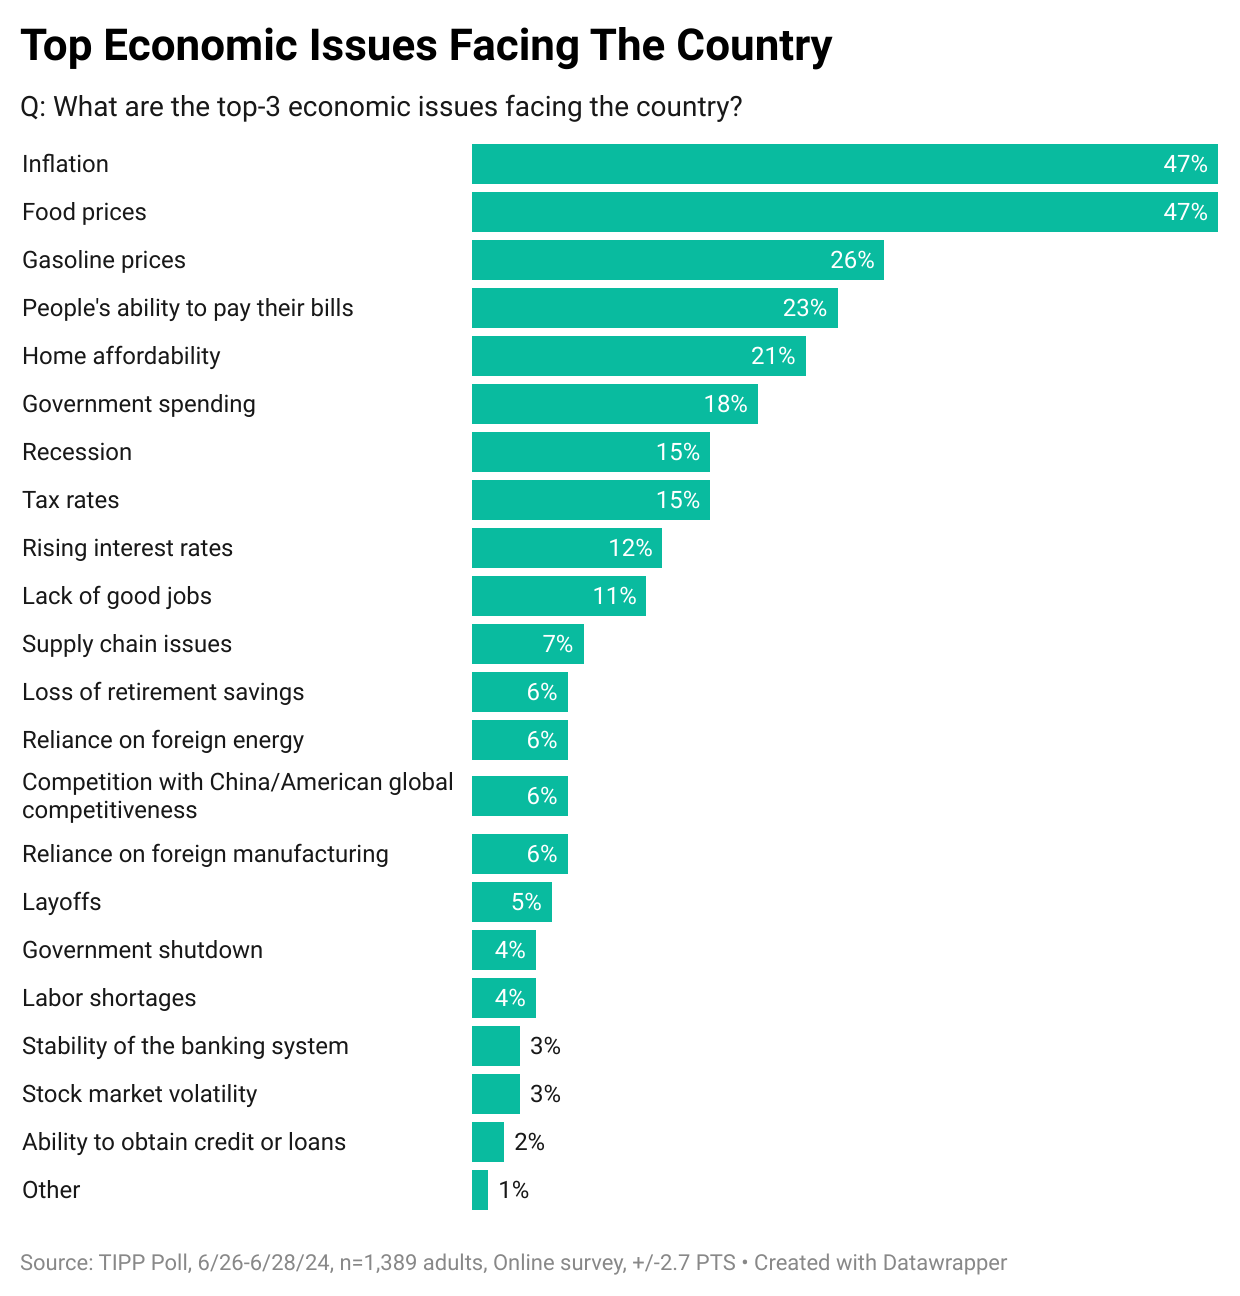
Therefore, it is unsurprising that inflation and food prices emerged as the top economic issues among Americans in a recent nationwide TIPP Poll.
CPI Report
The government's Consumer Price Index (CPI), released on Wednesday, showed a 3.0% year-over-year price increase from June 2023 to June 2024.
The CPI rate declined steadily for 12 consecutive months, from a 40-year high of 9.1% in June 2022 to 3.0% in June 2023. An increase to 3.2% in July 2023 interrupted this trend. Since then, the CPI rate has fluctuated, with the lowest reading of 3.0% in June 2024.
After adjusting for seasonality, the Consumer Price Index (CPI) declined by 0.1% between May 2024 and June 2024 for the first time in more than four years. During the same period, food prices increased by 0.2%, energy prices declined by 2.0%, and core prices (all items except food and energy) increased by 0.1%.
If you dig deeper, you will notice that the apparent improvement in the inflation situation is an illusion due to the Base Effect. The CPI Index increased from 314.07 in May to 314.18 in June this year, a 0.04% increase. However, during the same period last year, it had increased at a sharper rate of 0.32%, from 304.13 in May to 305.11 in June. The "base effect" creates the illusion of improvement, making it seem that the decrease in the inflation rate from 3.3% in May to 3.0% in June is an improvement, even though inflation persists at a slightly worse level on the CPI Index. The media has not yet widely acknowledged this observation.
TIPP CPI
We developed the TIPP CPI, a metric that measures the rate of change using February 2021, the month after President Biden's inauguration, as the base. All TIPP CPI measures are anchored to this month, making them exclusive to the economy under President Biden's watch.
What is the motivation behind the TIPP CPI?
Although prices aren't rising as quickly as before, today's inflation is adding to past increases, making it even harder for Americans to manage their expenses. The BLS CPI rate doesn't accurately capture Americans’ inflation struggles.
The official BLS CPI year-over-year calculations compare prices to already inflated bases, and these statistics could mask the full impact. Further, the media and some economists frequently use the low CPI rate to present a rosy economic outlook supporting Biden’s policies.
In contrast, the TIPP CPI rate offers a clearer understanding of Americans’ economic challenges under President Biden. We use the relevant data from the Bureau of Labor Statistics (BLS) to calculate the TIPP CPI, but we adjust the period to Biden's tenure. When discussing the TIPP CPI and the BLS CPI, we convert the index numbers into percentage changes to better understand and compare them. CPIs are like index numbers that show how prices affect people's lives, similar to how the Dow Jones Industrial Average reflects the stock market.
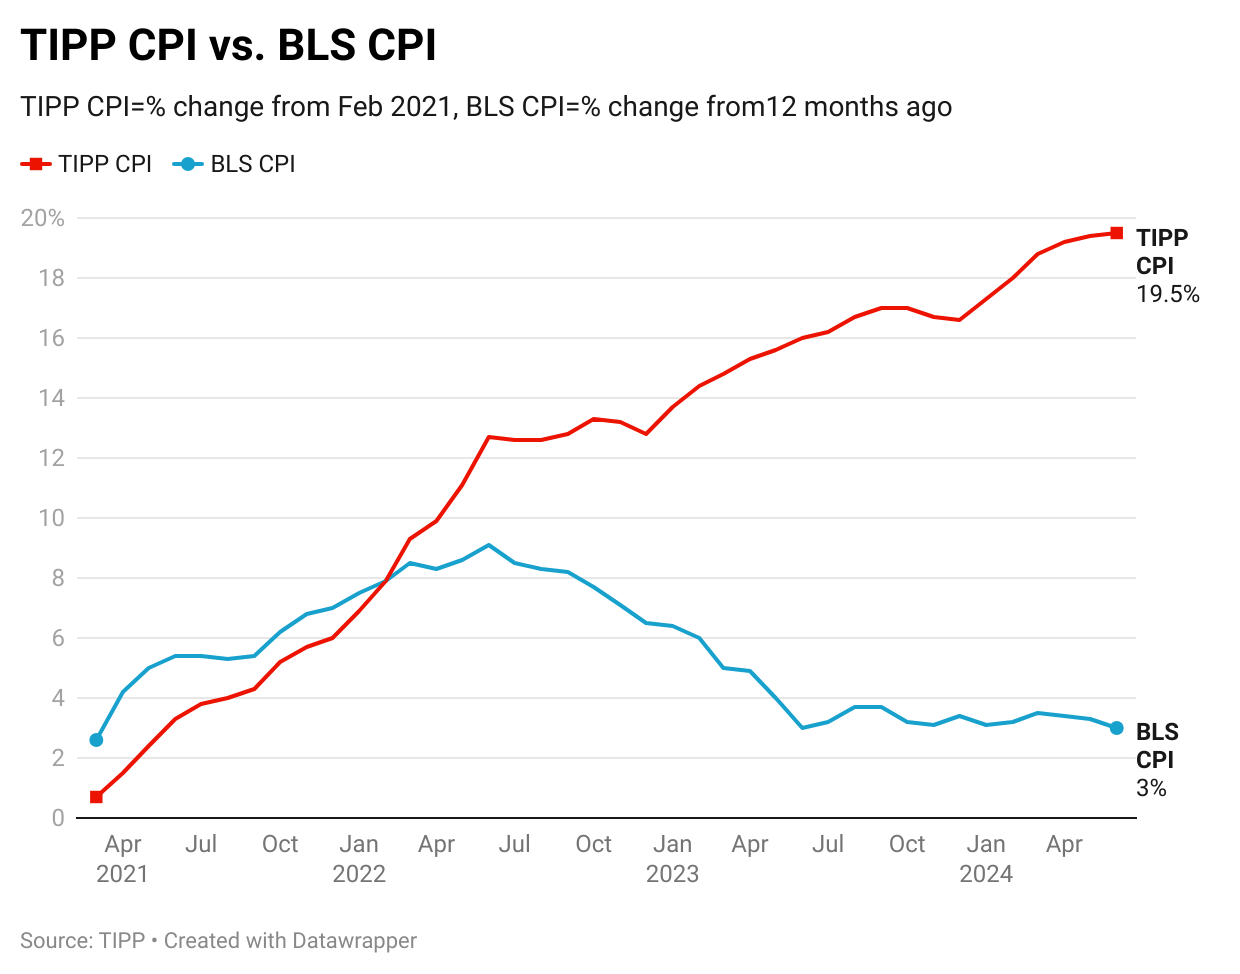
Bidenflation, measured by the TIPP CPI using the same underlying data, increased to 19.5% in June. It was 19.4% in May, 19.2% in April, 18.8% in March, 18.0% in February, 17.3% in January, and 16.6% in December.
TIPP CPI vs. BLS CPI
The following two charts present details about the new metric.
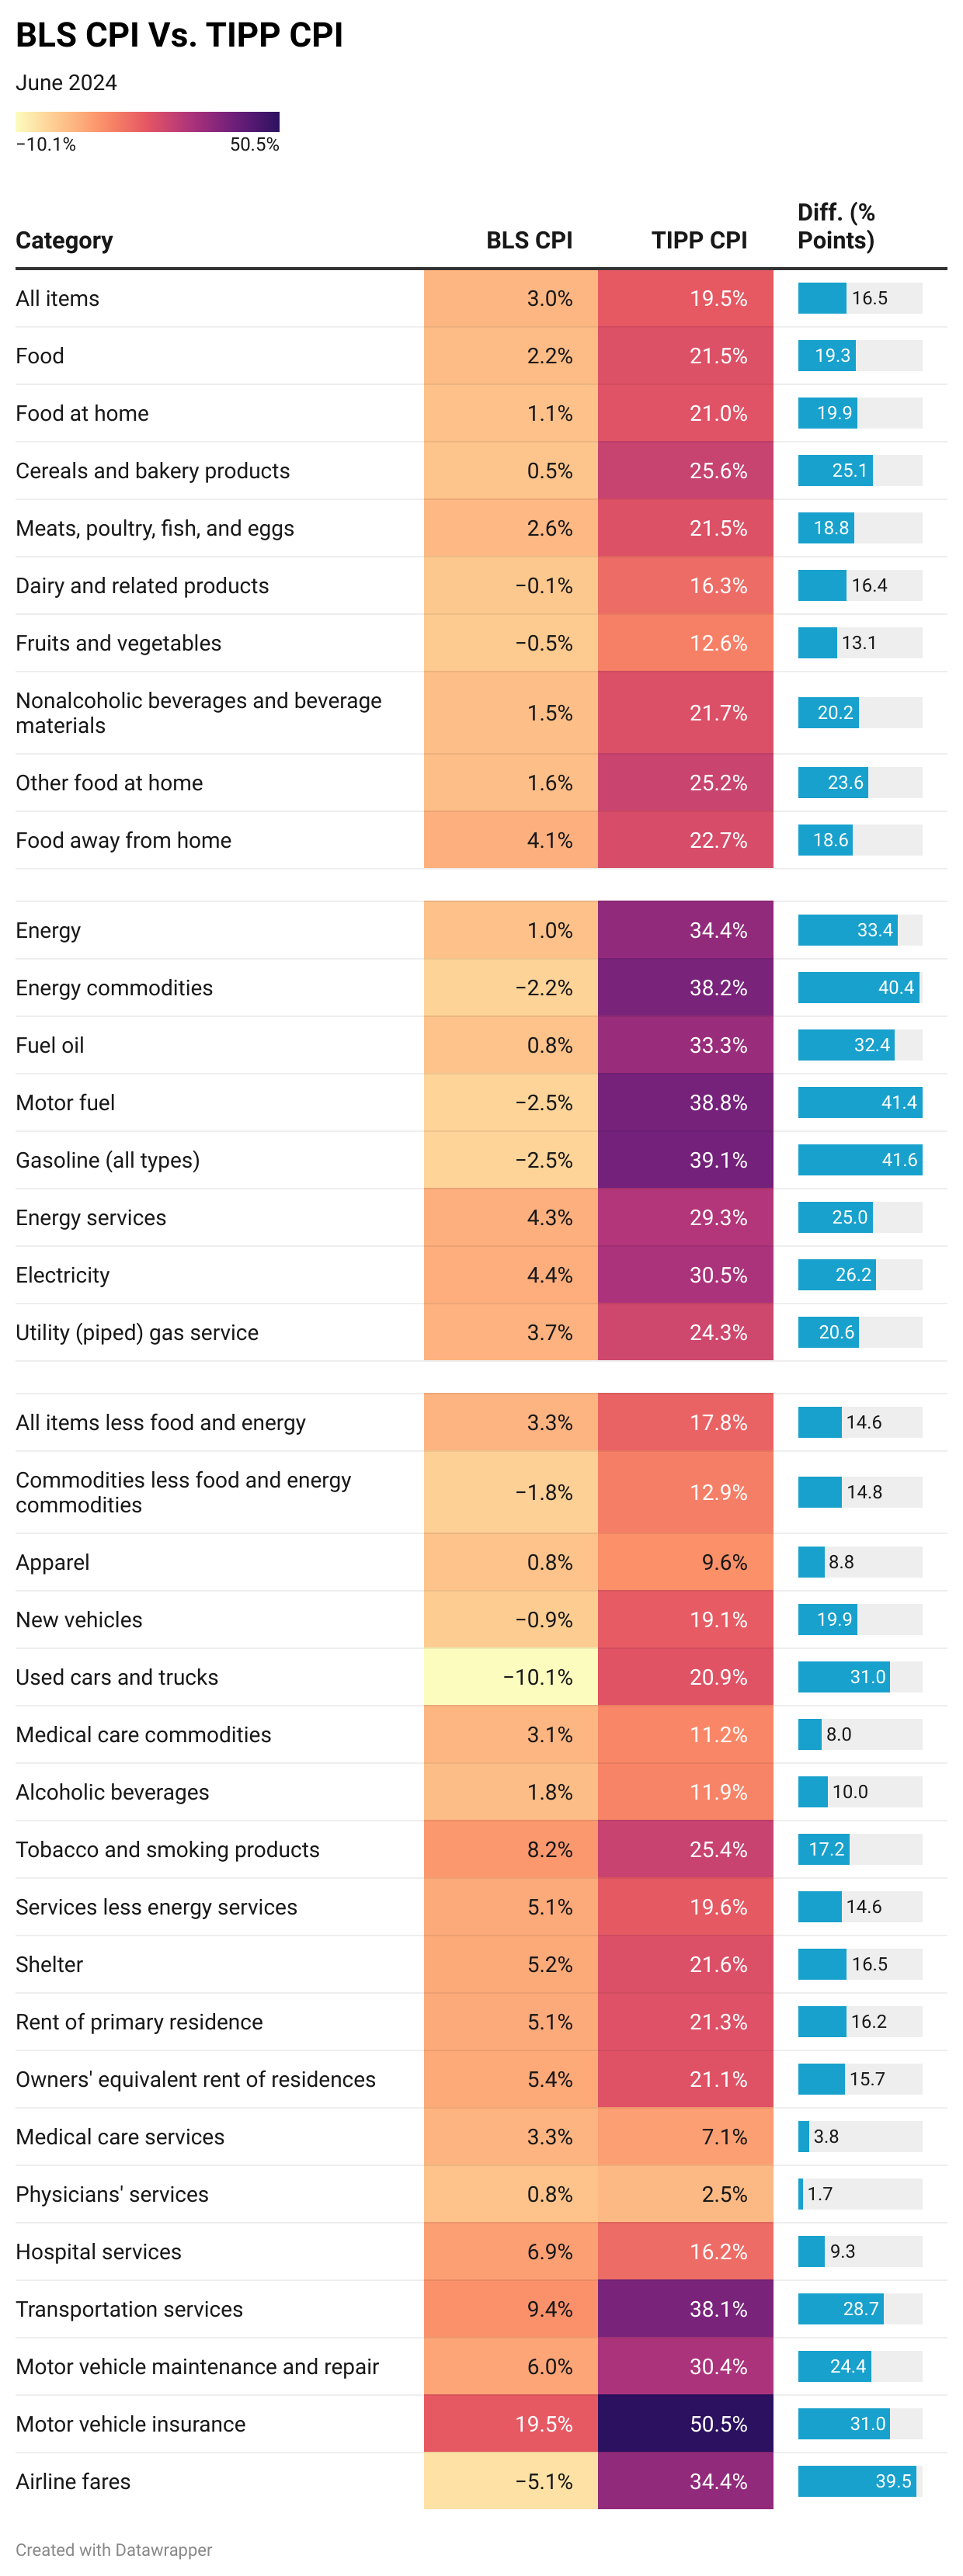
For June 2024, the BLS reported a 3.0% annual CPI increase. Compare this to the TIPP CPI of 19.5% - a 16.5-point difference. Prices have increased by 19.5% since President Biden took office. On an annual basis, the TIPP CPI rate is 5.7%.
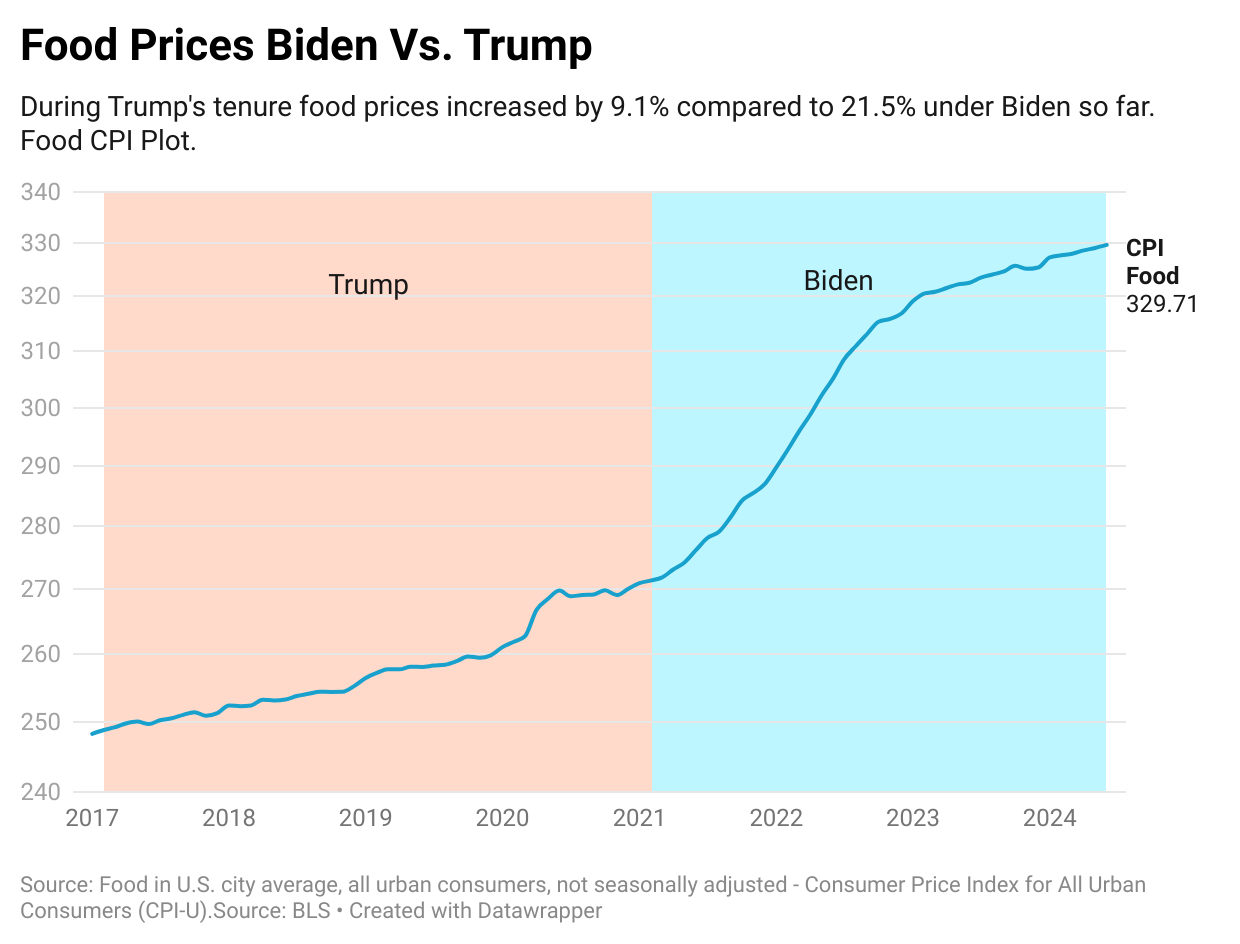
Food prices increased by 21.5% under Biden per TIPP CPI, compared to only 2.2% as per BLS CPI, a difference of 19.3 points.
TIPP CPI data show that Energy prices increased by 34.4%. But, according to the BLS CPI, energy prices rose by 1.0%. The difference between the two is a whopping 33.4 points.
The Core CPI measures the price increase for all items, excluding food and energy. The Core TIPP CPI is 17.8% compared to 3.3% BLS CPI, a 14.5-point difference.
Further, gasoline prices have increased by 39.1% since President Biden took office, whereas the BLS CPI shows that gasoline prices have declined by 2.5%, a difference of 41.6 points.
Shelter costs rose by 21.6% under Biden’s watch, compared to the BLS reading of 5.2%, a difference of 16.5 points.
TIPP CPI finds that Used car prices have risen by 20.9% during this President’s term. Meanwhile, the BLS CPI reports that the prices have dropped 10.1%, a difference of 31.0 points.
Air ticket inflation is 34.4% compared to the BLS CPI’s finding of an improvement of 5.1%, a difference of 39.5 points.
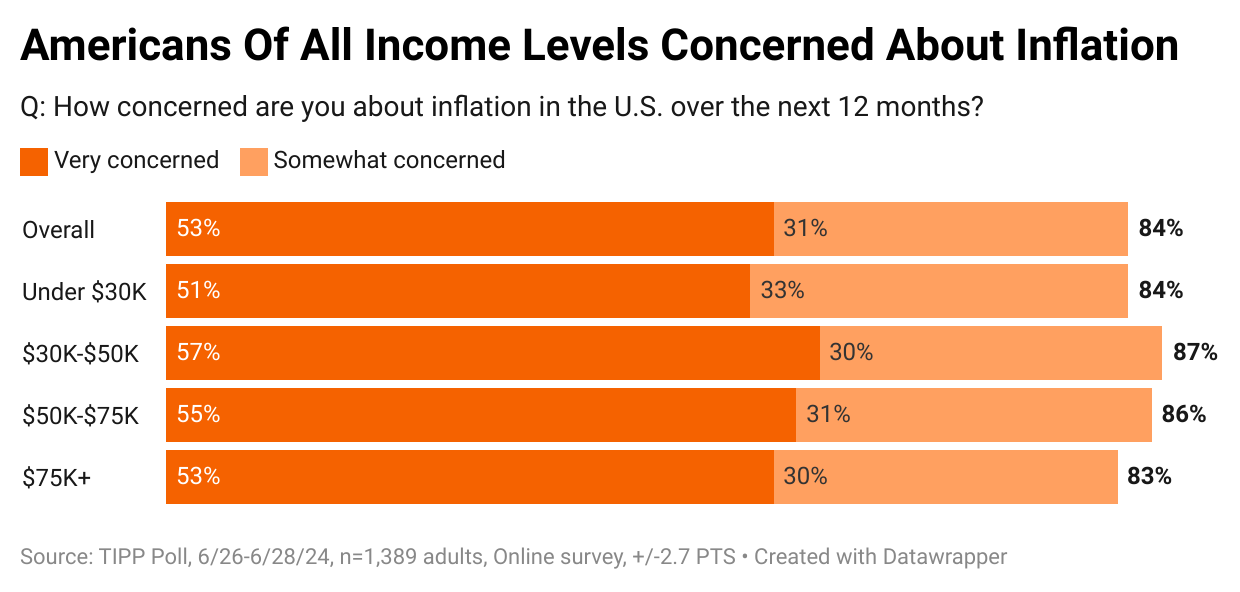
The latest TIPP Poll, completed at the end of June, shows that nearly nine in ten (84%) survey respondents are concerned about inflation. As the chart below shows, the concern is shared by all income levels.
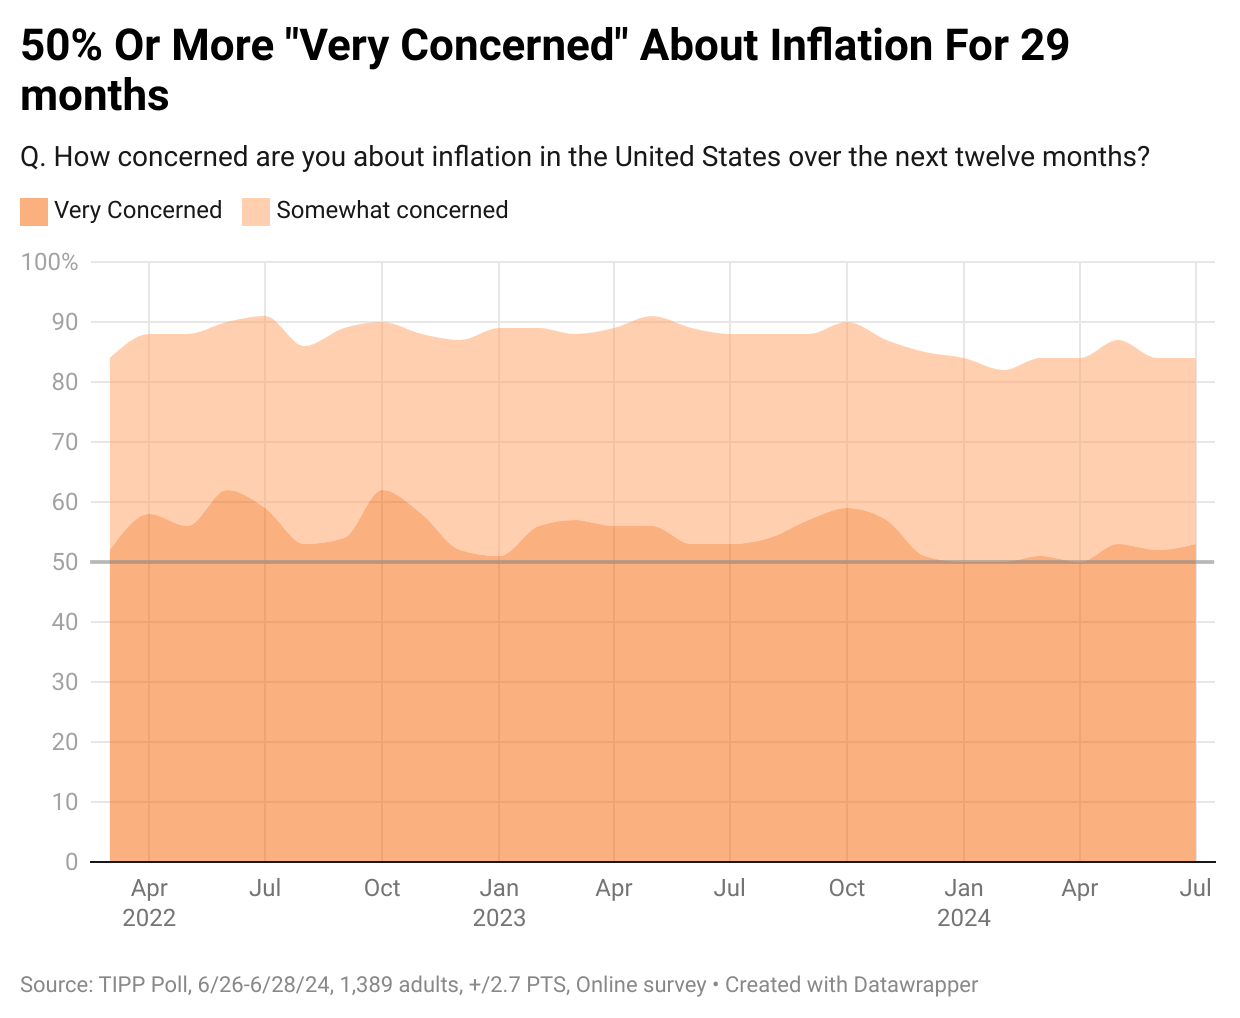
Since January 2022, inflation concerns have stayed above 80%. The "very concerned" share has been at least 50% since March 2022, i.e., for twenty-nine months.
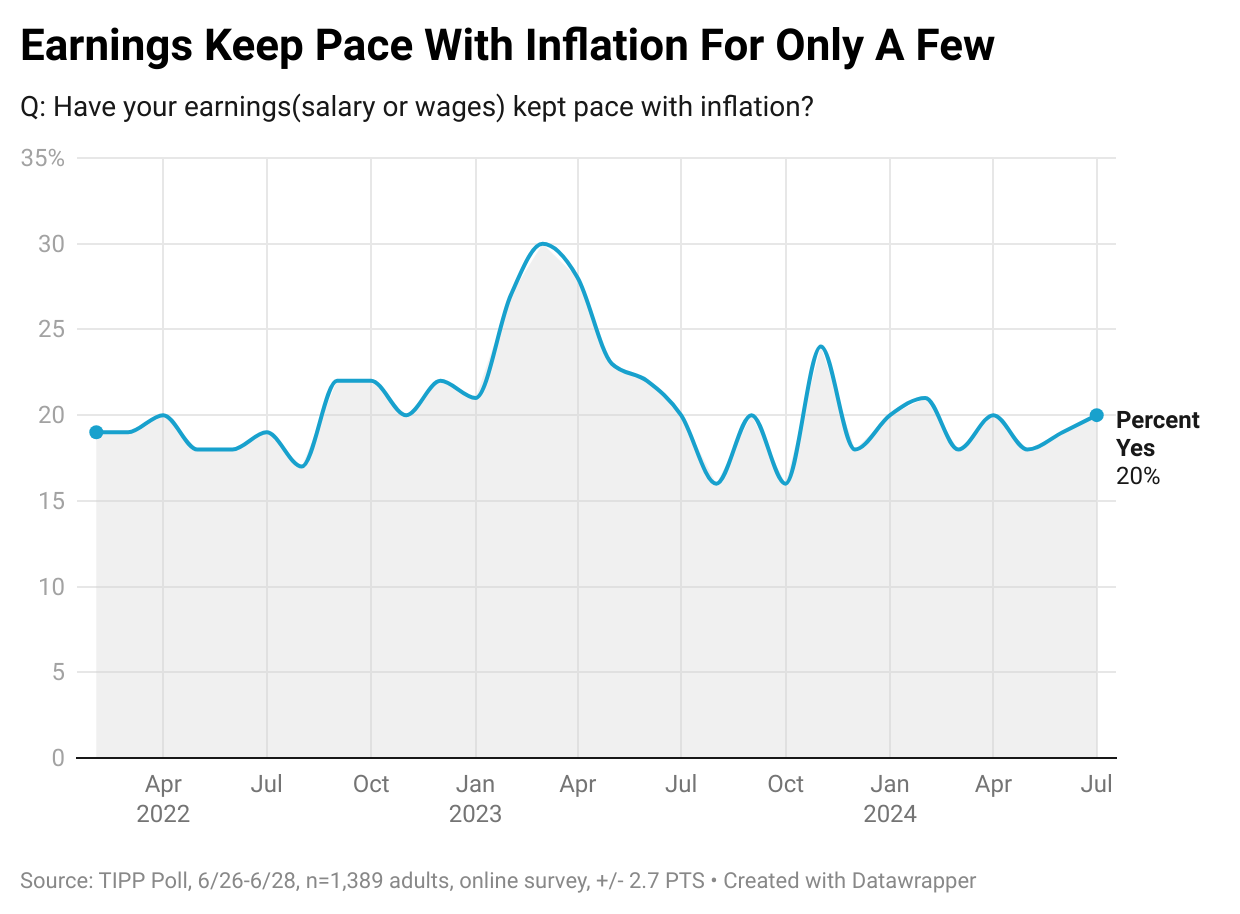
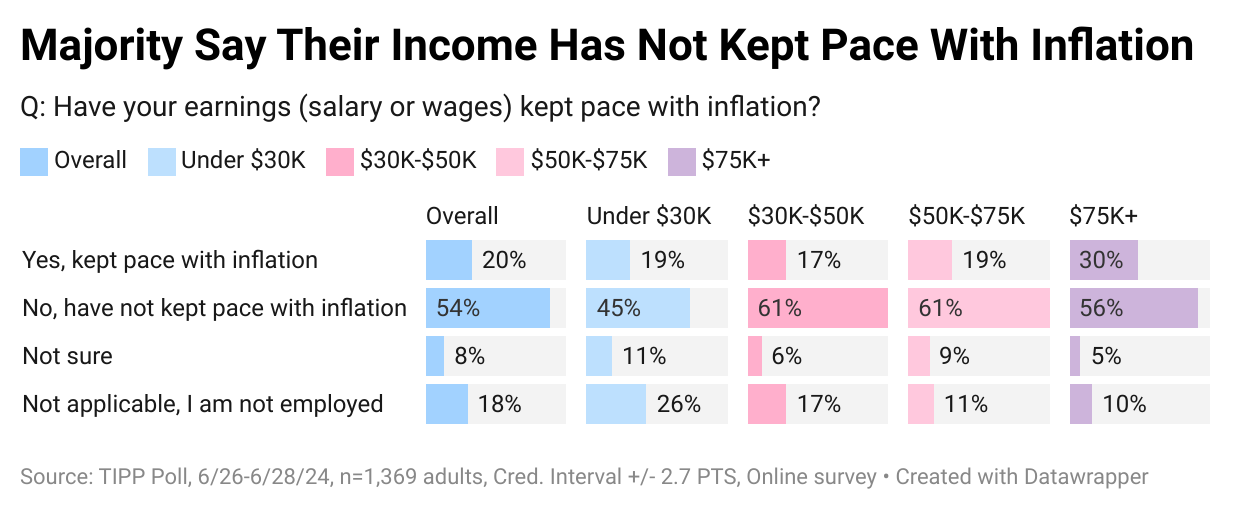
Over half (54%) say their wages have not kept up with inflation, while only one in five (20%) say their income has. Since December 2023, this statistic has moved in a tight 18% to 21% range.
Our data shows that households in all income brackets are likely to say that their earnings have kept pace with inflation: 19% for under $30K and 17% for $30K—$50K, 19% for $50K—$75K, and 30% for $75K+ households.
Nominal wages represent the amount of money one earns without considering changes in the cost of living. On the other hand, real wages consider inflation and measure the purchasing power of wages. Real wages provide a more accurate reflection of what is affordable with the income earned by factoring in the changes in the cost of living.
Real weekly wages, measured year-over-year, showed negative readings for 26 out of the 41 months during the Biden presidency from February 2021 to June 2024. The 26-month negative streak was broken in June 2023. Since then, the measure has posted positive readings.
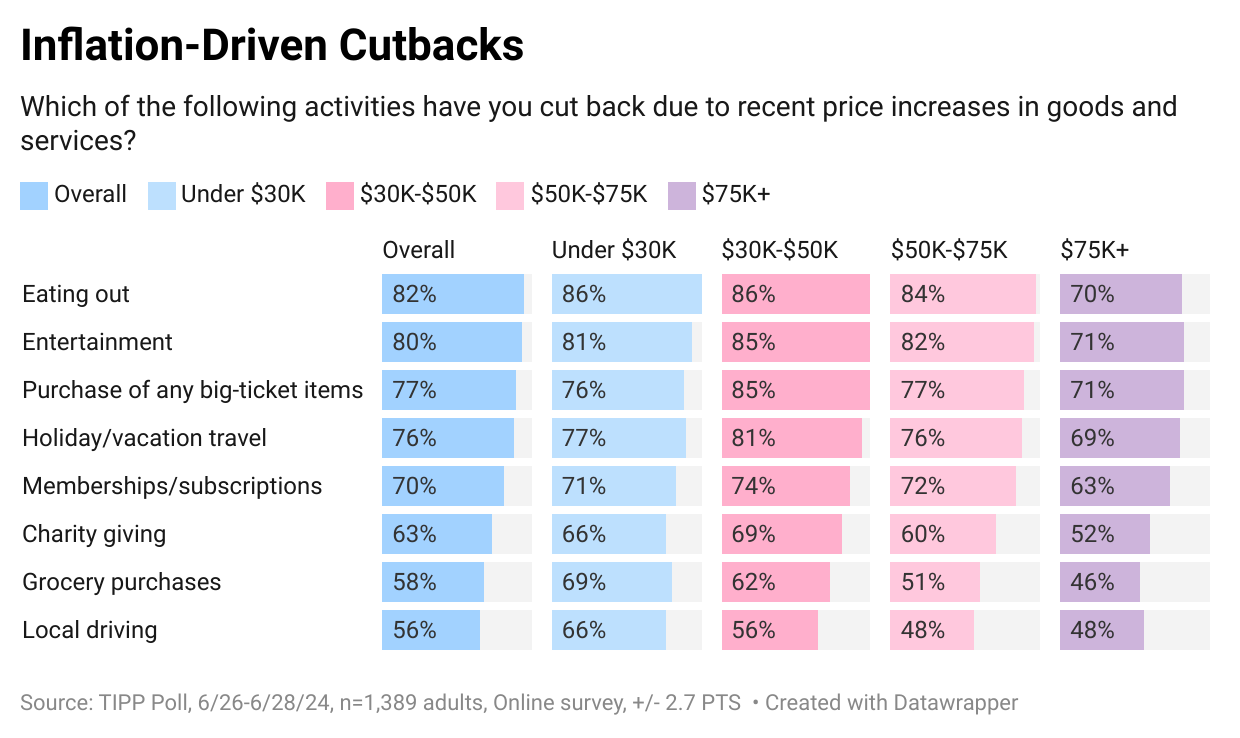
As a result of inflation, Americans are cutting back on household spending.
They are cutting back on eating out (82%), entertainment (80%), purchasing big-ticket items (77%), holiday/vacation travel (76%), and memberships/subscriptions (70%).
Nearly two-thirds (63%) are cutting back on charity giving. Over half (58%) of households spend less on groceries, and the high gasoline prices forced 56% to cut back on local driving.
The cutbacks are more prevalent among lower-income households than their higher-income counterparts.
Inflation Direction
The chart below compares the 12-month average of monthly changes against the 6-month and the 3-month averages. We also show the reading for June 2024.
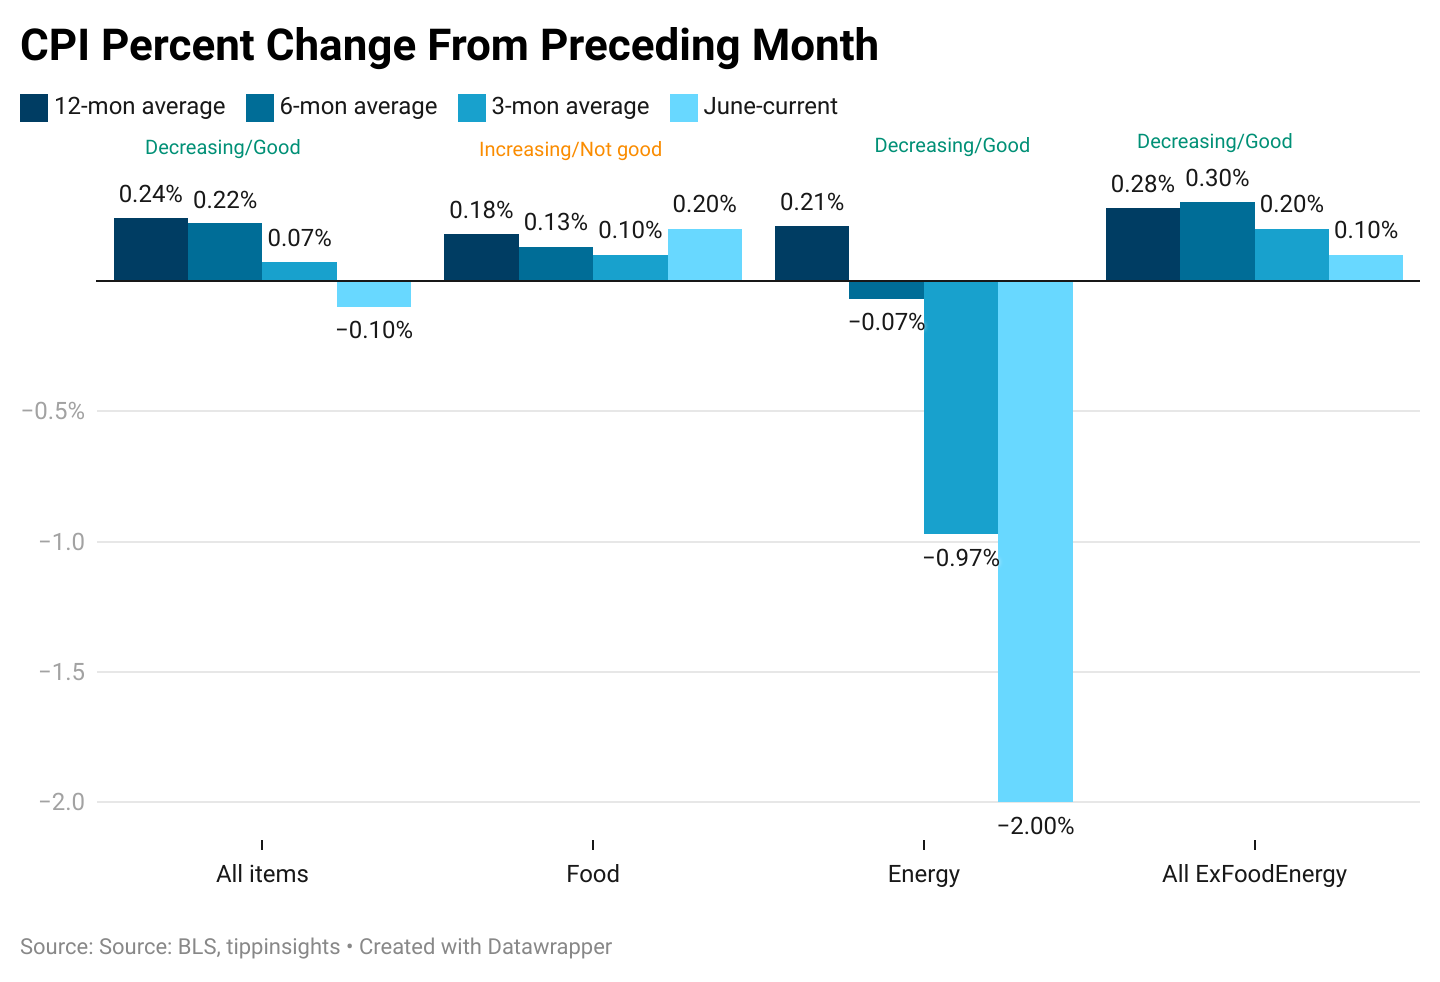
The 12-month average considers 12 data points and presents a long-term reference, while the six-month and three-month averages consider recent data points.
Typically, we compare the June 2024 data to the three-month average to gain a clearer perspective. In June 2024, the all-items category declined by 0.10%, less than the three-month average of 0.07%. This indicates an improvement in June.
Meanwhile, the three-month average of 0.07% is smaller than the six-month average of 0.22%, indicating a recent slowdown over the last three months. Furthermore, the six-month average of 0.22% is smaller than the twelve-month average of 0.24%. Therefore, the data shows a decreasing stair-step pattern, consistent with an overall improvement.
In June, Food prices increased by 0.2%, higher than the three-month average of 0.10%. Although the three-month average is smaller than the six-month average of 0.13%, the June increase is concerning.
Meanwhile, Energy prices declined by 2.00%, a greater decrease than the three-month average of -0.97%, indicating a slowdown. The three-month average is lower than the six-month average of -0.07% and the twelve-month average of 0.21%. In summary, the data presents an improving picture.
All items less food and energy, known as "core inflation," was 0.10%, lower than the three-month average of 0.20%. Further, the three-month average of 0.20% was smaller than the six-month average of 0.30%. The data here again shows improvement.
In summary, except for food, we witnessed an improvement in energy prices, core items, and all items in June.
Based on our trend analysis, June was a good month.
Monetary Policy
The Federal Reserve's ongoing efforts to control inflation by maintaining high interest rates contribute to the financial strain.
Since March 2022, the Fed has raised interest rates 11 consecutive times, bringing its benchmark interest rate to 5.25%, the highest level in 22 years.
With the core CPI entrenched at 3.0% and geopolitical tensions that could lead to volatility in the energy markets, we are unsure of what lies ahead. We believe it won't be easy to bring CPI inflation down to the Fed's target of 2.0%.
JPMorgan Chase CEO Jamie Dimon on Friday said:
There has been some progress bringing inflation down, but there are still multiple inflationary forces in front of us: large fiscal deficits, infrastructure needs, restructuring of trade and remilitarization of the world. Therefore, inflation and interest rates may stay higher than the market expects.
On Tuesday, Federal Reserve Chair Jerome Powell was concerned that holding interest rates too high for too long could jeopardize economic growth. Powell said in remarks during his Capitol Hill appearances this week:
Reducing policy restraint too late or too little could unduly weaken economic activity and employment.
In an election year, the Fed must balance rate cut pressures to help Biden's reelection and the larger interest of taming inflation.
Fiscal Policy
The national debt is kissing $35 trillion, according to the Debt to the Penny dataset, which the Treasury updates daily. For the current fiscal year, which began in October 2023, the U.S. is expected to pay over $1 trillion in interest, more than the U.S. defense budget.
Most Americans are concerned about the sustainability of this trajectory. The high interest rates are also hurting Americans and sapping their confidence.
Earlier this month, Fed Chairman Powell expressed concerns about a large deficit being run during full employment. Powell said:
The level of debt we have is not unsustainable, but the path that we’re on is unsustainable.
He urged policymakers to prioritize fiscal sustainability, warning that running large deficits during good economic times cannot continue indefinitely. He said:
In the longer run, we’ll have to do something sooner or later, and sooner will be better than later.
Monetary policy alone can’t fix inflation without fiscal austerity—a lesson President Biden would never learn.
We agree with Jamie Dimon. Inflation is here to stay. Coupled with a slowing economy, “the stag,” expect Bidenflation to transform into stagflation.
Your feedback is incredibly valuable to us. Could you please take a moment to grade the article here?
To access the TIPP CPI readings each month, you can visit tippinsights.com. We'll publish the TIPP CPI and our analysis in the days following the Bureau of Labor Statistics (BLS) report. The upcoming release of TIPP CPI is on August 17, 2024. We'll also post a spreadsheet in our store for download.
Hey, want to dig deeper? Download data from our store for a small fee!


