
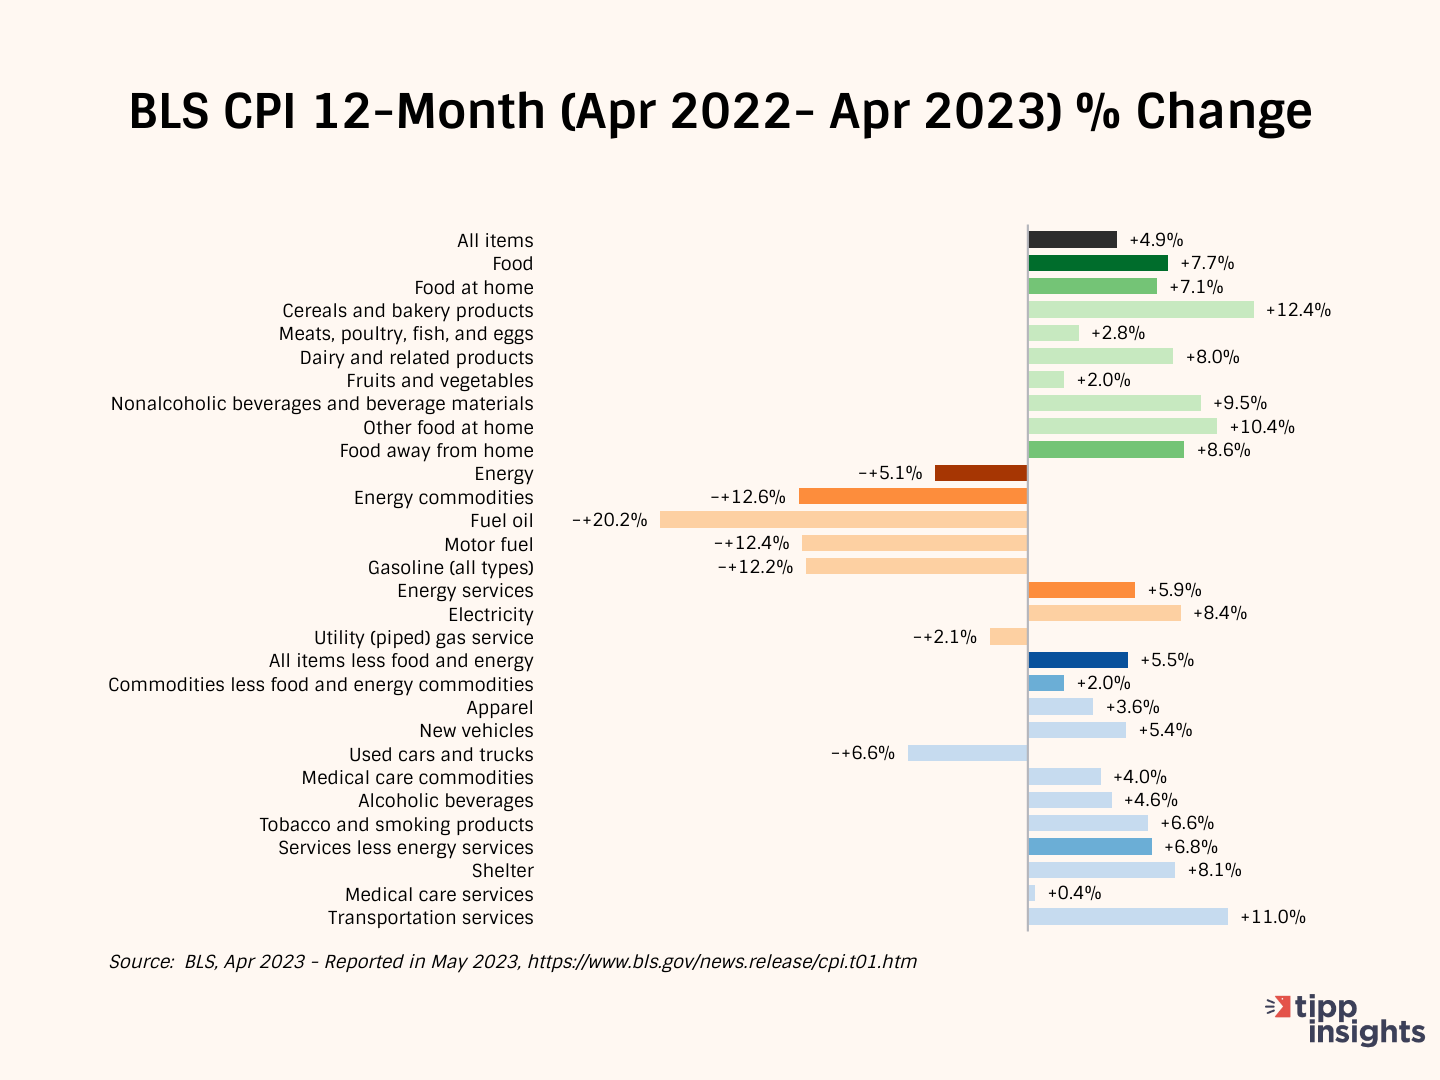
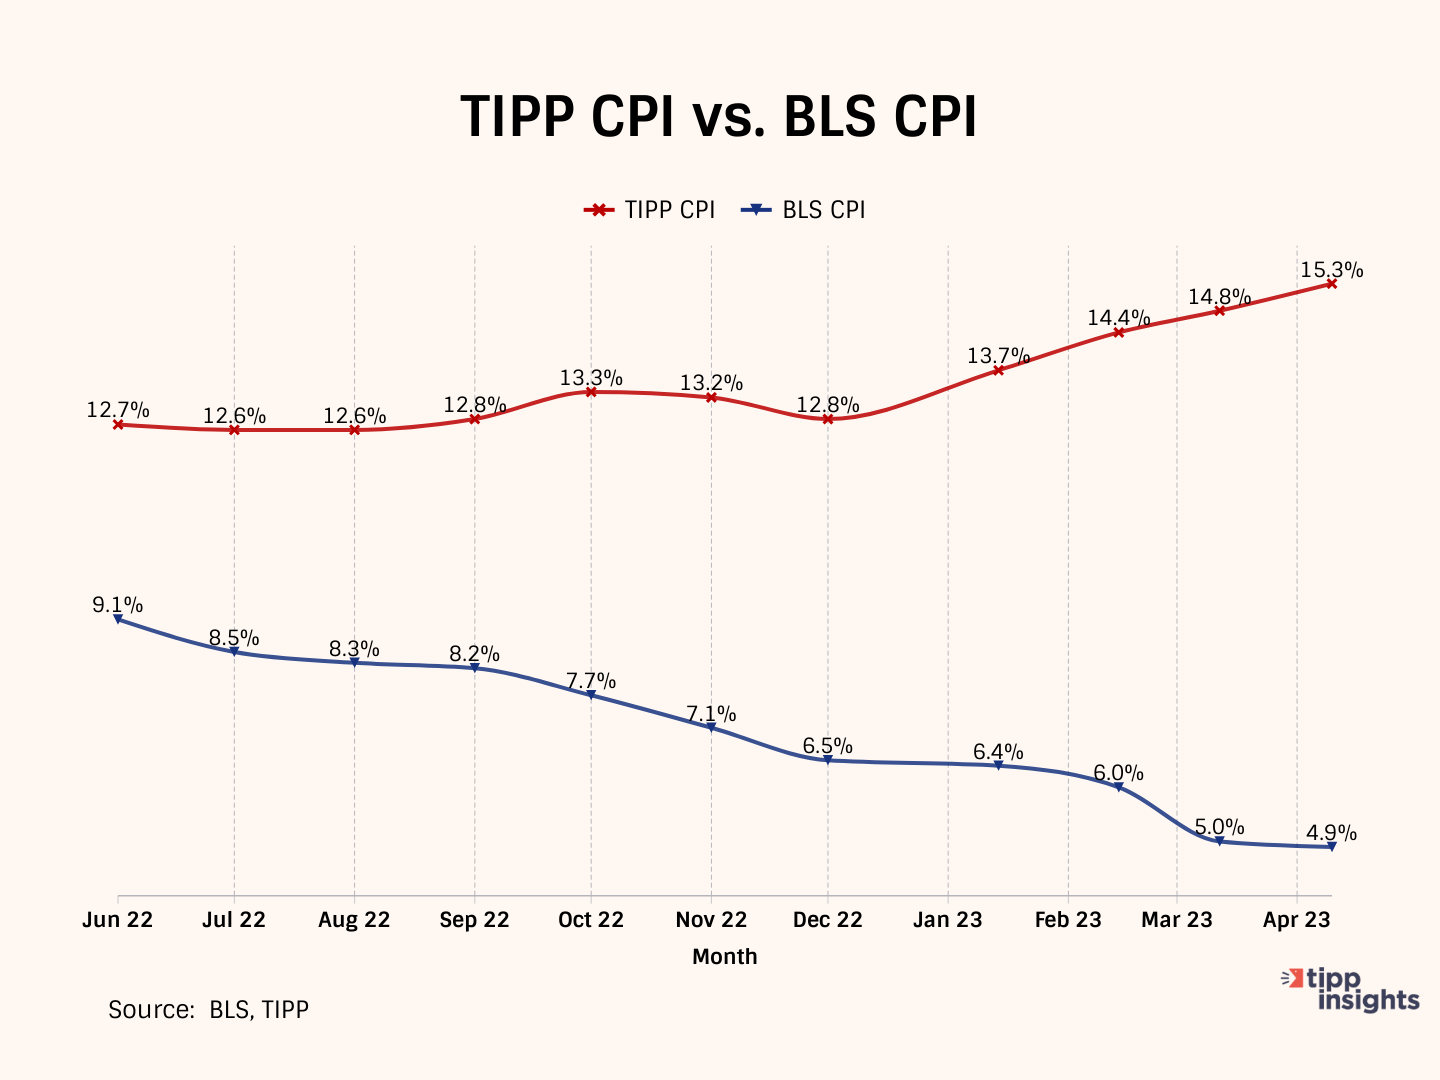
The Consumer Price Index (CPI) released by the government on Wednesday showed a 4.9% year-over-year increase in prices from April 2022 to April 2023, declining from a rate of 5.0% in March, 6.0% in February, and 6.4% in January. The CPI has declined steadily from a 40-year high of 9.1% in June to 4.9% in April. However, the CPI rose 0.4% last month after adjusting for seasonality and 0.5% on an unadjusted basis.
The media headlines read:
Annual inflation cooled last month to the lowest level since April 2021
Inflation rate eases to 4.9% in April, less than expectations
But few media outlets provided context, partly because doing so would shed the Biden administration in a terrible light and does not fit the narrative. But numbers do not lie, so, we are happy to oblige and fill in the gaps.
Our conclusion: The Biden economy continues to be the worst-performing going back to President Carter. From February 2021, the first full month that President Biden served in office, the price of every commodity, from food, to gasoline, to used cars, and air tickets, continues to rise. The rate of rise has slowed, but prices are still increasing month over month.
As we have noted numerous times, President Biden is extremely irresponsible for standing his ground and not negotiating with the GOP to lower spending. His reckless spending has resulted in inflation levels not seen for 40 years.
America’s debt burden is higher as the cost of servicing America’s deficits goes up, with inflation being so high. Each time the Federal Reserve increases interest rates to contain inflation, the U.S. government must also pay higher interest rates to service its ballooning debt.
The CPI inflation rate measures how much more expensive things are getting over time. The government calculates the increase in the CPI rate over 12 months, so the base for April 2023 is April 2022, and for March 2023 is March 2022.
In April 2023, the CPI index was 303.363, 4.9% higher than its base of 289.109 for April 2022. And in March 2023, the CPI index was 301.836, 5.0% higher than its base of 287.504 for March 2022.
Between March 2022 and April 2022, the base increased sharply by 1.605 points or 0.56%. Even though the CPI index increased by 0.5% between March and April 2023, the headline CPI rate dropped from 5.0% to 4.9% because of the "base effect."
In other words, the rate seemed lower than it actually was because the base was higher in April 2022. Things were getting more expensive but more expensive at a slower rate than the previous year. Only in Washington is this good news.
TIPP CPI
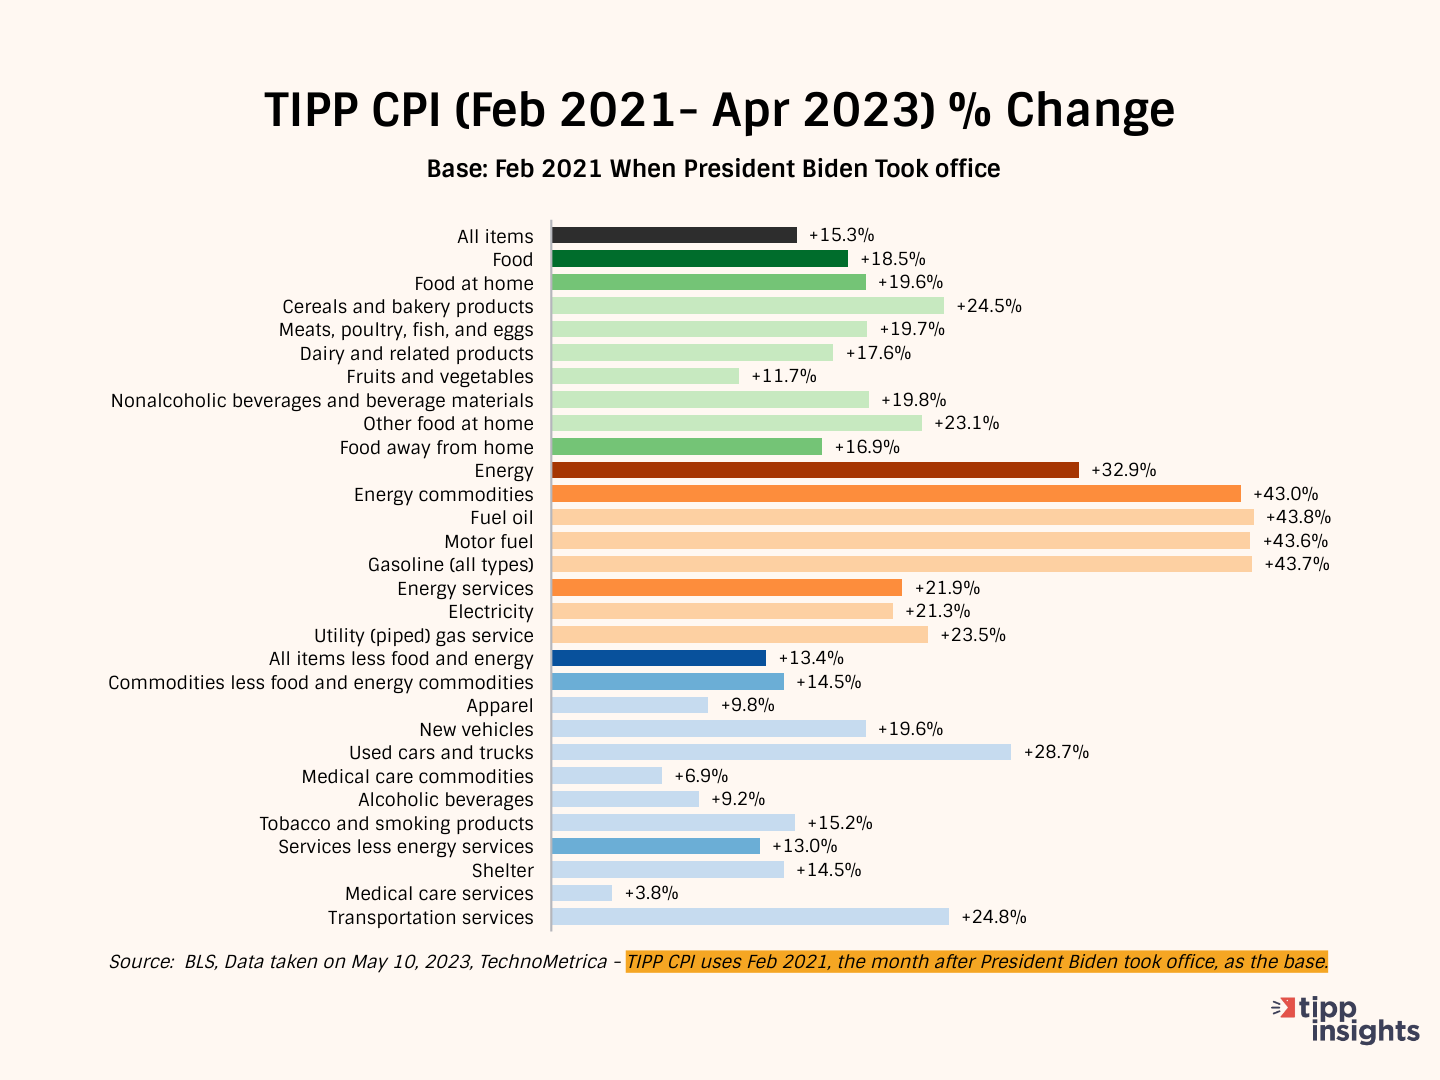
We developed the TIPP CPI, a metric that uses February 2021, the month after President Biden's inauguration, as its base. We measure the rate of change in the economy from this base. All TIPP CPI measures are anchored to the base month of February 2021, making it exclusive to the economy under President Biden's watch.
We use the relevant Bureau of Labor Statistics (BLS) underlying data but recalibrate it to arrive at the TIPP CPI. CPIs are index numbers that give Americans a sense of how prices impact their lives, much like the Dow Jones Industrial Average is a bellwether of the stock market.
But we convert index numbers to percent changes when we refer to TIPP CPI and BLS CPI.
Bidenflation, measured by TIPP CPI using the same underlying data, stood at 15.3% in April. It was 14.8% in March, 14.4% in February, and 13.7% in January.
Significant inflation had already set in by the middle of 2021. In April 2022, CPI inflation was 8.3 percent. The official CPI year-over-year increases will compare prices to inflated bases in the coming months. The year-over-year calculation may moderate the statistics, but you will still feel the pinch of inflation.
TIPP CPI vs. BLS CPI
The following four charts present details about the new metric.
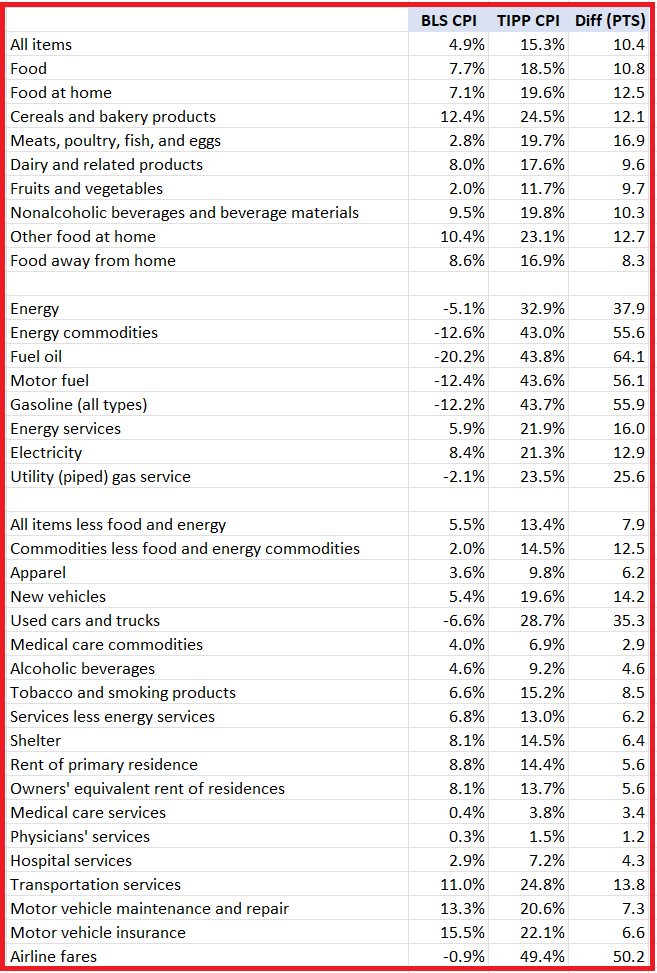
The annual CPI increase reported by BLS is 4.9% for April 2023. Compare this to the TIPP CPI of 15.3%, a 10.4-point difference. Prices have increased by 15.3% since President Biden took office. On an annualized basis, TIPP CPI is 6.7%.
Food prices increased by 18.5% under President Biden's watch compared to only 7.7% as per BLS CPI, a difference of 10.8 points.
TIPP CPI data show that energy prices increased by 32.9%. But, according to the BLS CPI, energy prices declined by 5.1%. The difference between the two is a whopping 37.9 points.
The Core CPI is the price increase for all items, excluding food and energy. The Core TIPP CPI was 13.4% compared to 5.5% BLS CPI in the year-over-year measure, a 7.9-point difference.
Further, gasoline prices have increased by 43.7% since President Biden took office, whereas the BLS CPI shows that gasoline price has improved by 12.2%, a difference of 55.9 points.
Used car prices have risen by 28.7% during President Biden's term. The BLS CPI shows that the prices have dropped by 6.6%, a difference of 35.3 points.
Inflation for air tickets under President Biden is 49.4% compared to the BLS CPI finding of improvement of 0.9%, a difference of 50.2 points.
Americans' Concerns
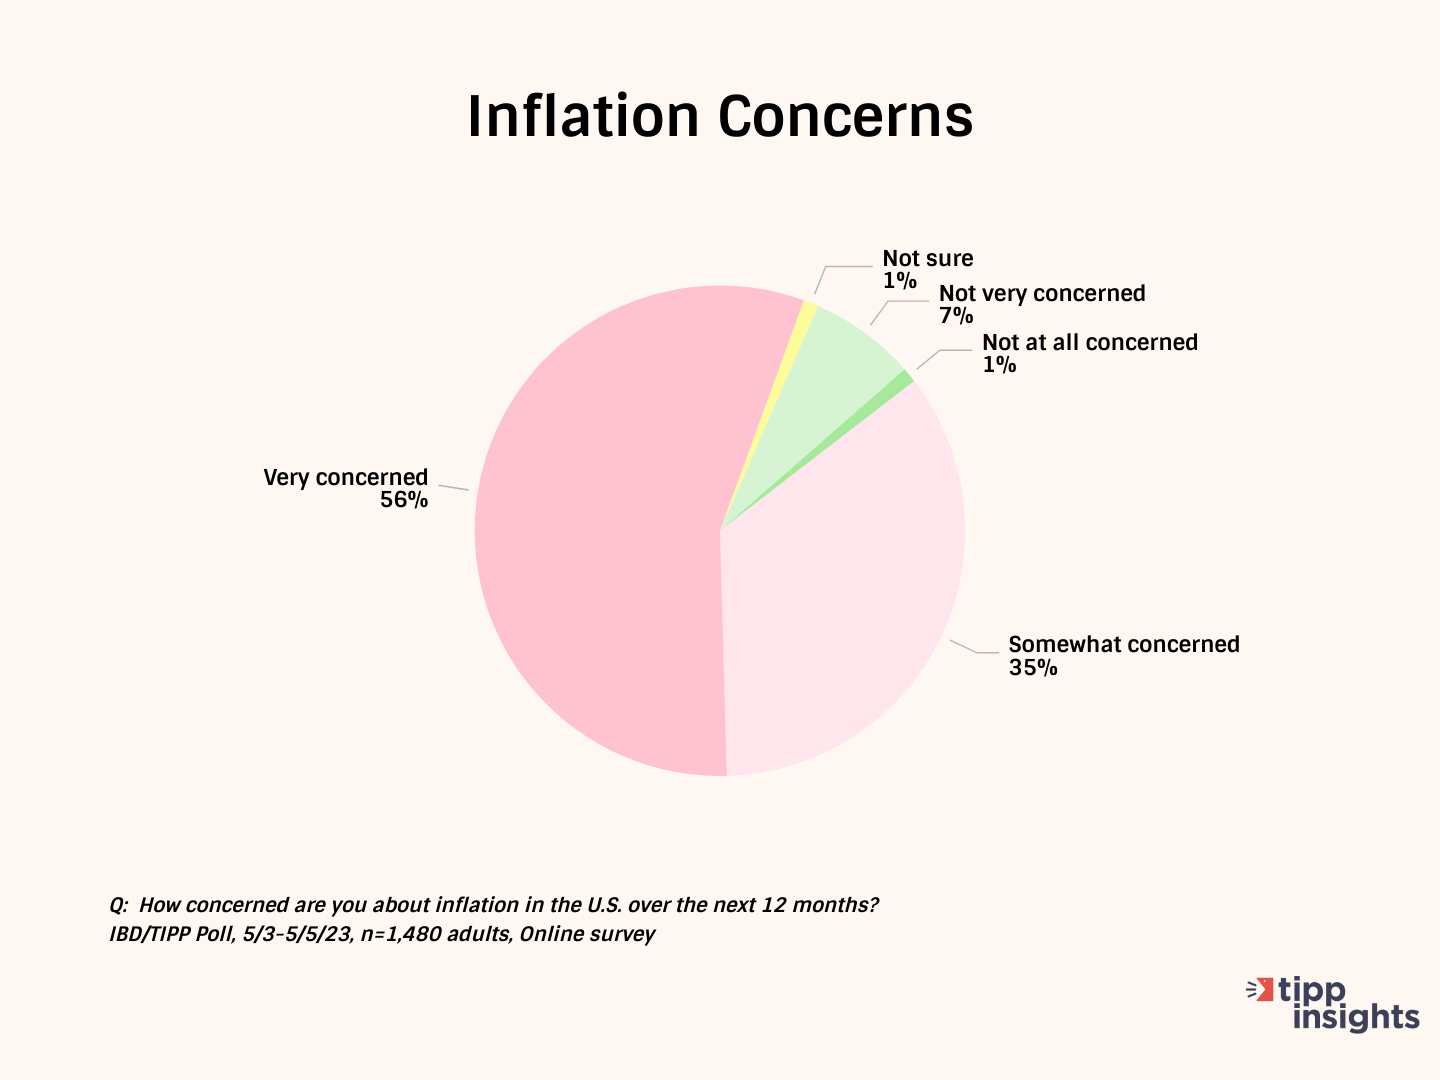
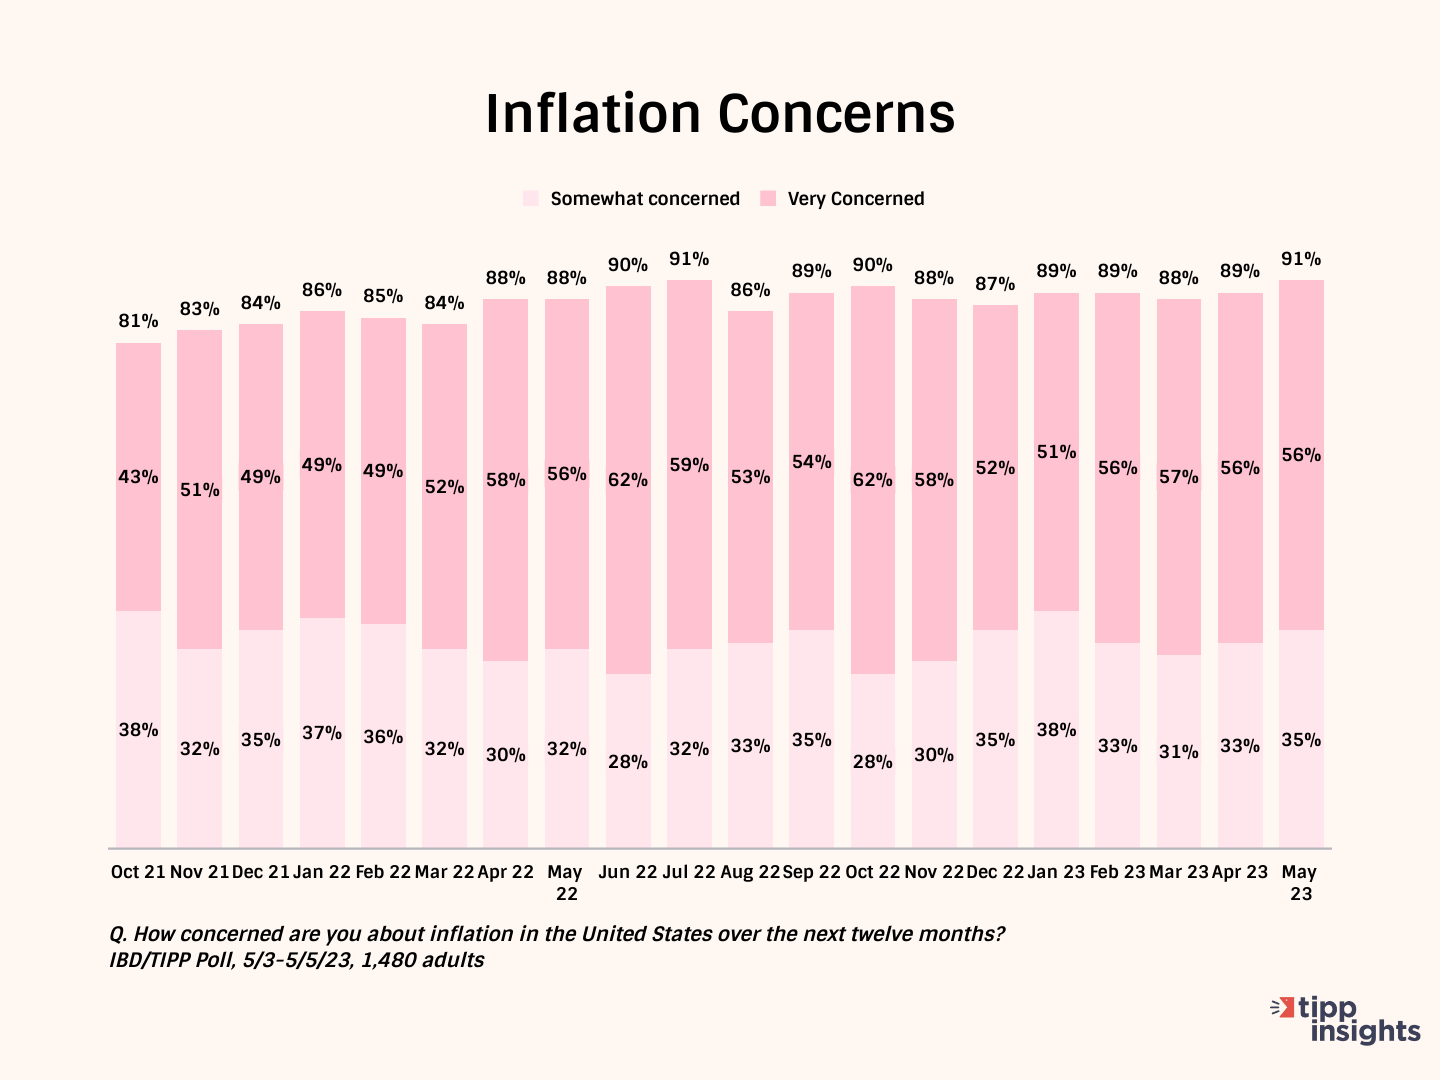
The latest Investor's Business Daily/TIPP Poll, completed earlier this month, shows that nine in ten (91%; 89% in April) survey respondents are concerned about inflation. Throughout the past year, inflation concerns have stayed above 85%. The share of "very concerned" has been over 50% for twelve consecutive months.
Over half (52%, 45% in April) say their wages have not kept up with inflation. Only 23% (28% in April) say their income has kept pace with inflation.
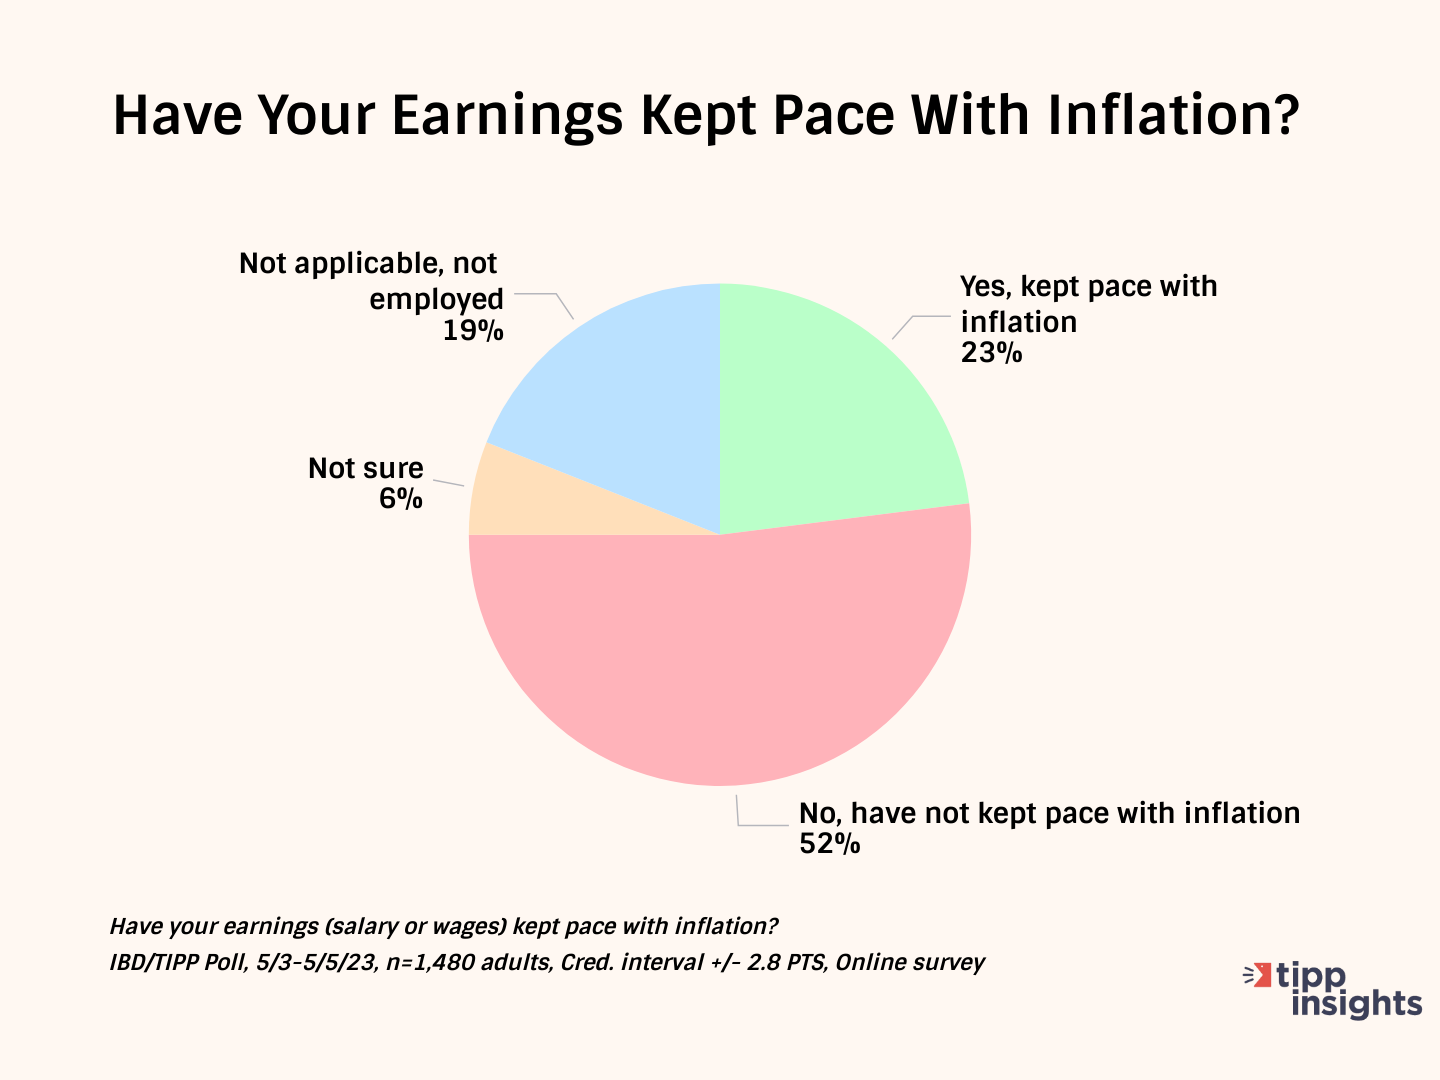
This statistic hovered in the low twenties for most of the last year. The positive change in the recent three months petered out this month.
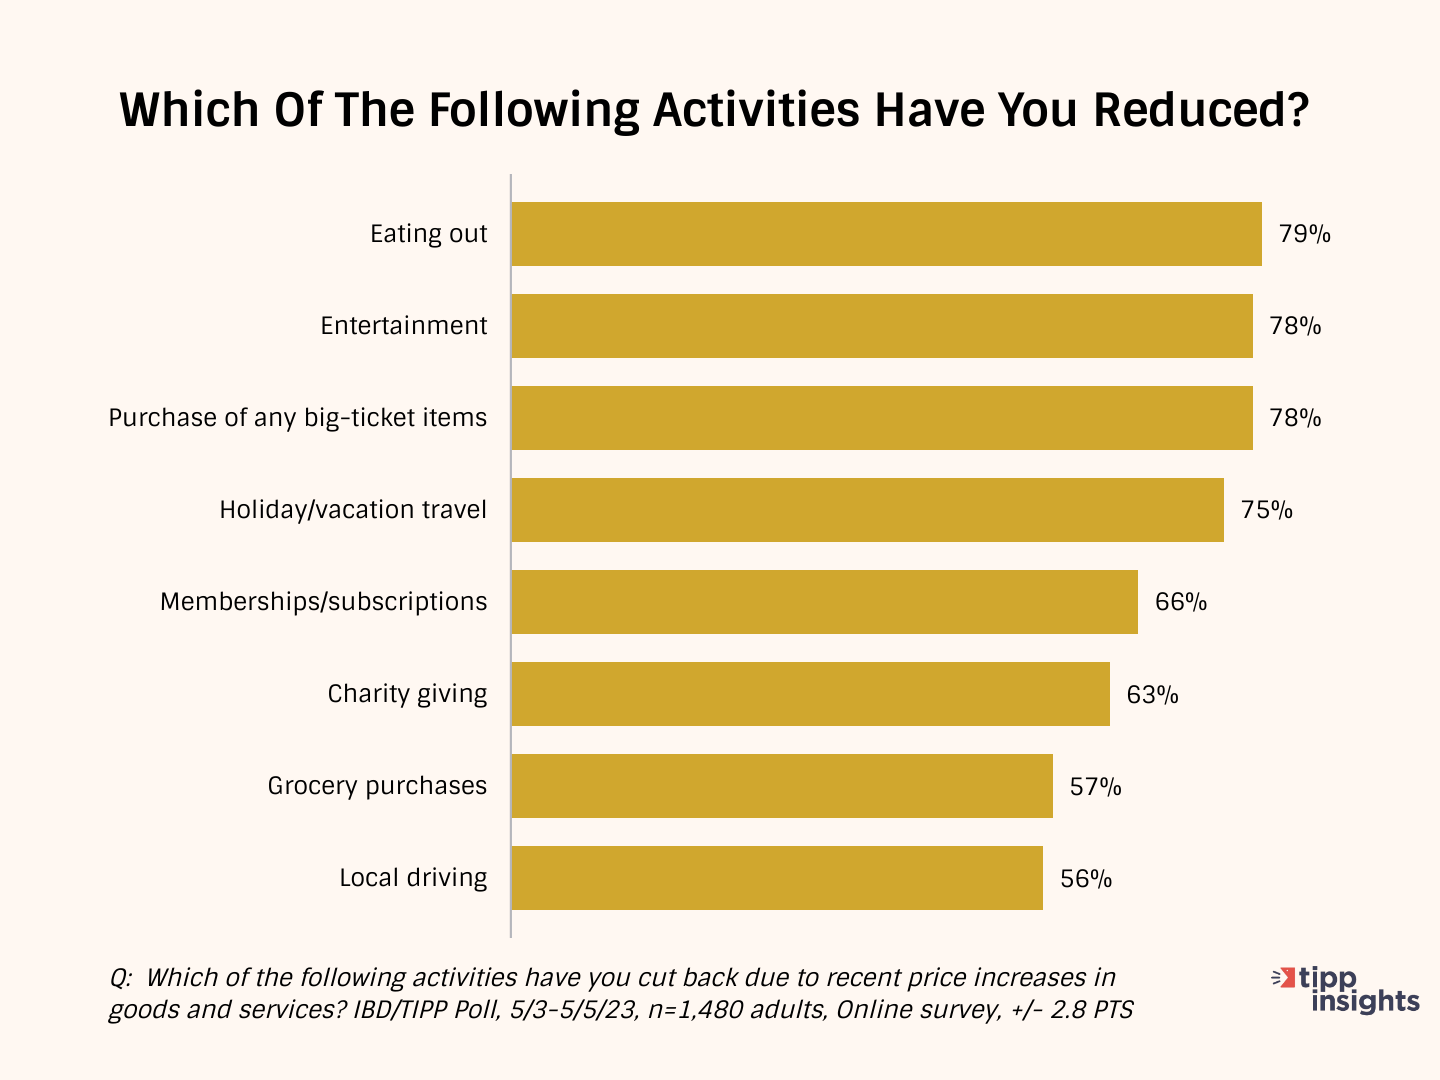
As a result of inflation, Americans are cutting back on household spending.
Most Americans are spending less. They are cutting back on eating out (79%), entertainment (78%), purchasing big-ticket items (78%), holiday/vacation travel (75%), and memberships/subscriptions (66%).
Many (63%) are cutting back on even good causes such as charity giving. Nearly three out of every five (57%) households spend less on groceries. The high gasoline prices forced 56% to cut back on local driving.
Inflation Direction
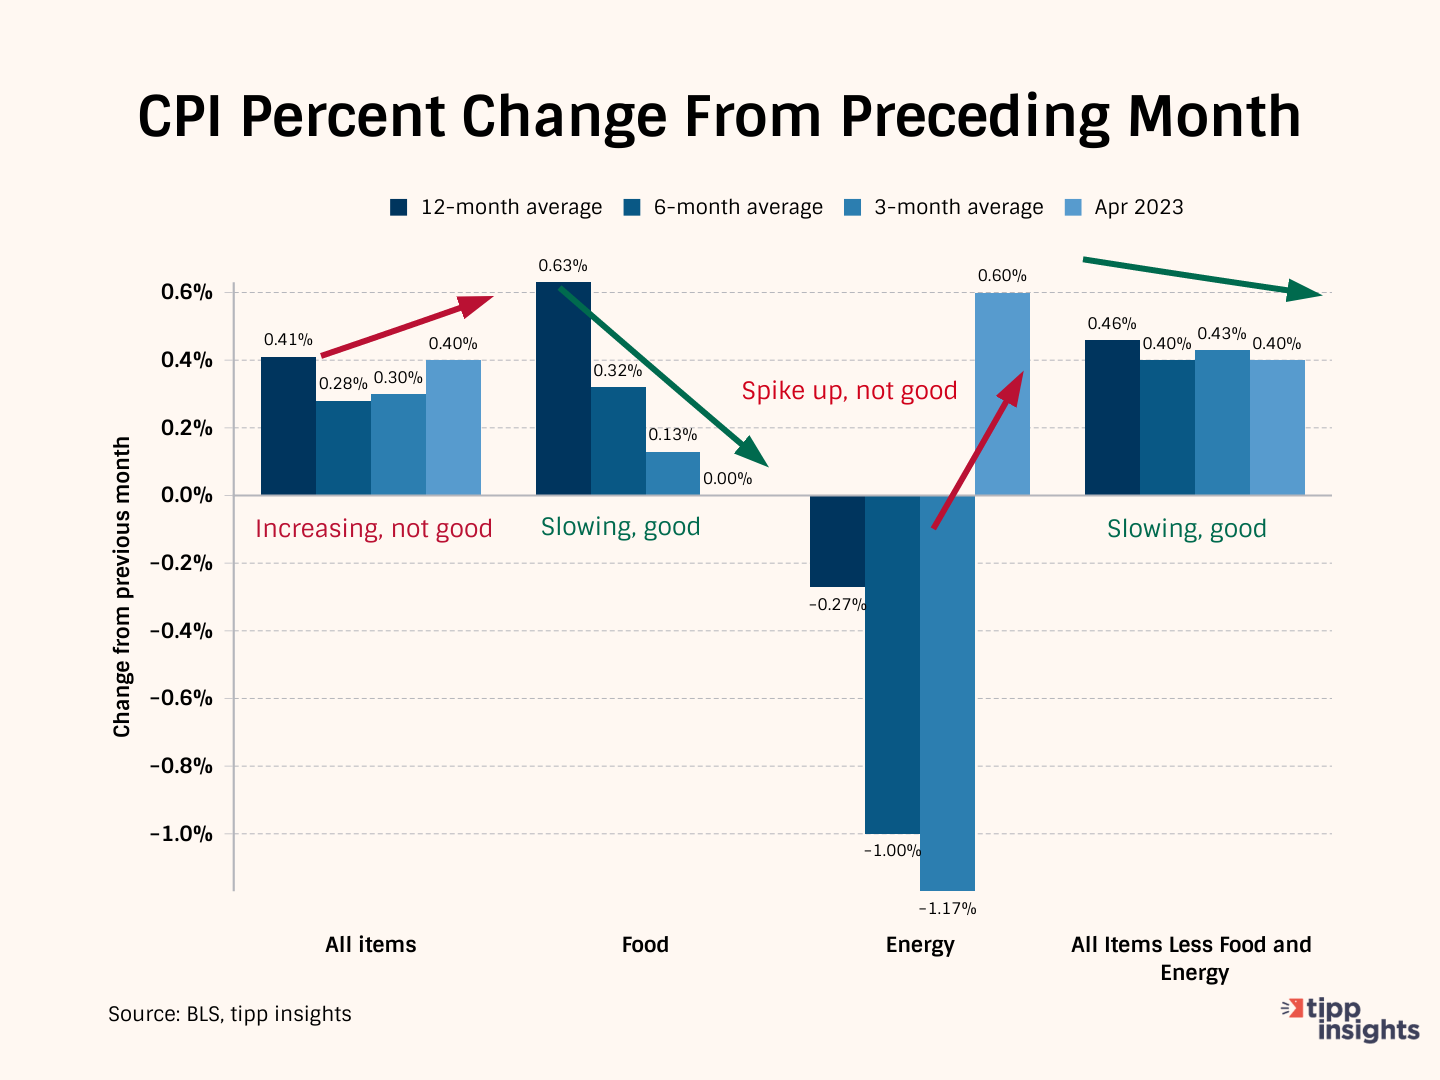
The chart below compares the 12-month average of monthly changes against the 6-month and the 3-month averages. We also show the reading for April 2023.
The 12-month average considers 12 data points and presents a long-term reference, while the six-month and three-month averages consider recent data points.
To better understand, compare the three-month average to April 2023 data. For “All items,” the three-month average was 0.30% vs. 0.4% in April 2023. The reading this month was higher than the three-month average showing a pick-up. Hence it is good.
The April reading for Food (0.00%) is lower than the 3-month average of 0.13%, lower than the 6-month average of 0.32%, and the 12-month average of 0.63%. The downward trend shows improvement.
The Energy situation became worse in April with a spike of 0.6%. The increase in April 2023 (0.60%) exceeded the three-month moving average of -1.17%, indicating deterioration.
“All items less food and energy” is called “core inflation,” i.e., after removing volatile food and energy components. The core inflation reading of 0.40% in April is lesser than the three-month average of 0.43%, indicating improvement relative to the past three months. However, the 3-month average of 0.43% is greater than the 6-month average of 0.40% showing inflation pickup. We interpret this as a mixed situation.
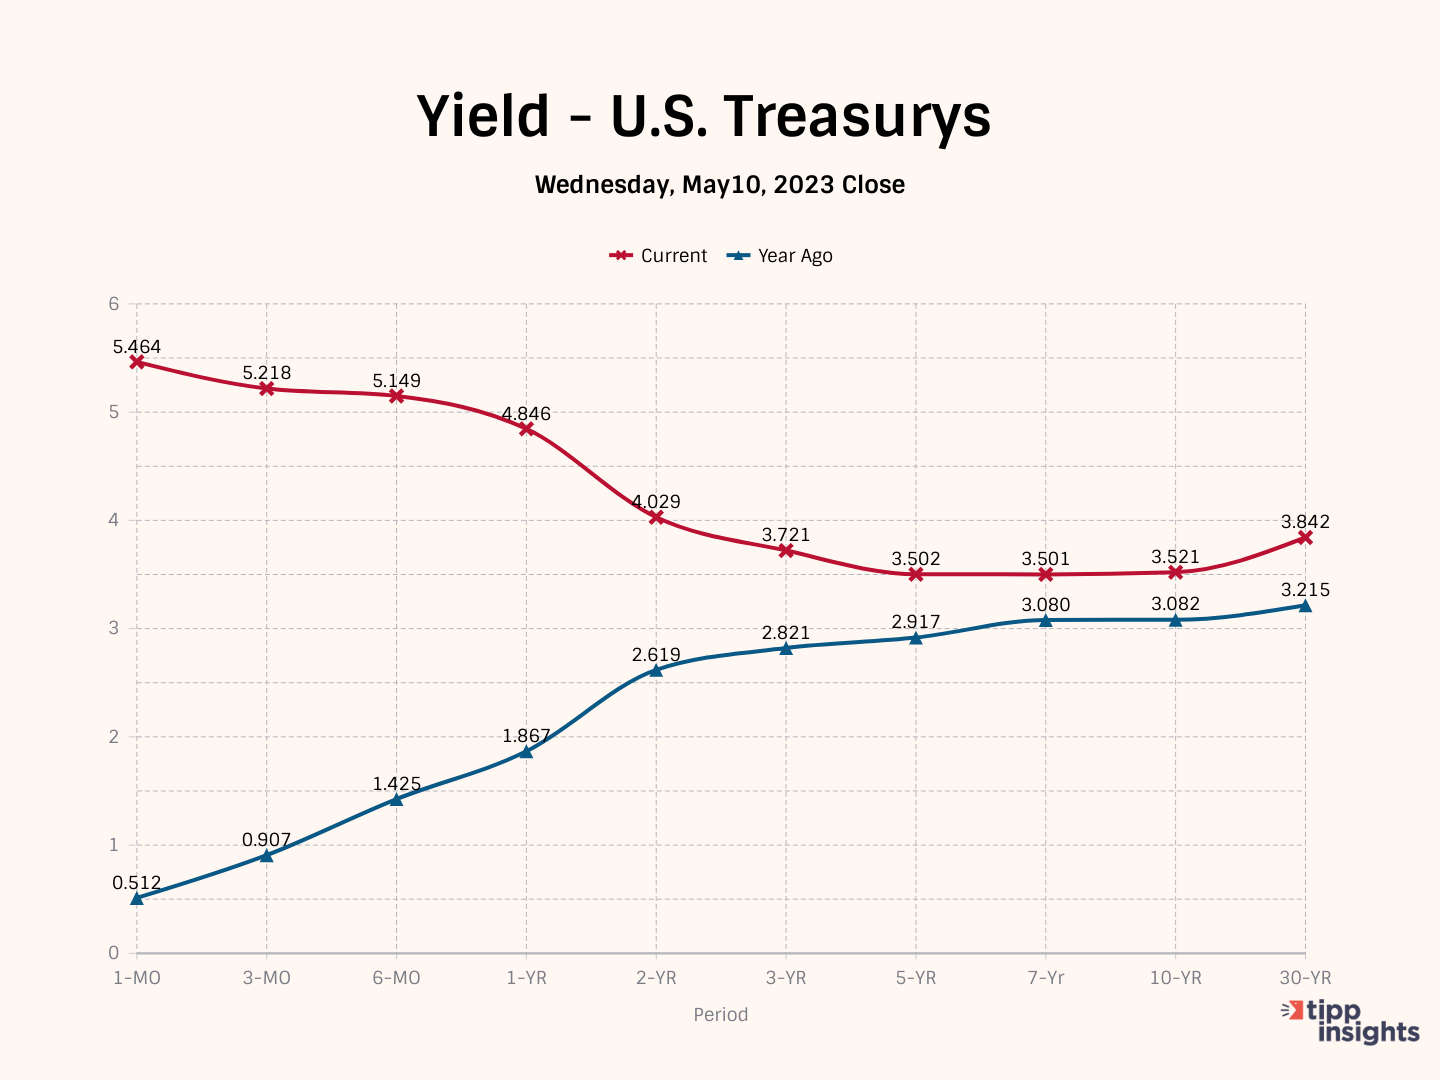
With an inverted yield curve, short-term U.S. treasuries pay higher interest rates than long-term U.S. treasuries. The closing yields on Wednesday were:
- 5.218% for the 3-month Treasury bill
- 5.149% for the 6-month Treasury bill
- 4.846% for the 1-year Treasury bill
- 4.029% for the 2-year Treasury
- 3.842% for the 30-year
The inverted yield curve is a leading indicator of lower inflation but also a leading indicator of recession.
In a recent IBD/TIPP Poll, over one-half (55%) believe the economy is in a recession, and another 62% (56% in April) think the economy is not improving.
To access the TIPP CPI readings each month, you can visit tippinsights.com. We'll publish the TIPP CPI and our analysis in the days following the Bureau of Labor Statistics (BLS) report. The upcoming release of TIPP CPI is on June 13, 2023. We'll also post a spreadsheet in our store for download.
Hey, want to dig deeper? Download data from our store and pay what you can afford!
Want to understand better? We recently wrote an explainer that sixth graders could understand. Everyone can benefit from it. Milton Friedman's Priceless Lessons On Inflation


