
- Bidenflation at 17.3% erodes Americans’ purchasing power
- Annualized Bidenflation hits 5.9%, nearly double the CPI
- Core prices are stubborn at 3.9%
- Real wages lag by 2.0% since Biden took office
- RELATED: Economic Shock: 2/3 Of Americans Living ‘Paycheck To Paycheck’ Under Biden: I&I/TIPP Poll
The dark reality of Bidenomics is 17.3% inflation under the President’s watch. When he took office, inflation was at just 1.4%. Inflation has stayed above the Federal Reserve's 2% target for 35 consecutive months since March 2021.
Average hourly earnings for all employees dropped 2.0% to $11.16 in January from $11.39 in January 2021 when Biden assumed office. Despite nominal salary increases at their fastest pace in years, 58% of Americans say they are now worse off than when the President took office.
In short, prices have increased by 17.3%, while real wages have declined by 2.0%, meaning Americans have taken a 2.0% pay cut under the current administration. To put it differently, people now need 19.3% more income than they had in January 2021 to maintain their living standards. According to some estimates, Americans need an extra $11,400 a year to make ends meet.
How do Americans make up the shortfall?
The Labor Department reported earlier this month that 8.13 million Americans had multiple jobs in January, up from 7.87 million a year earlier. Their share of the U.S. workforce is 5.1%, up from 5% a year before.
Americans also use credit cards to make up for the shortfall. Credit card debt has climbed 40% over the past two years and is near $1.1. trillion. For example, Discover’s credit card customers are carrying $102 billion in balances on their credit cards, up 13% from last year. The charge-off rates and 30-day delinquency rates have also climbed.
Inflation acts as an indirect tax on citizens. Due to entrenched inflation without corresponding real wage growth, most Americans (60%) live paycheck to paycheck, cutting expenses to make ends meet. A quarter (24%) have nothing set aside for financial emergencies.
Rising rent and the end of pandemic-era protections are contributing to the homelessness crisis. Bidenflation and the Fed's eleven rate hikes to reduce inflation have made housing unaffordable for many people and caused displacements.
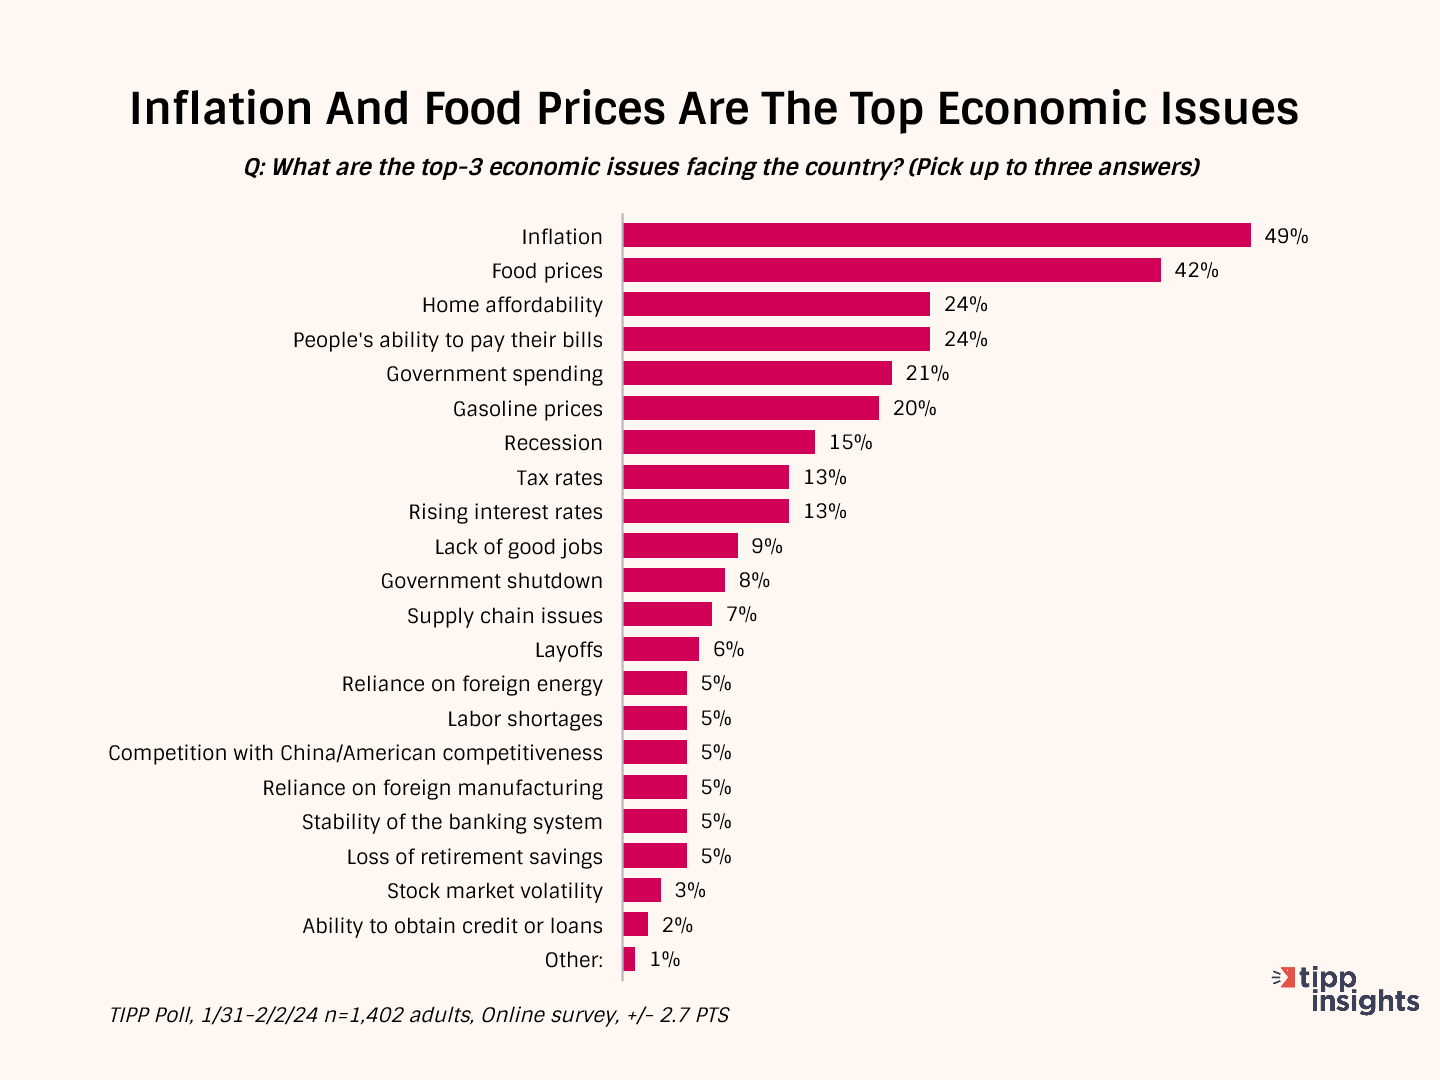
Therefore, it is no surprise that inflation and food prices emerged as Americans' top economic issues in a recent nationwide TIPP Poll.
CPI Report
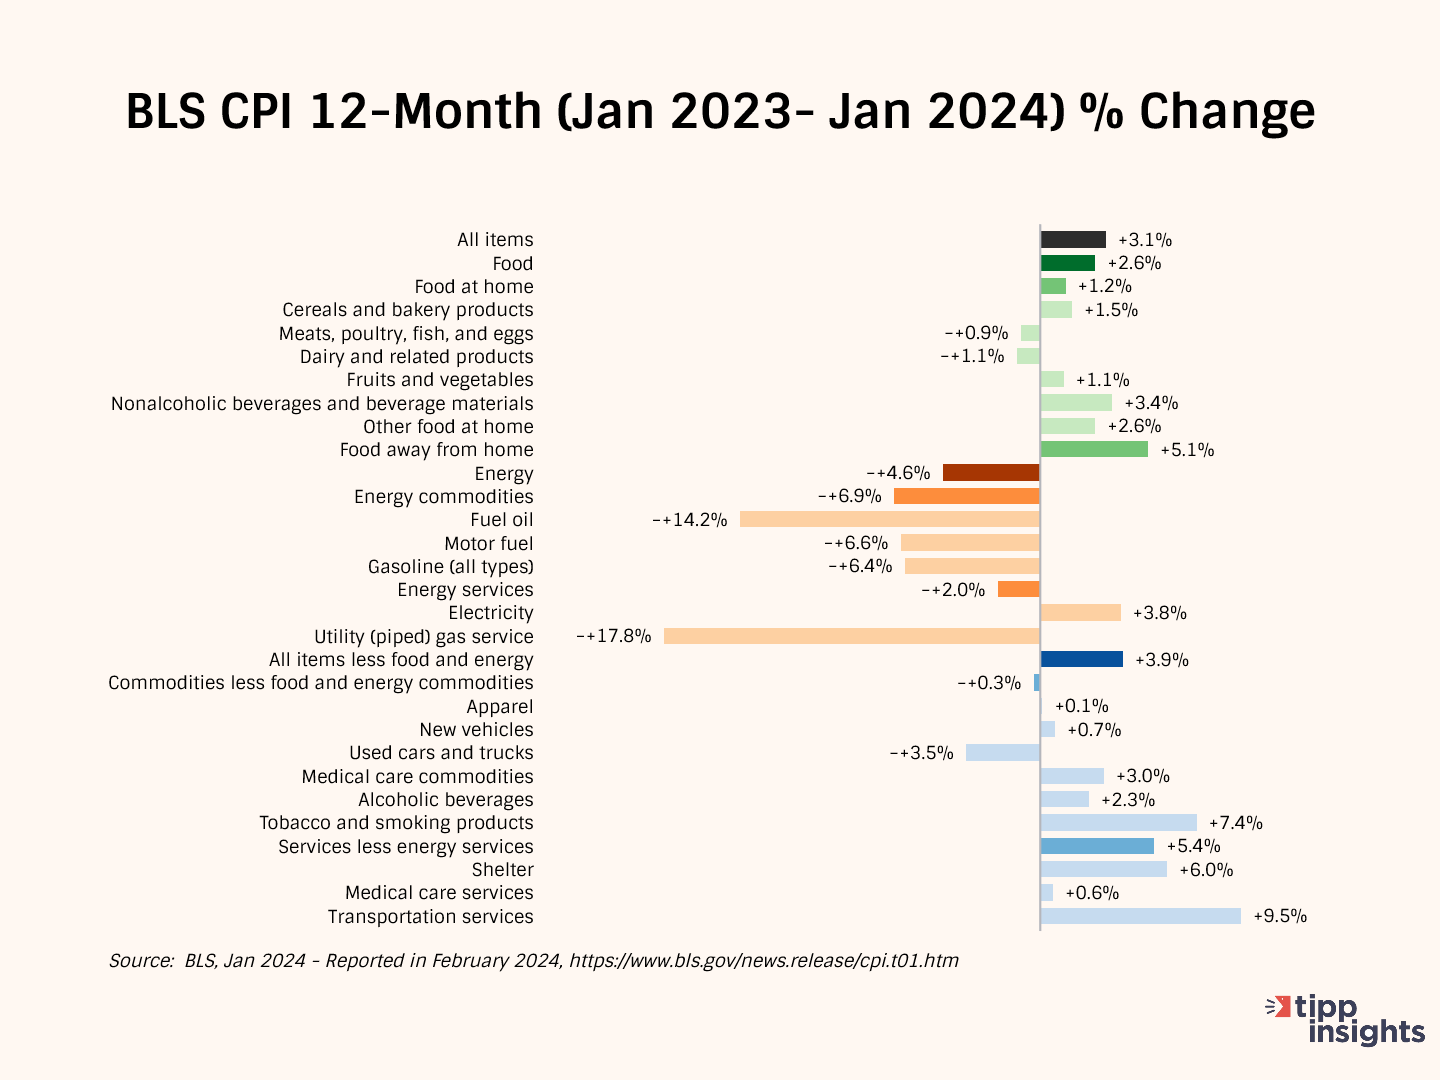
The Consumer Price Index (CPI) released by the government on Thursday showed a 3.1% year-over-year price increase from January 2023 to January 2024.
The CPI rate had declined steadily for 12 consecutive months from a 40-year high of 9.1% in June 2022 to 3.0% in June 2023. In July, it broke that run and increased to 3.2%. Since then, it has moved sideways in the 3.1% to 3.7% range.
After adjusting for seasonality, the CPI increased by 0.3% between December 2023 and January 2024. In the same period, Food prices rose by 0.4%, Energy prices declined by 0.9%, and All items except food and energy (Core) increased by 0.4%.
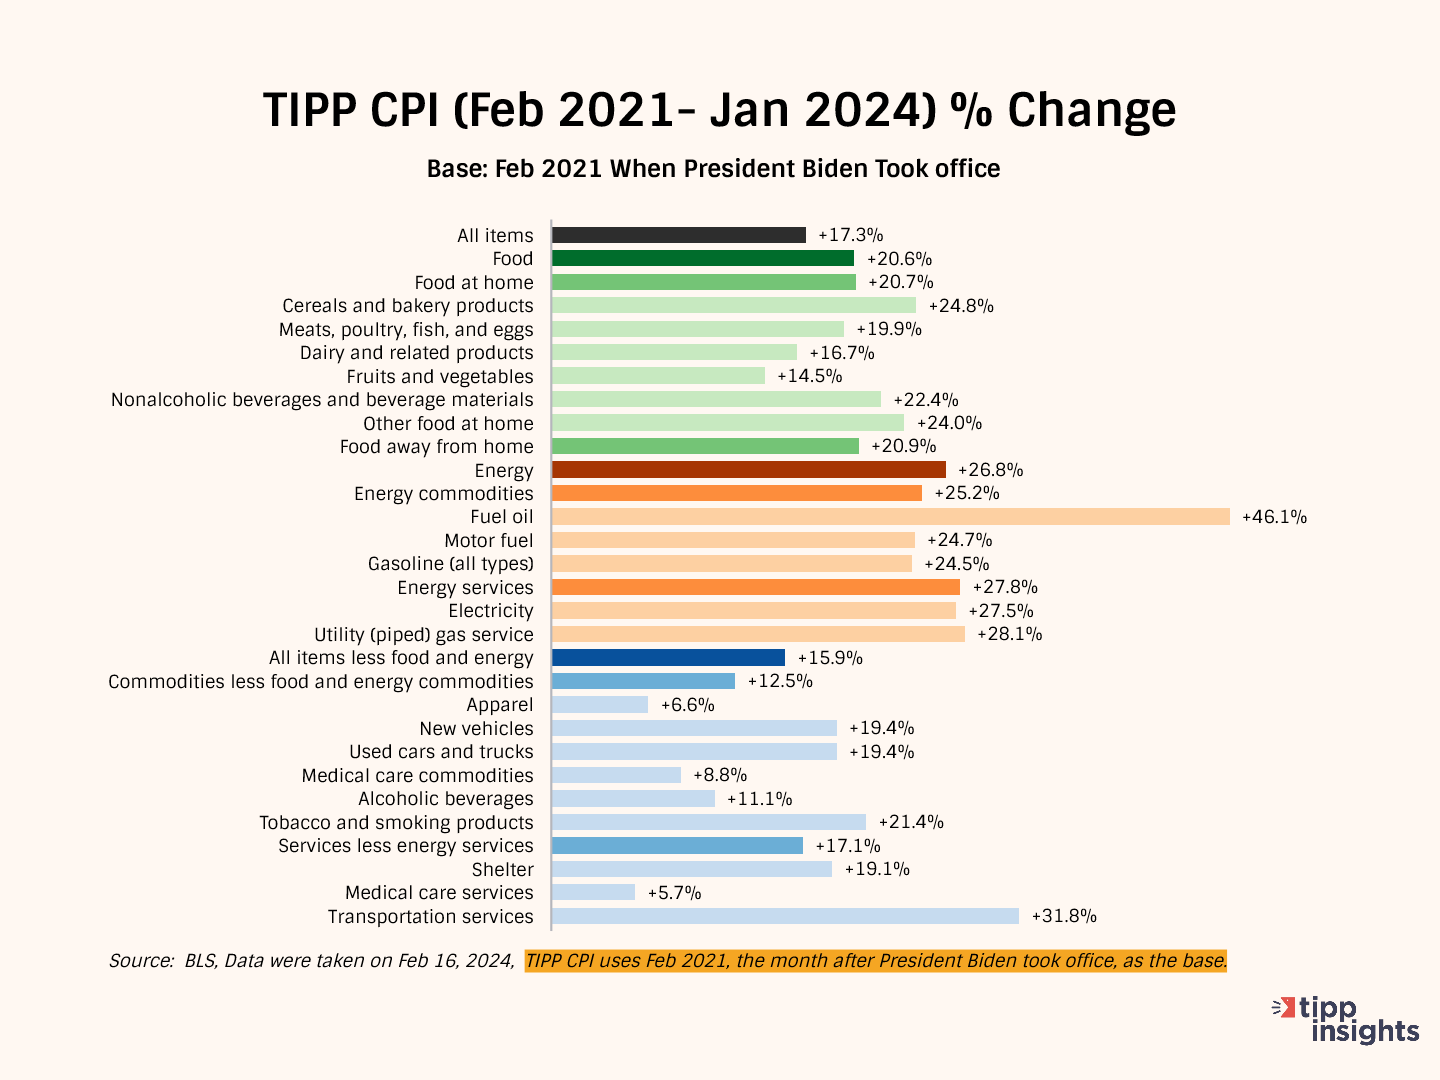
TIPP CPI
We developed the TIPP CPI, a metric that uses February 2021, the month after President Biden's inauguration, as its base to measure the rate of change. All TIPP CPI measures are anchored to the base month of February 2021, making it exclusive to the economy under President Biden's watch.
What is the motivation behind the TIPP CPI?
The BLS CPI rate doesn't accurately capture Americans’ inflation struggles. Further, the media and some economists frequently use the low CPI rate to present a rosy economic outlook supporting Biden’s policies. The official BLS CPI year-over-year increases will compare prices to already inflated bases in the coming months, and these statistics could mask the full impact.

In contrast, the TIPP CPI rate is more objective, offering a clearer understanding of Americans’ economic challenges under President Biden. We use the relevant data from the Bureau of Labor Statistics (BLS) to calculate the TIPP CPI, but we adjust the period to Biden's tenure. When discussing the TIPP CPI and the BLS CPI, we convert the index numbers into percentage changes to better understand and compare them. CPIs are like index numbers that show how prices affect people's lives, similar to how the Dow Jones Industrial Average reflects the stock market.
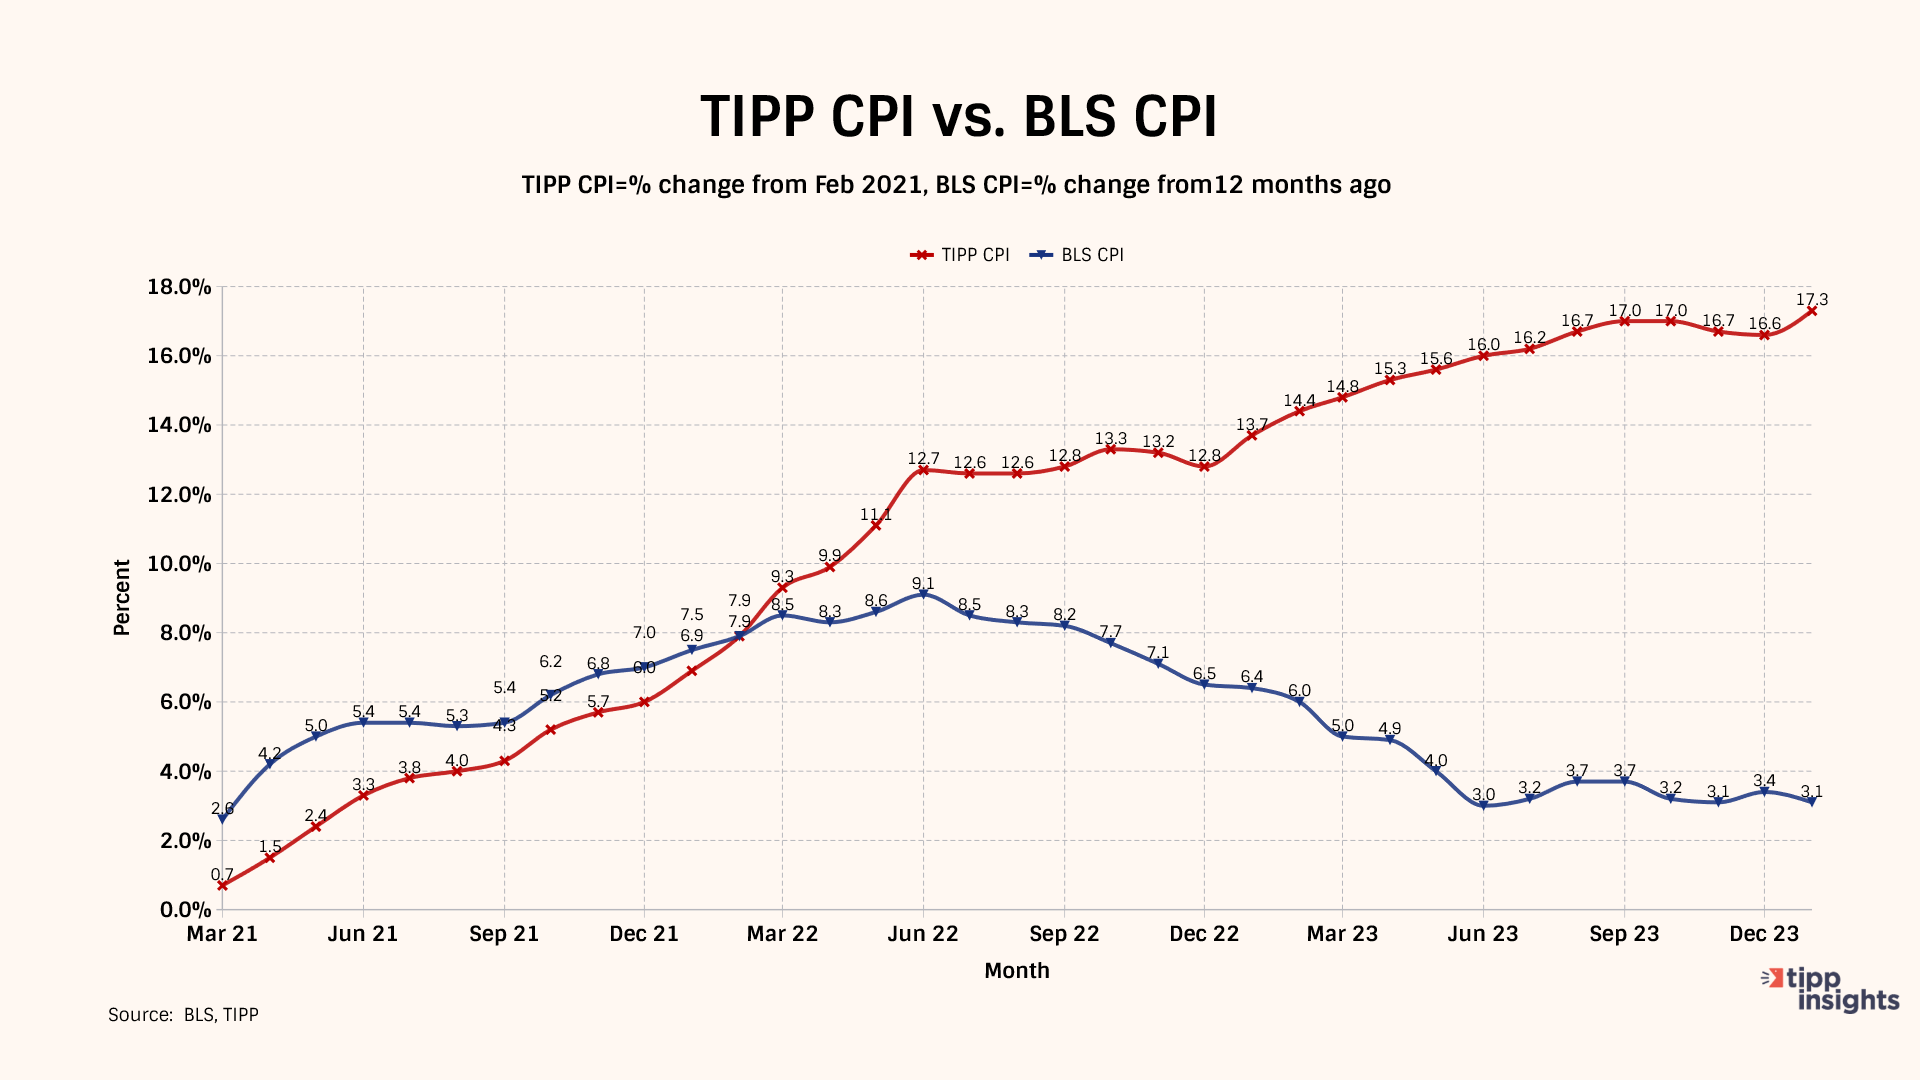
Bidenflation, measured by the TIPP CPI using the same underlying data, increased to 17.3% in January. It was 16.6% in December, 16.7% in November, and 17.0% in October.
TIPP CPI vs. BLS CPI
The following four charts present details about the new metric.
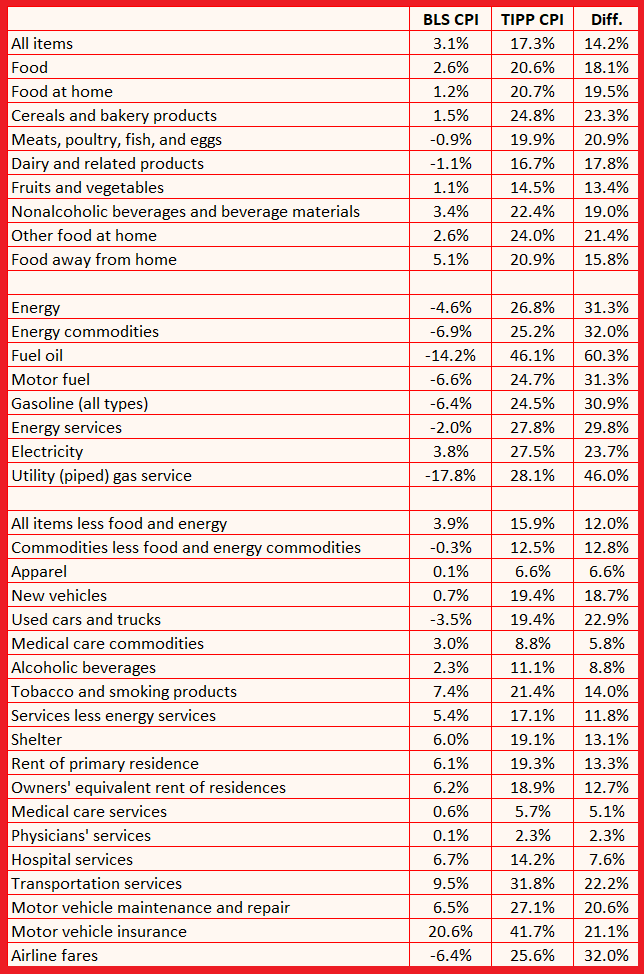
For January 2024, the BLS reported a 3.1% annual CPI increase. Compare this to the TIPP CPI of 17.3%, a 14.2-point difference. Prices have increased by 17.3% since President Biden took office. On an annual basis, TIPP CPI is 5.9%.
Food prices increased by 20.6% under Biden compared to only 2.6% as per BLS CPI, a difference of 18.1 points.
TIPP CPI data show that Energy prices increased by 26.8%. But, according to the BLS CPI, energy prices improved by 4.6%. The difference between the two is a whopping 31.3 points.
The Core CPI is the price increase for all items, excluding food and energy. The Core TIPP CPI is 15.9% compared to 3.9% BLS CPI in the year-over-year measure, a 12.0-point difference.
Further, gasoline prices have increased by 24.5% since President Biden took office, whereas the BLS CPI shows that gasoline prices have improved by 6.4%, a difference of 30.9 points.
TIPP CPI finds that Used car prices have risen by 19.4% during this President’s term. Meanwhile, the BLS CPI reports that the prices have dropped 3.5%, a difference of 22.9 points.
Inflation for air tickets is 25.6% compared to the BLS CPI’s finding of an improvement of 6.4%, a difference of 32.0 points.
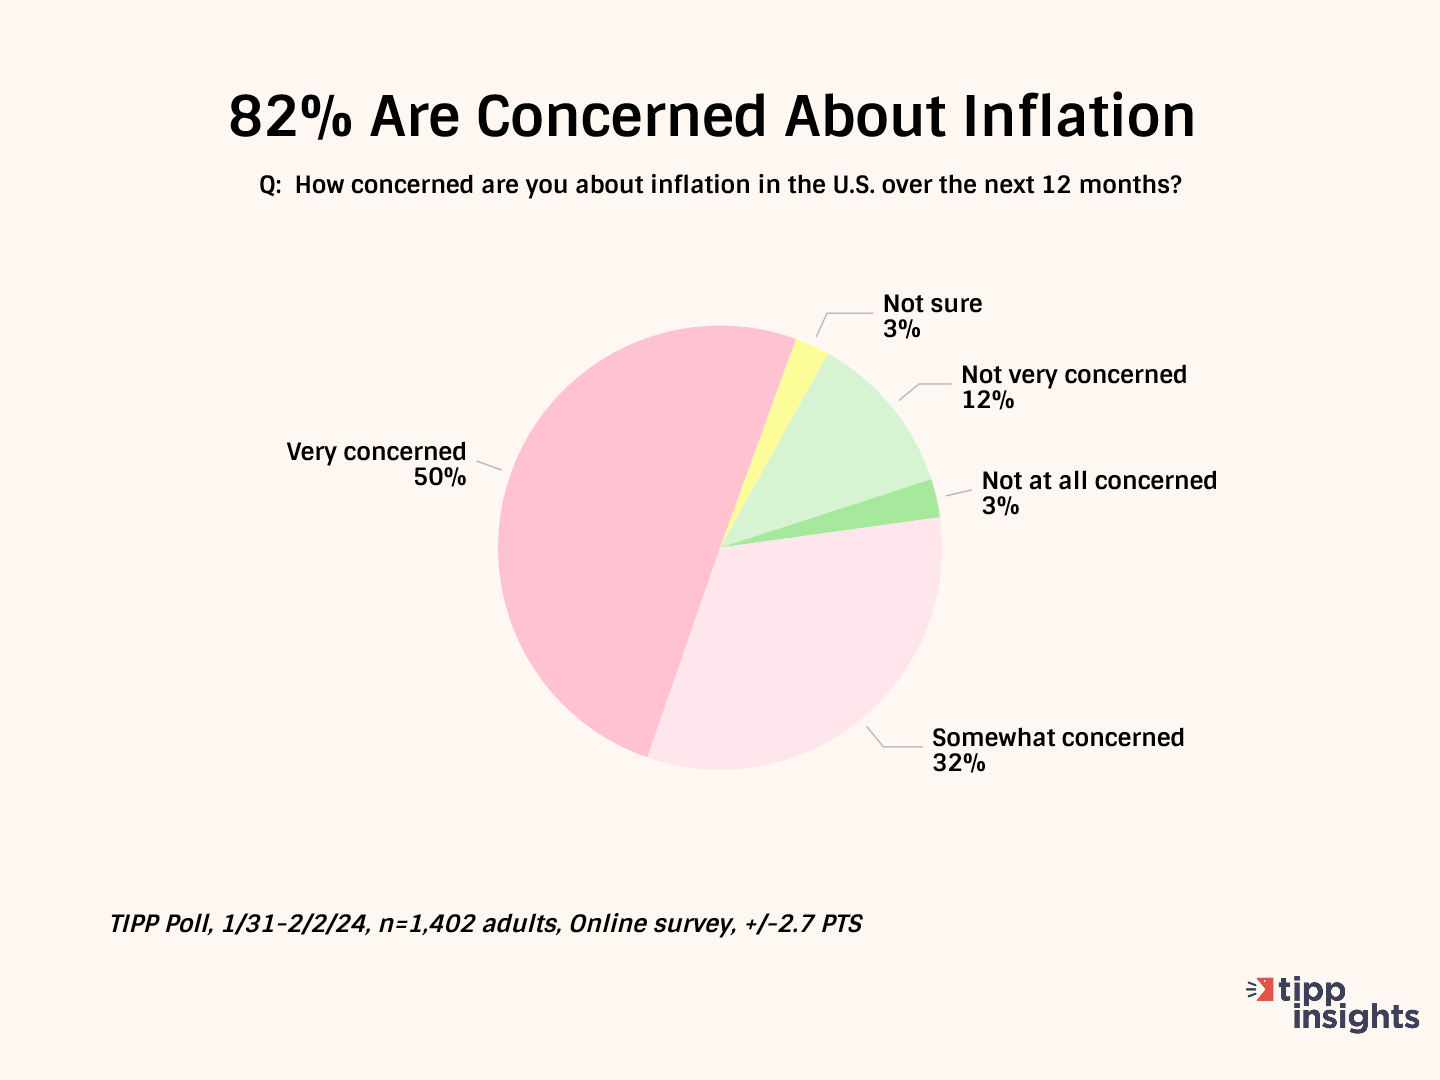
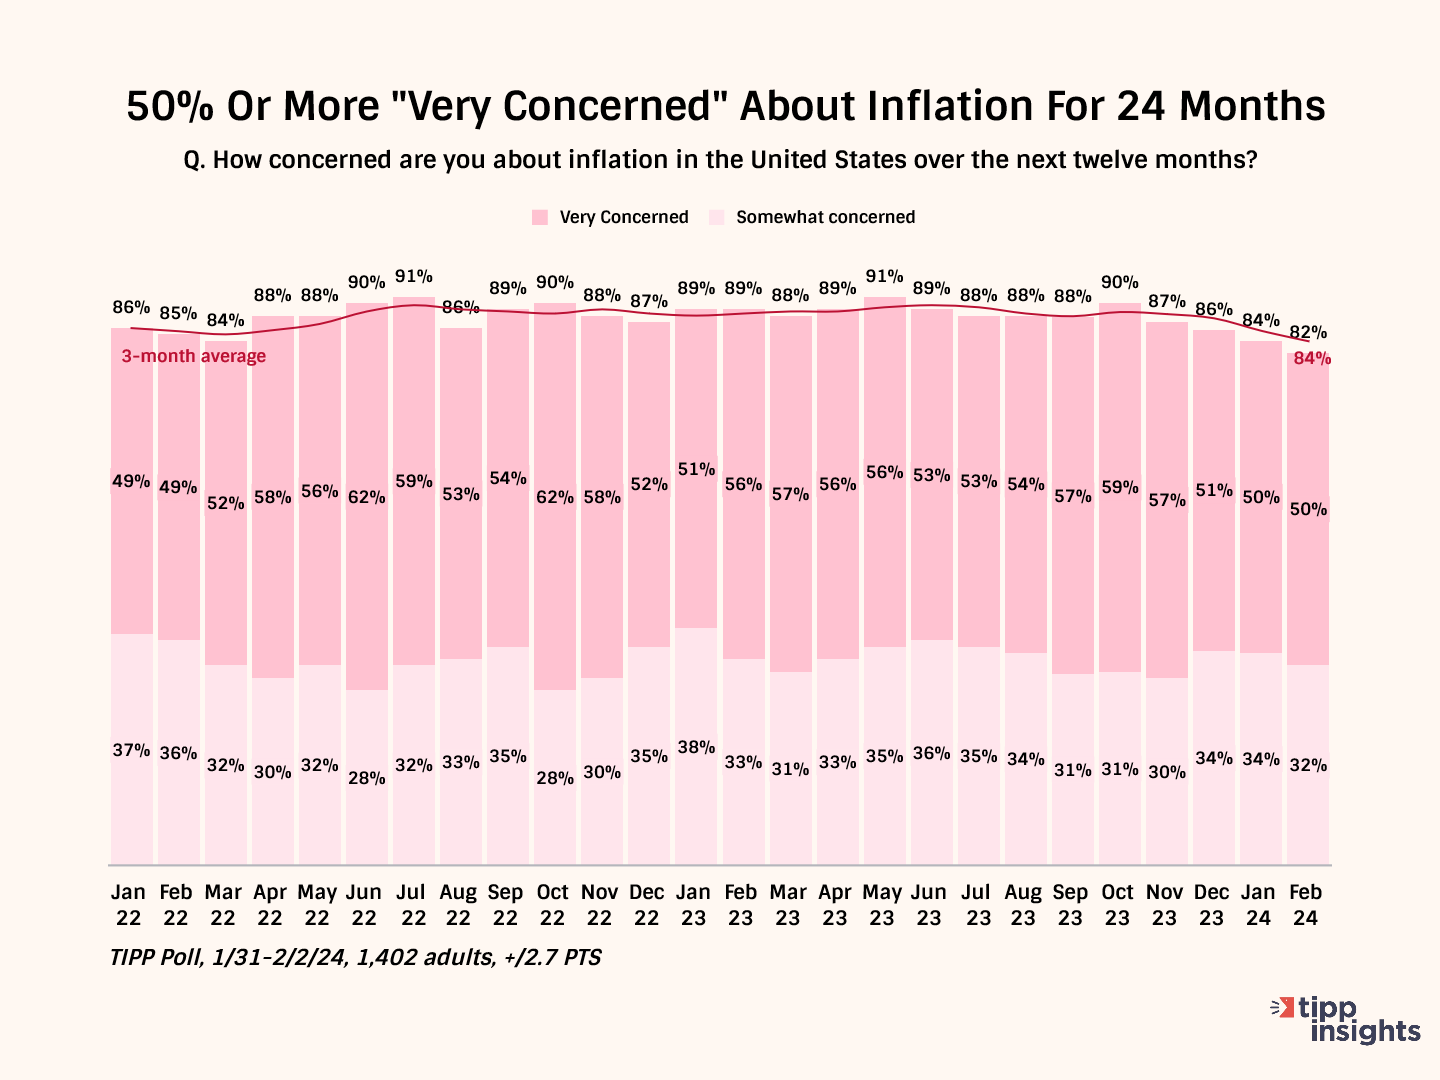
The latest TIPP Poll, completed earlier this month, shows over eight in ten (82%) survey respondents are concerned about inflation. Since January 2022, inflation concerns have stayed above 80%. The "very concerned" share has been at least 50% for twenty-four months.
Why do we track this measure?
It shows that despite the decline in the CPI rate, Americans still feel the pinch of high prices without wage increases. It also fact-checks President Biden’s claims that Bidenomics is working.
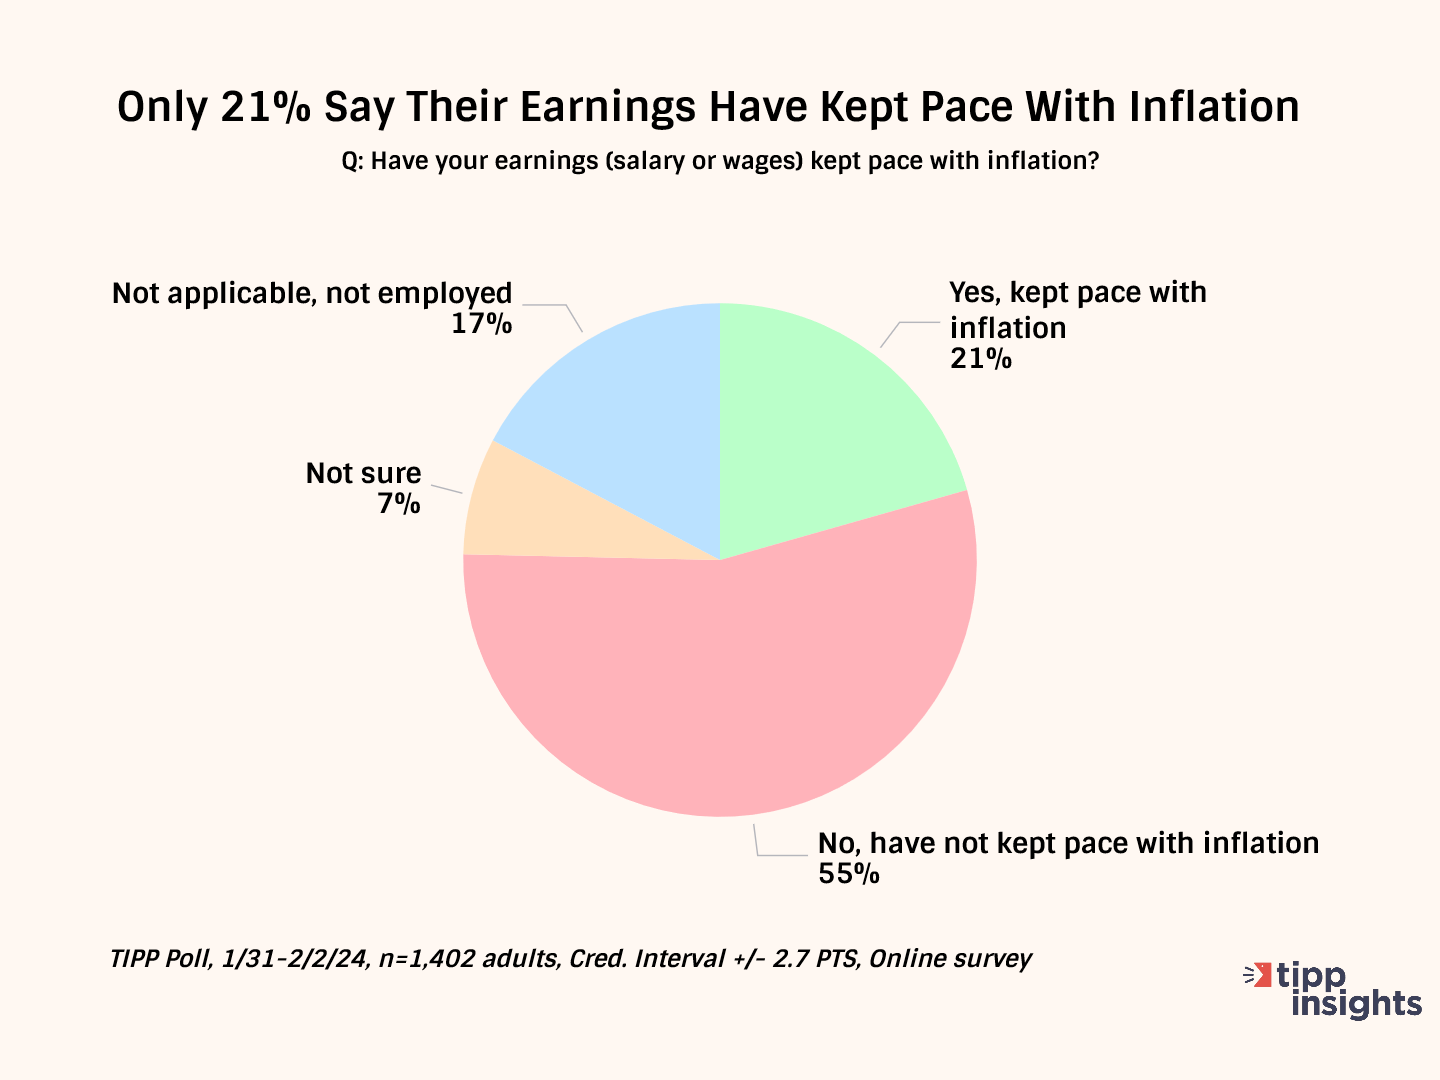
Nearly six in ten (55%) say their wages have not kept up with inflation. Only 21% say their income has kept pace with inflation.
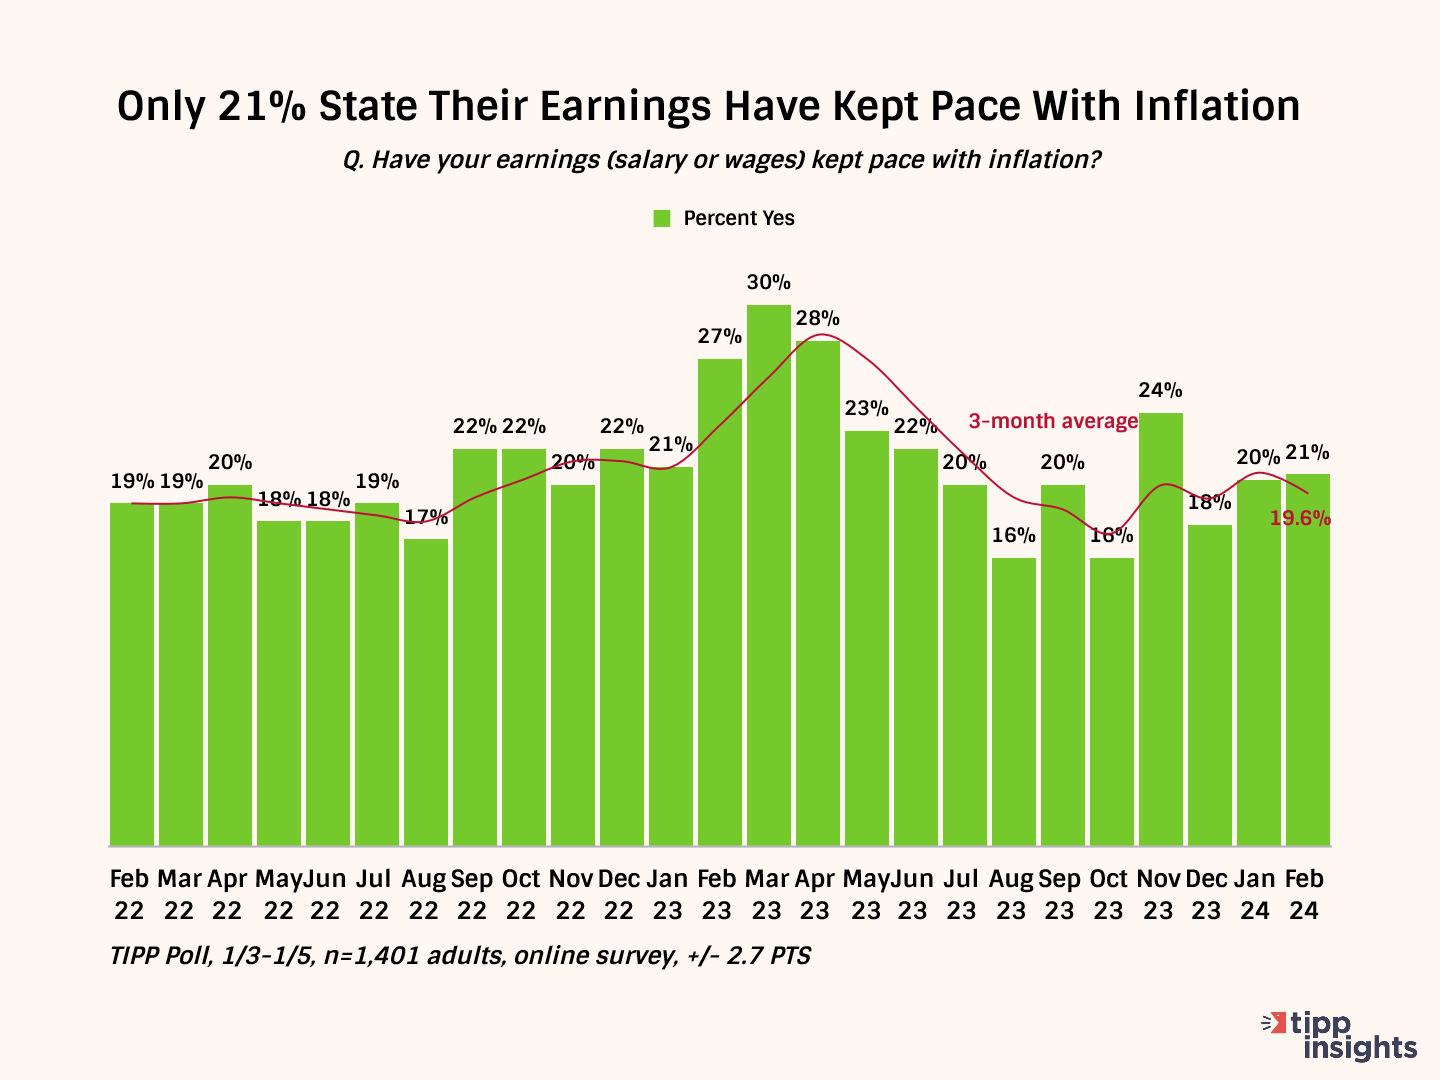
This statistic hovered in the low twenties for most of 2022. The positive change between January 2023 and March 2023 has petered out since May 2023. Notice the steady descent from March last year. It dropped to 21% in February 2024, with a three-month average of 19.6%.
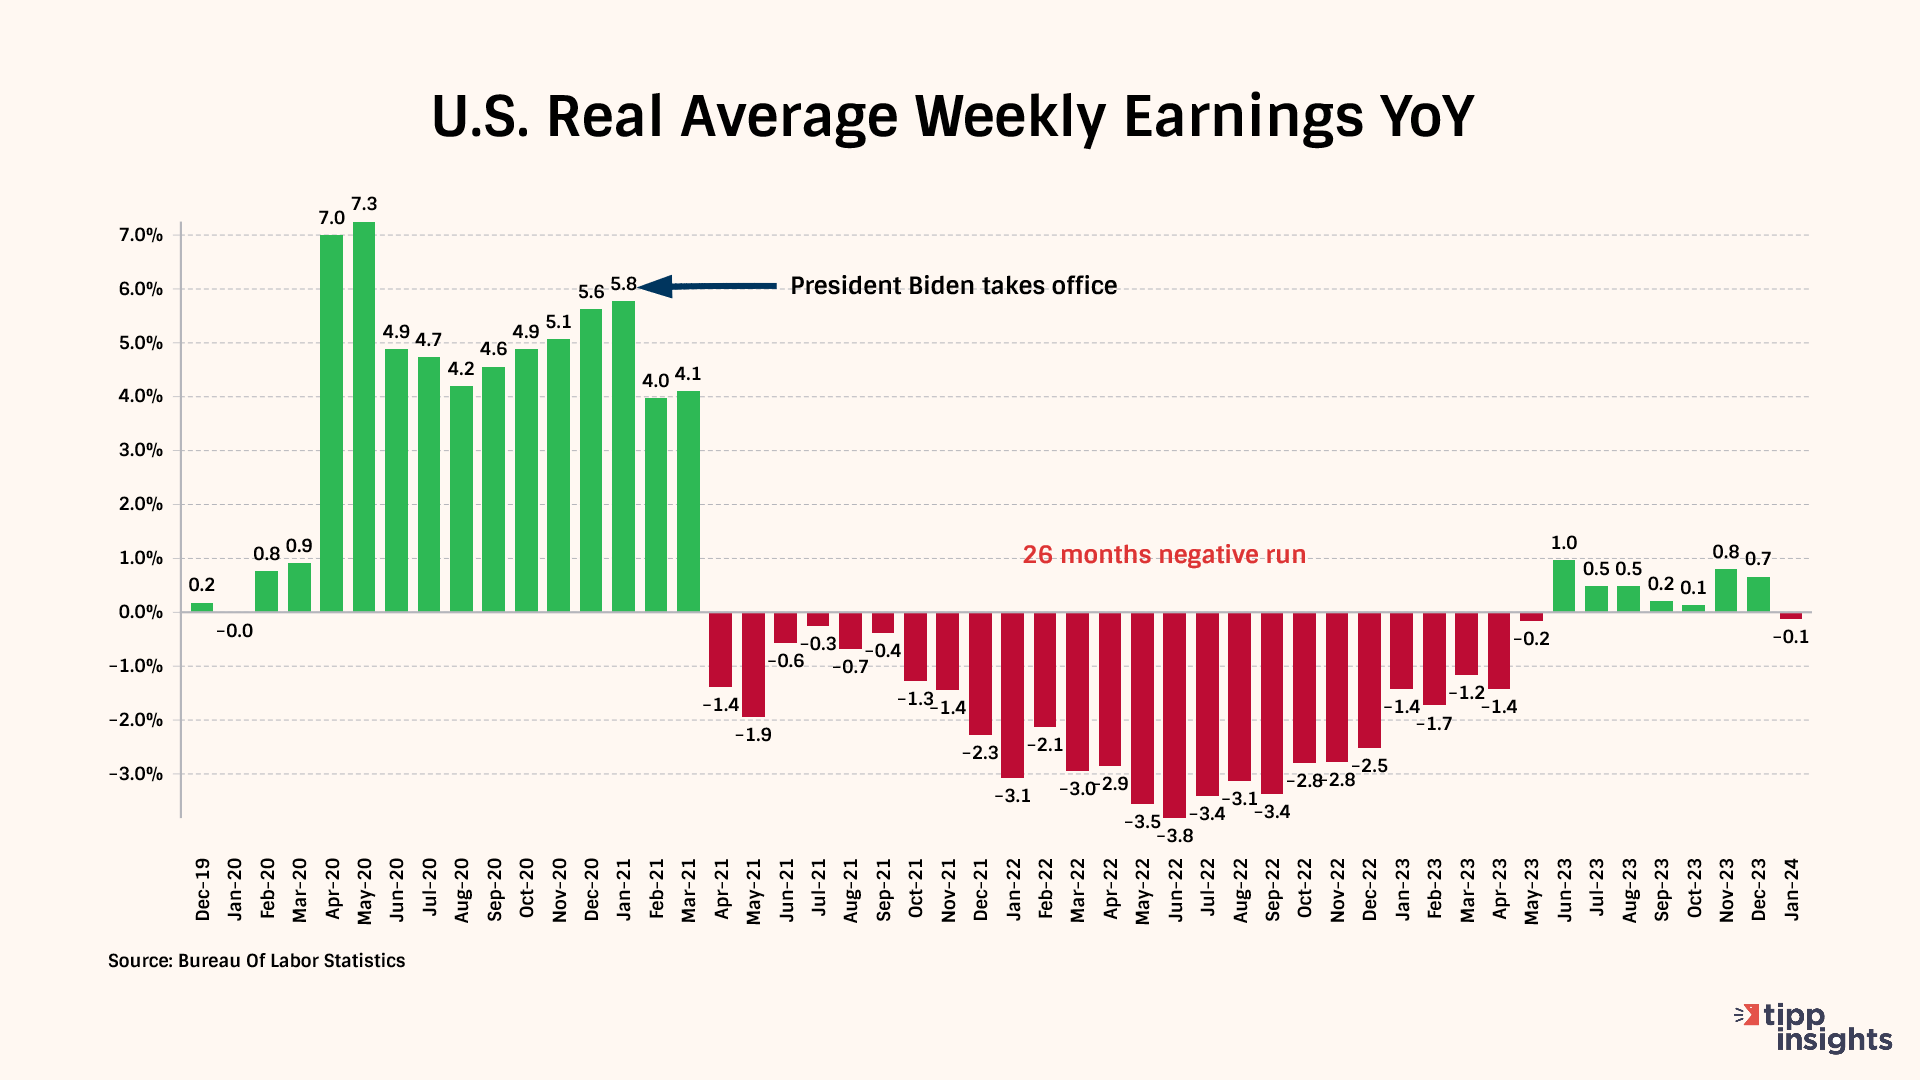
Nominal wages represent the amount of money one earns without considering changes in the cost of living. On the other hand, real wages consider inflation and measure the purchasing power of wages. Real wages provide a more accurate reflection of what is affordable with the income earned by factoring in the changes in the cost of living.
Real weekly wages, measured year-over-year, showed negative readings for 27 out of the 36 months during the Biden presidency from February 2021 to January 2024. The 26-month negative streak was broken in June. The measure posted positive readings for seven months between July 2023 and December 2023, only to record a negative reading in January 2024.
As a result of inflation, Americans are cutting back on household spending.
They are cutting back on eating out (77%), entertainment (76%), purchasing big-ticket items (74%), holiday/vacation travel (74%), and memberships/subscriptions (66%).
Nearly two-thirds (61%) are cutting back on charity giving. Over one-half (53%) of households spend less on groceries. The high gasoline prices forced 53% to cut back on local driving.

Inflation Direction
The chart below compares the 12-month average of monthly changes against the 6-month and the 3-month averages. We also show the reading for January 2024.
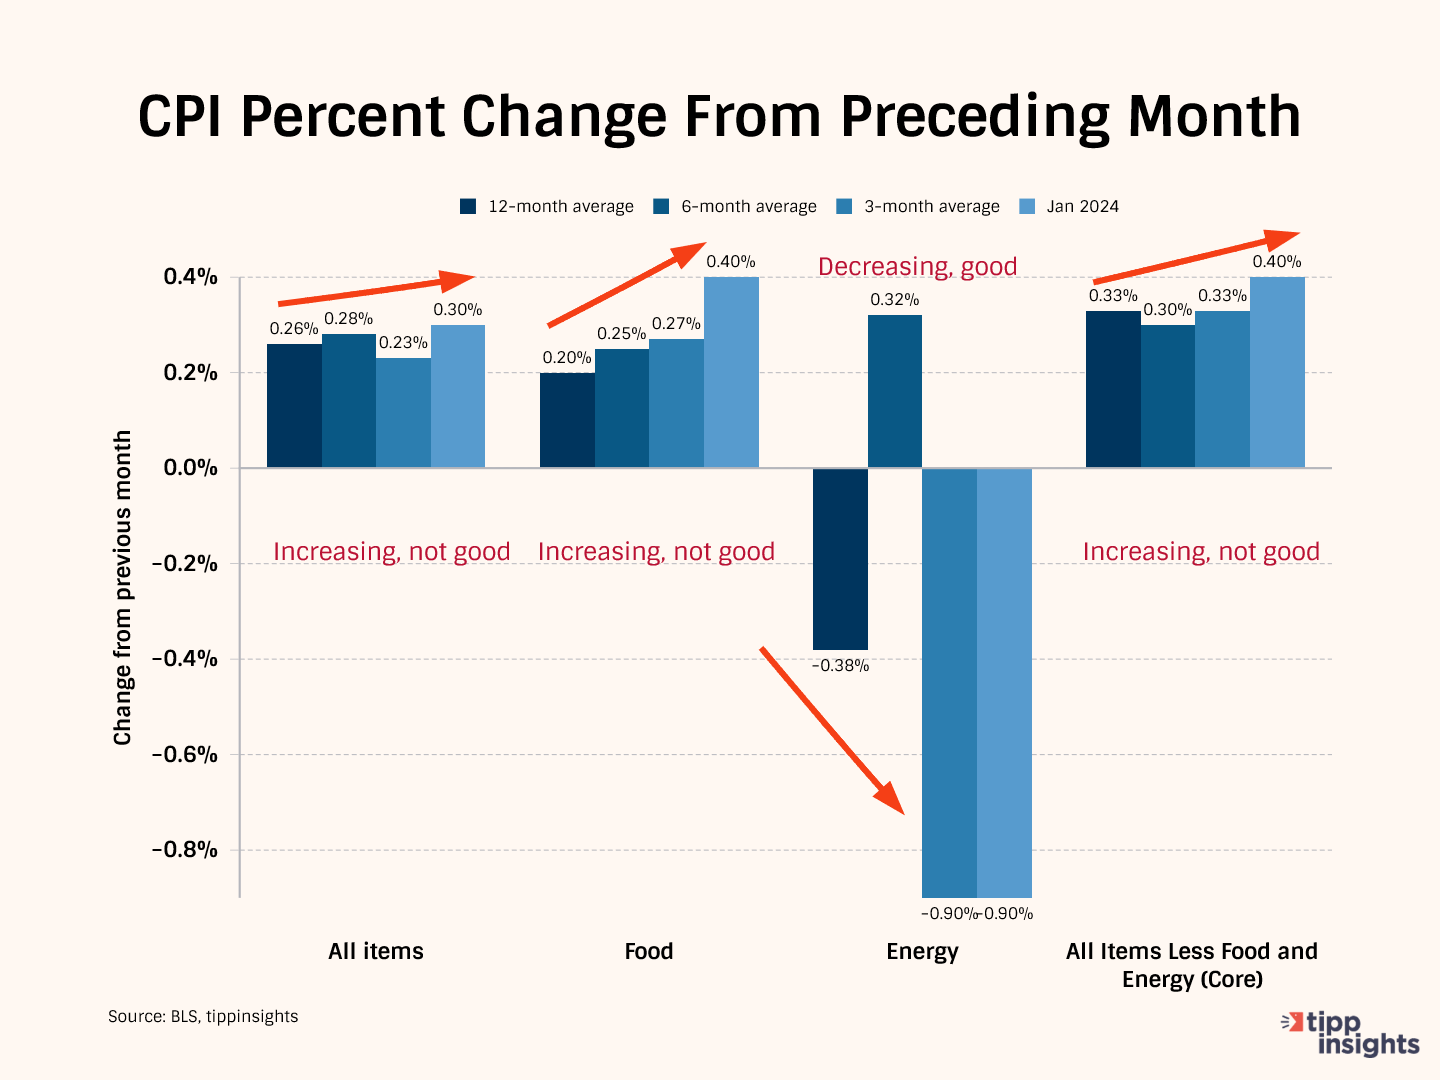
The 12-month average considers 12 data points and presents a long-term reference, while the six-month and three-month averages consider recent data points.
Typically, we compare the data from January 2024 to the three-month average to gain a clearer perspective. In January 2024, the price increase for All items was 0.30%, bigger than the three-month average of 0.23%. This shows a significant deterioration in January.
Meanwhile, the three-month average of 0.23% is lower than the six-month average of 0.28%, indicating a recent slowdown in the rate of increase over the last three months.
Furthermore, the six-month average of 0.28% is greater than the twelve-month average of 0.26%, a deterioration in the trend over the last six months.
This pattern suggests that price increases sharply accelerated in January, a cause for concern.
In January, Food prices rose by 0.40%, greater than the 3-month average of 0.27%, the 6-month average of 0.25%, and the 12-month average of 0.20%. The overall increasing pattern signifies the worsening of food prices and is concerning.
Meanwhile, Energy prices decreased by 0.90%, similar to the three-month average of -0.90%, indicating recent stability. It also outperformed the 12-month average of -0.38% and the six-month average of 0.32%. In summary, the energy situation is improving.
All items less food and energy, known as "core inflation," was 0.40%, higher than the three-month average of 0.33%, indicating deterioration for the month. Meanwhile, the three-month average of 0.33% was greater than the six-month average of 0.30%. The recent sharp increase in January is worrisome.
In summary, except for energy, we see deterioration in the price of food, core, and all items in January.
Monetary Policy
Since March 2022, the Fed has raised interest 11 consecutive times, bringing its benchmark interest rate to 5.25%, the highest level in 22 years.
With the core CPI entrenched at 3.9% and geopolitical tensions that could lead to volatility in the energy markets, we are unsure of what lies ahead. We believe it won't be easy to bring CPI inflation down to the Fed's target of 2.0% with interest rate cuts. Further, the Fed has to strike a delicate balance between election-year pressures and achieving its goals.
In January, the national debt crossed $34 trillion. One downside of ballooning federal debt is that refinancing becomes challenging. Supply and demand in the bond market will drive interest rates. If there is a high supply of government bonds (due to high debt levels), interest rates may need to stay high to attract investors and ensure that the government can continue borrowing money.
Most Americans are concerned about the sustainability of this trajectory. The high interest rates are also hurting Americans and sapping their confidence.
Federal Reserve Chair Jerome Powell echoed Americans’ struggles in a recent interview with "60 Minutes:
People are experiencing high prices. If you think about the basic necessities like bread and milk and eggs and meats of various kinds, prices are substantially higher than they were before the pandemic.
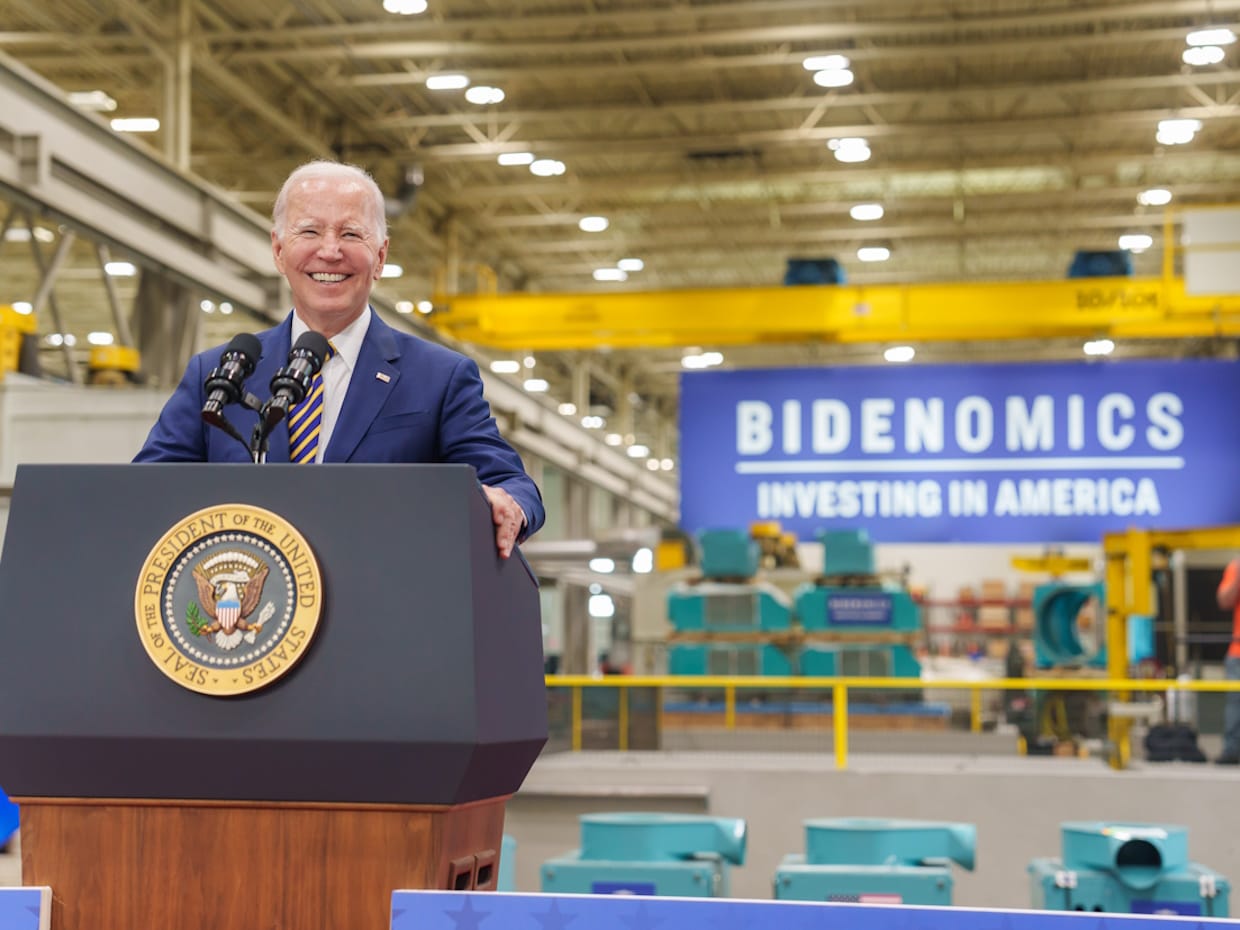
Powell succinctly summed up living in Biden’s America and must tell it to the President, who believes Bidenomics has been a stellar success.
To access the TIPP CPI readings each month, you can visit tippinsights.com. We'll publish the TIPP CPI and our analysis in the days following the Bureau of Labor Statistics (BLS) report. The upcoming release of TIPP CPI is on March 13, 2024. We'll also post a spreadsheet in our store for download.
Hey, want to dig deeper? Download data from our store for a small fee!
Want to understand better? We wrote an explainer on inflation that sixth graders could understand. Everyone can benefit from it. Milton Friedman's Priceless Lessons On Inflation.
We could use your help. Support our independent journalism with your paid subscription to keep our mission going
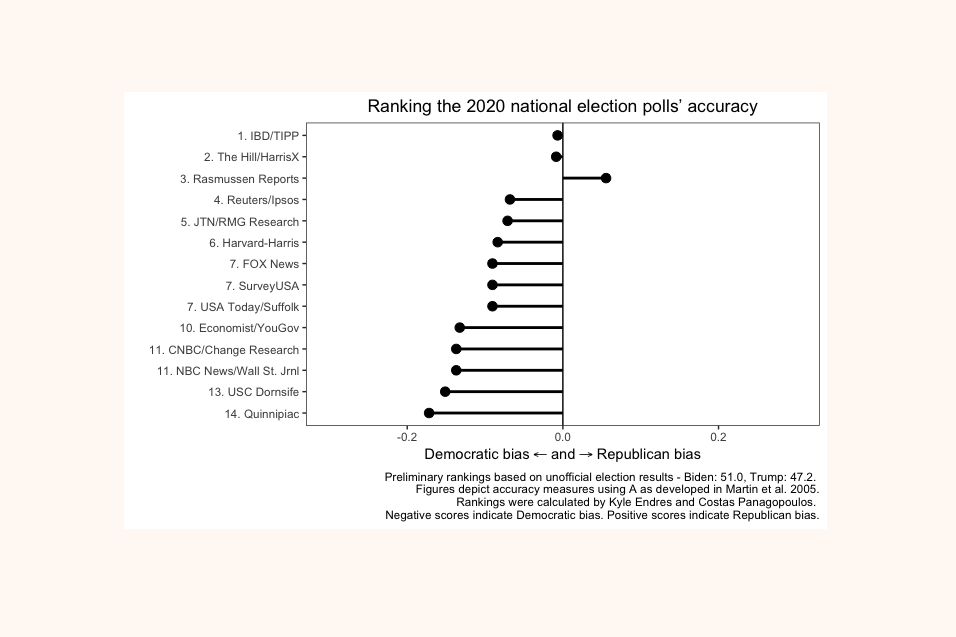
Our performance in 2020 for accuracy as rated by Washington Post:


