This week in a press conference, Treasury Secretary Janet Yellen stated that the U.S. economy is doing exceptionally well. "As I mentioned, the United States is doing extremely well economically, with inflation coming down in a strong labor market, and Europe is doing better than was feared at our last meeting."
Contrast this to what real Americans think. In a recent IBD/TIPP Poll, over one-half (55%) believe the economy is in a recession, and another 56% (57% in March) think the economy is not improving.
We welcome any good news.
We always take Yellen's pronouncements with a pinch of salt. Recall that in mid-2021, she double-teamed with Fed Chairman Powell, leading us to believe that U.S. inflation was "transitory," defying commonsense. Even backbenchers knew inflation was taking a stronghold, which peaked at 9.1%.
Based on our experience, we thought it was appropriate to call her "Janet Yellen – The Modern Nero." Despite her impressive academic resume, she lacks direct business experience. She can't relate to the struggles of most Americans. As a team player, she plays a vital role on Biden's economic team as the go-to person for selling Pollyanna's ideas to the American public. But she is not very convincing.
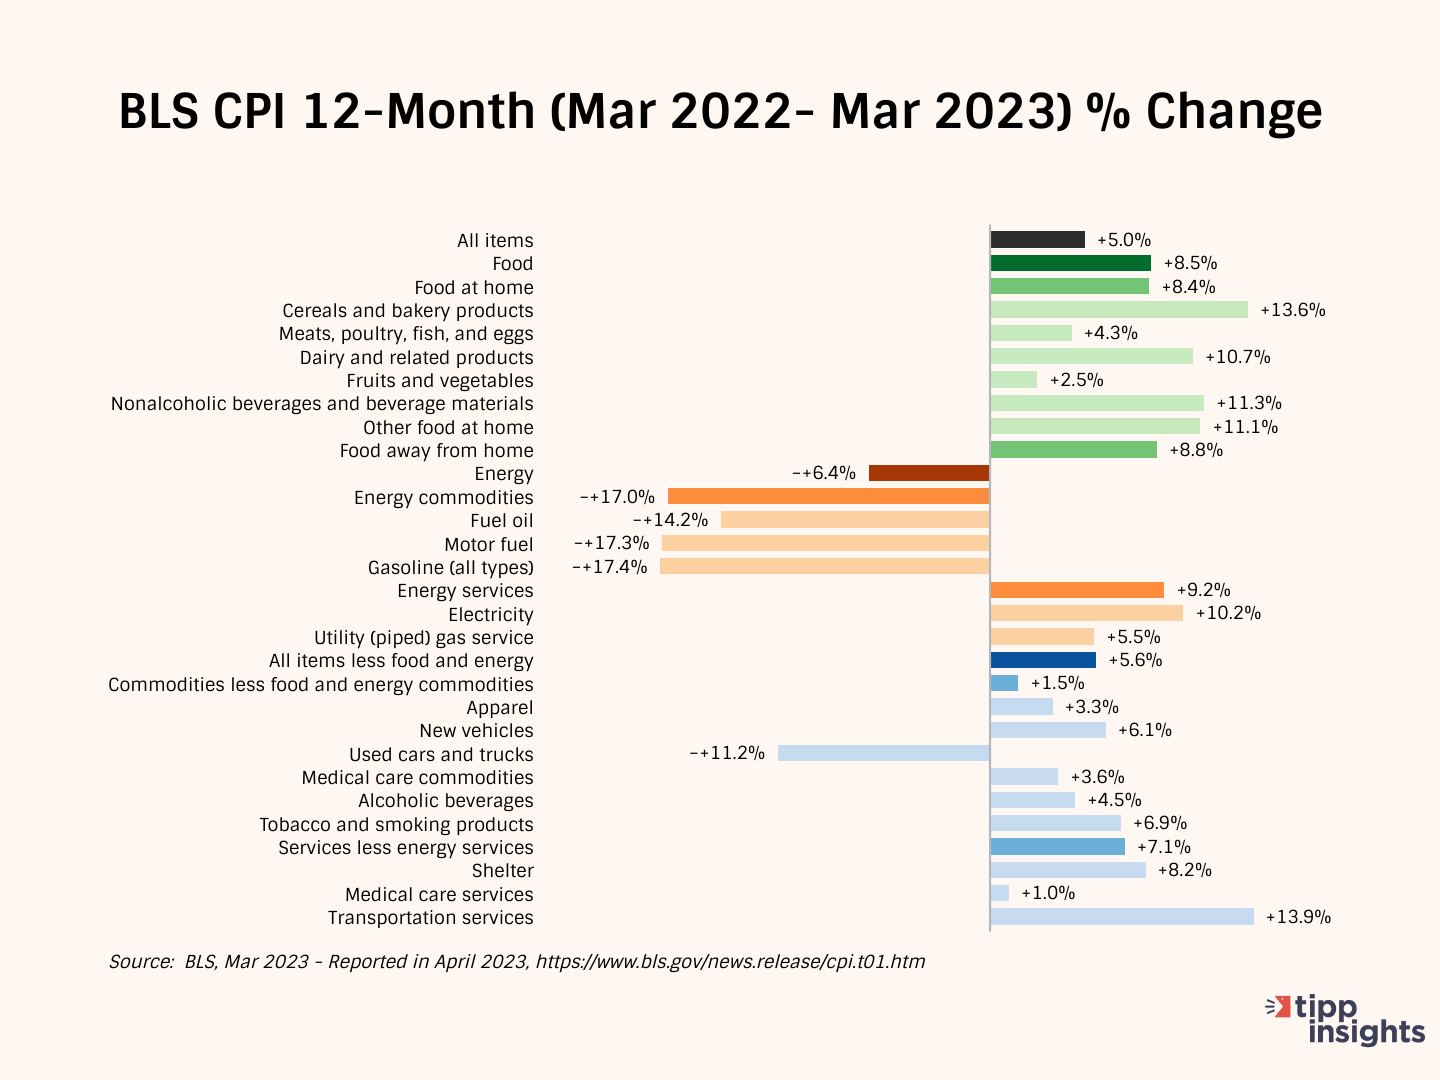
The Consumer Price Index (CPI) released by the government on Wednesday showed a 5.0% year-over-year increase in prices from March 2022 to March 2023, edging down from a rate of 6.0% in February and 6.4% in January. The CPI has declined steadily from a 40-year high of 9.1% in June to 5.0% in March.
The media headlines read:
Inflation slowed to 5% in March, a nearly 2-year low, but core consumer price gains accelerated.
Inflation rose just 0.1% in March and 5% from a year ago as Fed rate hikes took hold.
But few media outlets provided context, partly because doing so would shed the Biden administration in a terrible light. So, we are happy to oblige and fill in the gaps.
The CPI inflation rate measures how much more expensive things are getting over time. The government calculates the increase in the CPI rate over 12 months, so the base for March 2023 is March 2022, and for February 2023 is February 2022.
In March 2023, the CPI index was 301.836, 5.0% higher than its base of 287.504 for March 2022. And in February 2023, the CPI index was 300.840, 6.0% higher than its base of 283.716 for February 2022.
Between February 2022 and March 2022, the base increased sharply by 3.788 points or 1.34%. Even though the CPI index increased by 0.33% between February and March 2023, the headline CPI rate dropped from 6.0% to 5.0% because of the "base effect."
In other words, the rate seemed lower than it actually was because the base was higher in March 2022. Things were getting more expensive but more expensive at a slower rate than the previous year. Only in Washington is this good news.
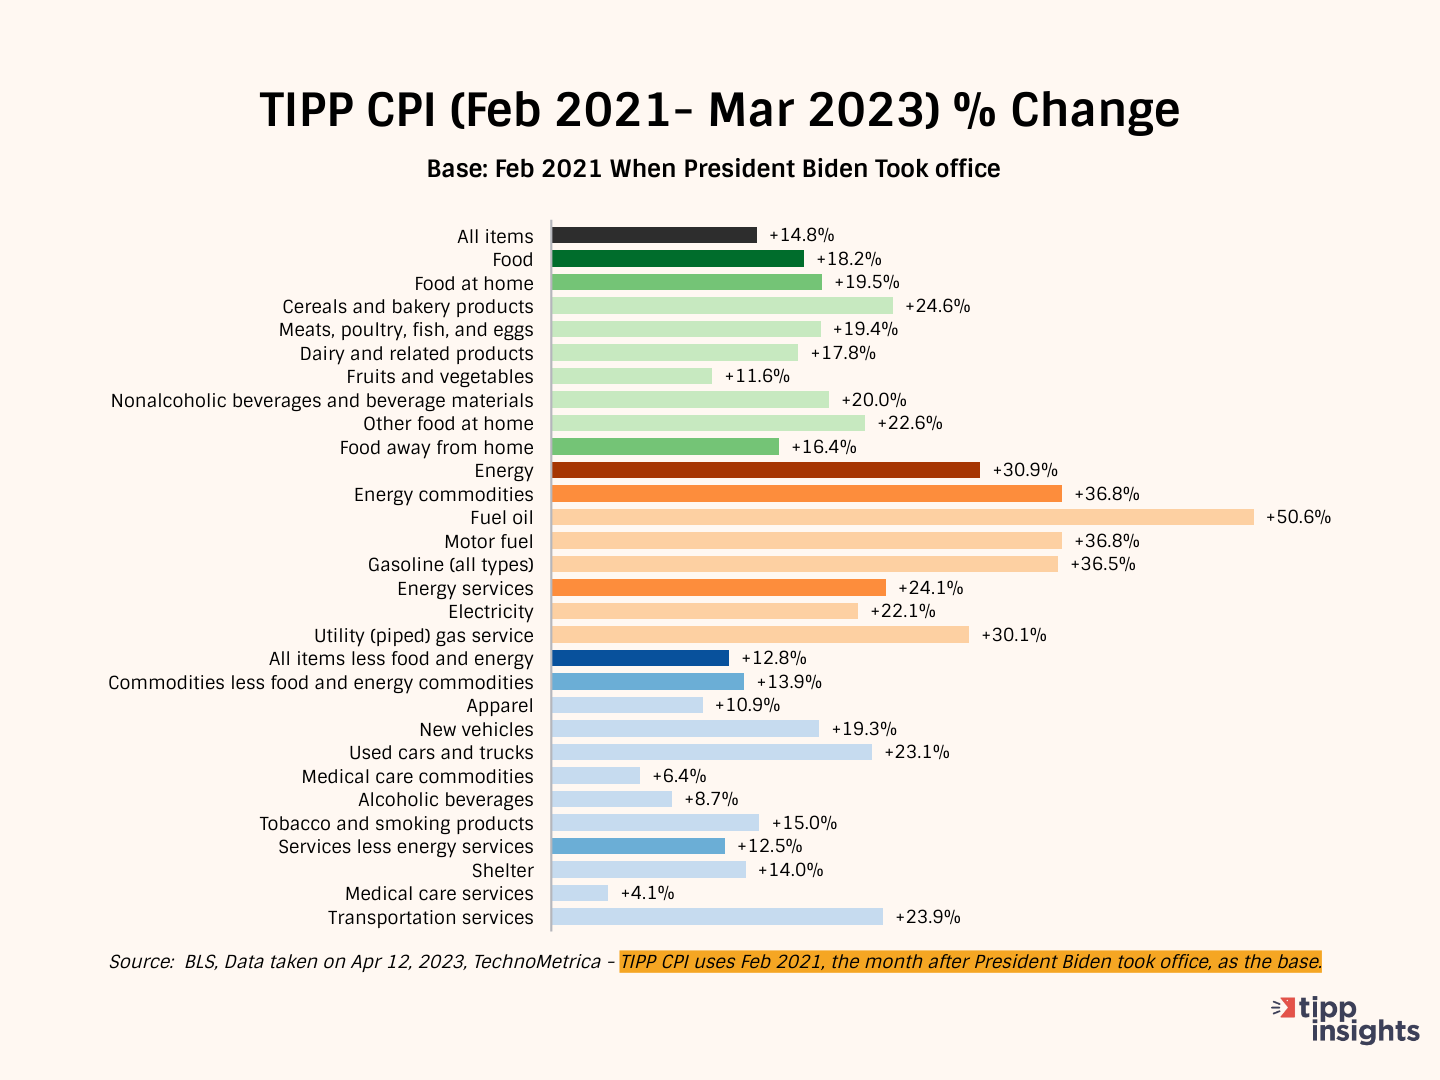
TIPP CPI
We developed the TIPP CPI, a metric that uses February 2021, the month after President Biden's inauguration, as its base. We measure the rate of change in the economy from this base. All TIPP CPI measures are anchored to the base month of February 2021, making it exclusive to the economy under President Biden's watch.
We use the relevant Bureau of Labor Statistics (BLS) underlying data but recalibrate it to arrive at the TIPP CPI. CPIs are index numbers that give Americans a sense of common understanding about how prices impact their lives, much like the Dow Jones Industrial Average is a bellwether of the stock market.
But we convert index numbers to percent changes when we refer to TIPP CPI and BLS CPI.
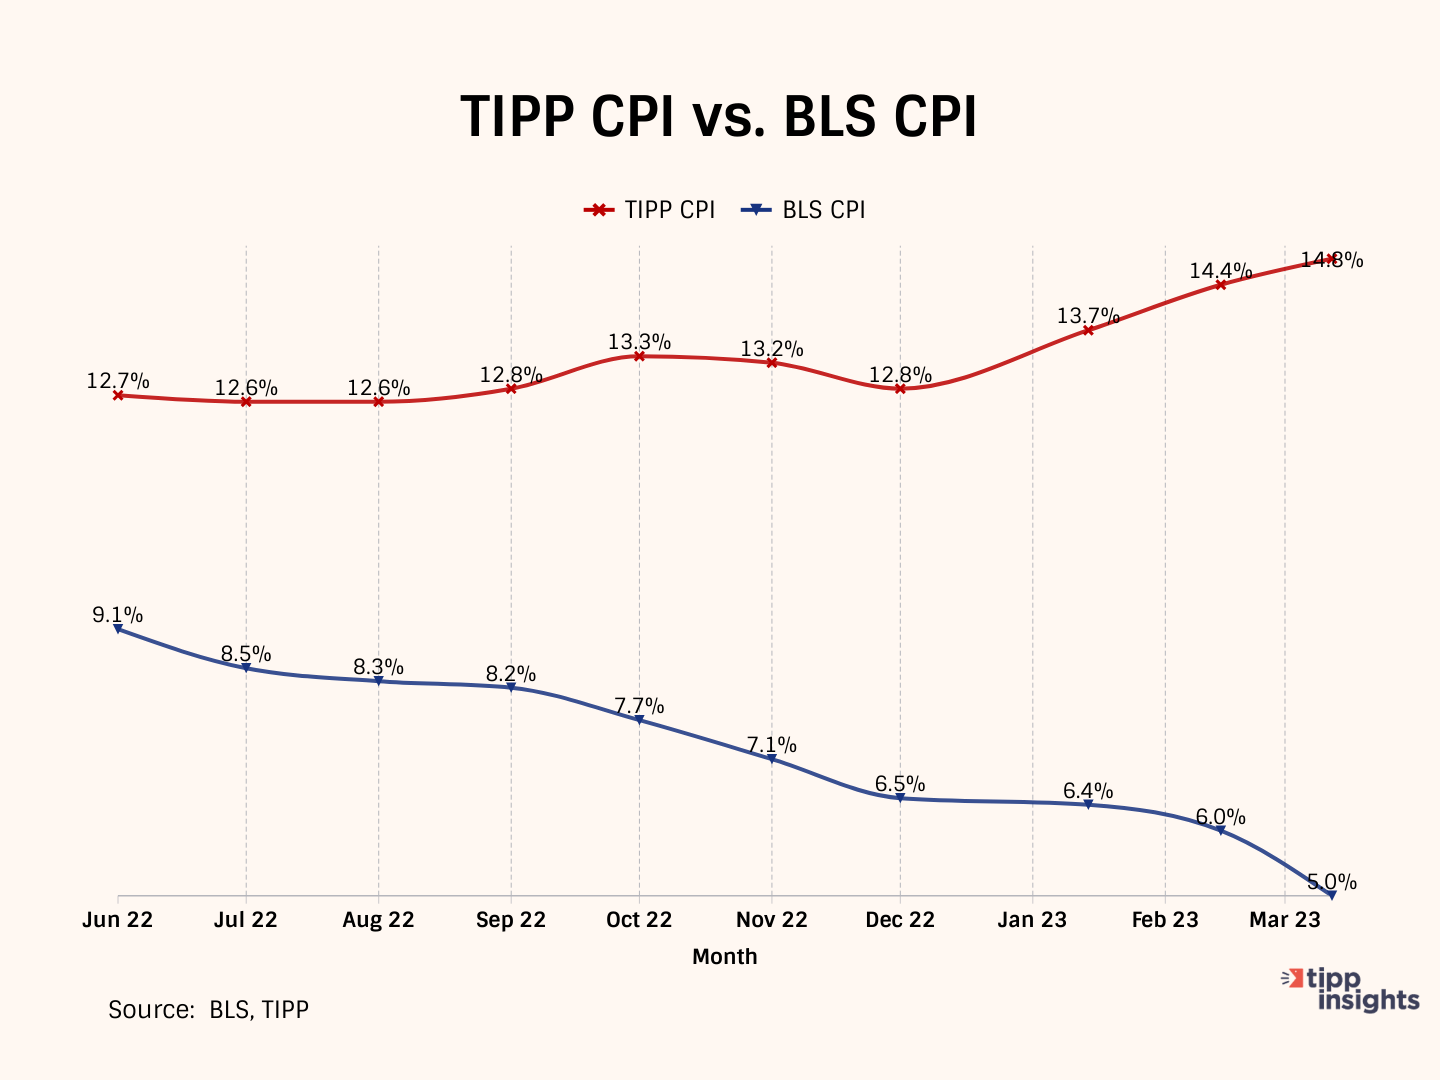
Bidenflation, measured by TIPP CPI using the same underlying data, stood at 14.8% in March. It was 14.4% in February, 13.7% in January, and 12.8% in December.
Significant inflation had already set in by the middle of 2021. In March 2022, CPI inflation was 8.5 percent. The official CPI year-over-year increases will compare prices to inflated bases in the coming months. The year-over-year calculation may moderate the statistics, but you will still feel the pinch of inflation.
TIPP CPI vs. BLS CPI
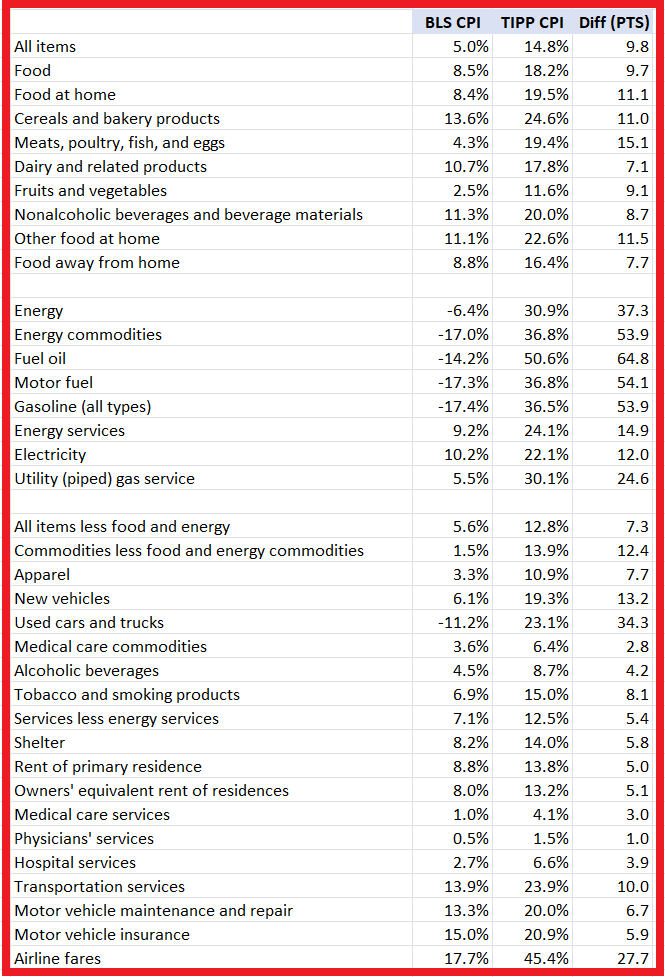
The following four charts present details about the new metric.
The annual CPI increase reported by BLS is 5.0% for March 2023. Compare this to the TIPP CPI of 14.8%, a 9.8-point difference. Prices have increased by 14.8% since President Biden took office. On an annualized basis, TIPP CPI is 6.83%.
Food prices increased by 18.2% under President Biden's watch compared to only 8.5% as per BLS CPI, a difference of 9.7 points. The variation is significant and, by design, ignored by Yellen because it would present a more accurate picture of an economy in trouble.
TIPP CPI data show that energy prices increased by 30.9%. But in Yellen's fantasy world, energy prices declined by 6.4%, according to the BLS CPI. The difference between the two is a whopping 37.3 points.
The Core CPI is the price increase for all items, excluding Food and Energy. The Core TIPP CPI was 12.8% compared to 5.6% BLS CPI in the year-over-year measure, a 7.3-point difference.
Further, gasoline prices have increased by 36.5% since President Biden took office, whereas the BLS CPI shows that gasoline price has improved by 17.4%, a difference of 53.9 points.
Used car prices have risen by 23.1% during President Biden's term. The BLS CPI shows that the prices have dropped by 11.2%, a difference of 23.1 points.
Inflation for air tickets under President Biden is 45.4% compared to the BLS CPI finding of 17.7%, a difference of 27.7 points.
Americans' Concerns
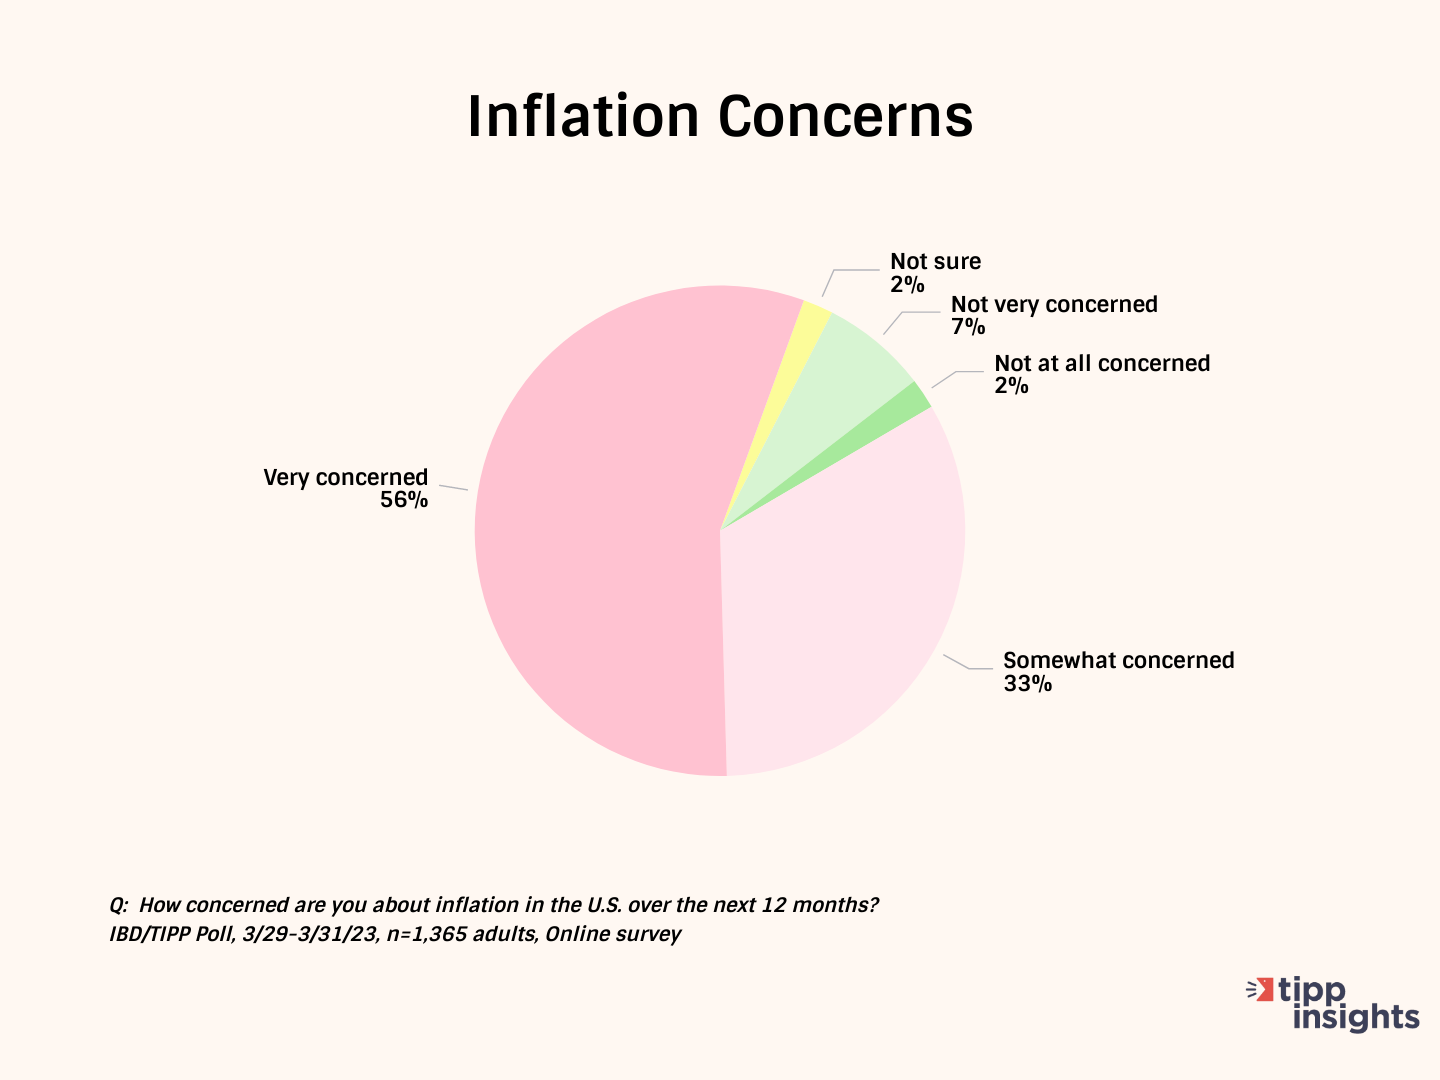
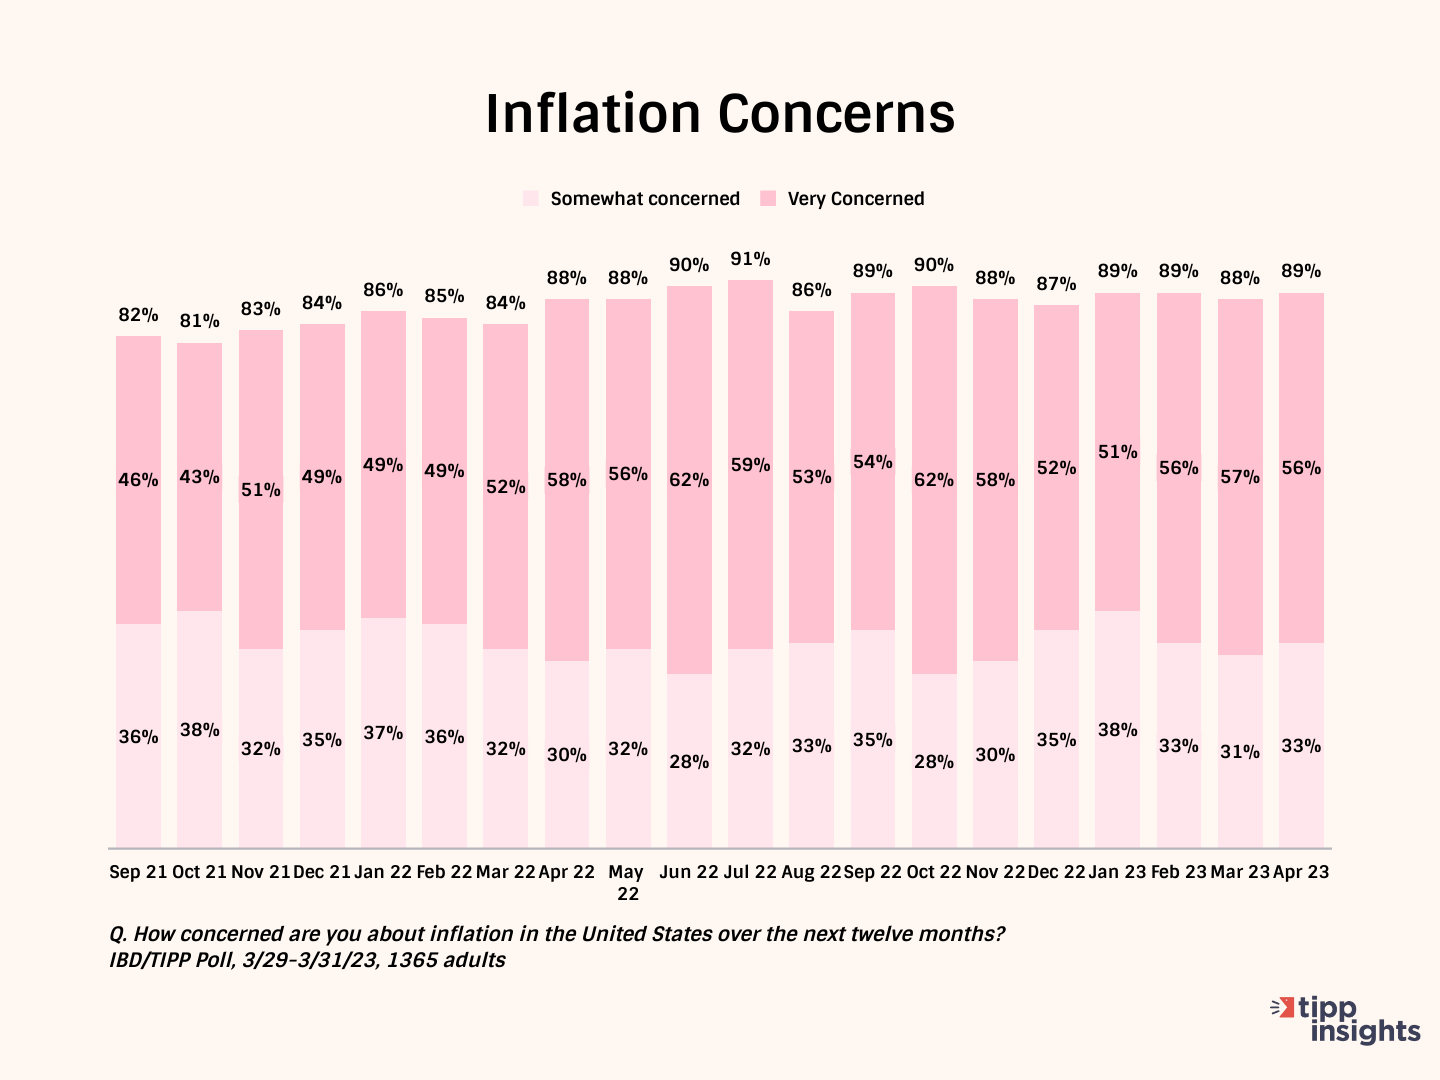
The latest Investor's Business Daily/TIPP Poll, completed earlier this month, shows that nine in ten (89%; 88% in March) survey respondents are concerned about inflation. Throughout the past year, inflation concerns have stayed above 80%. The share of "very concerned" has been over 50% for twelve consecutive months.
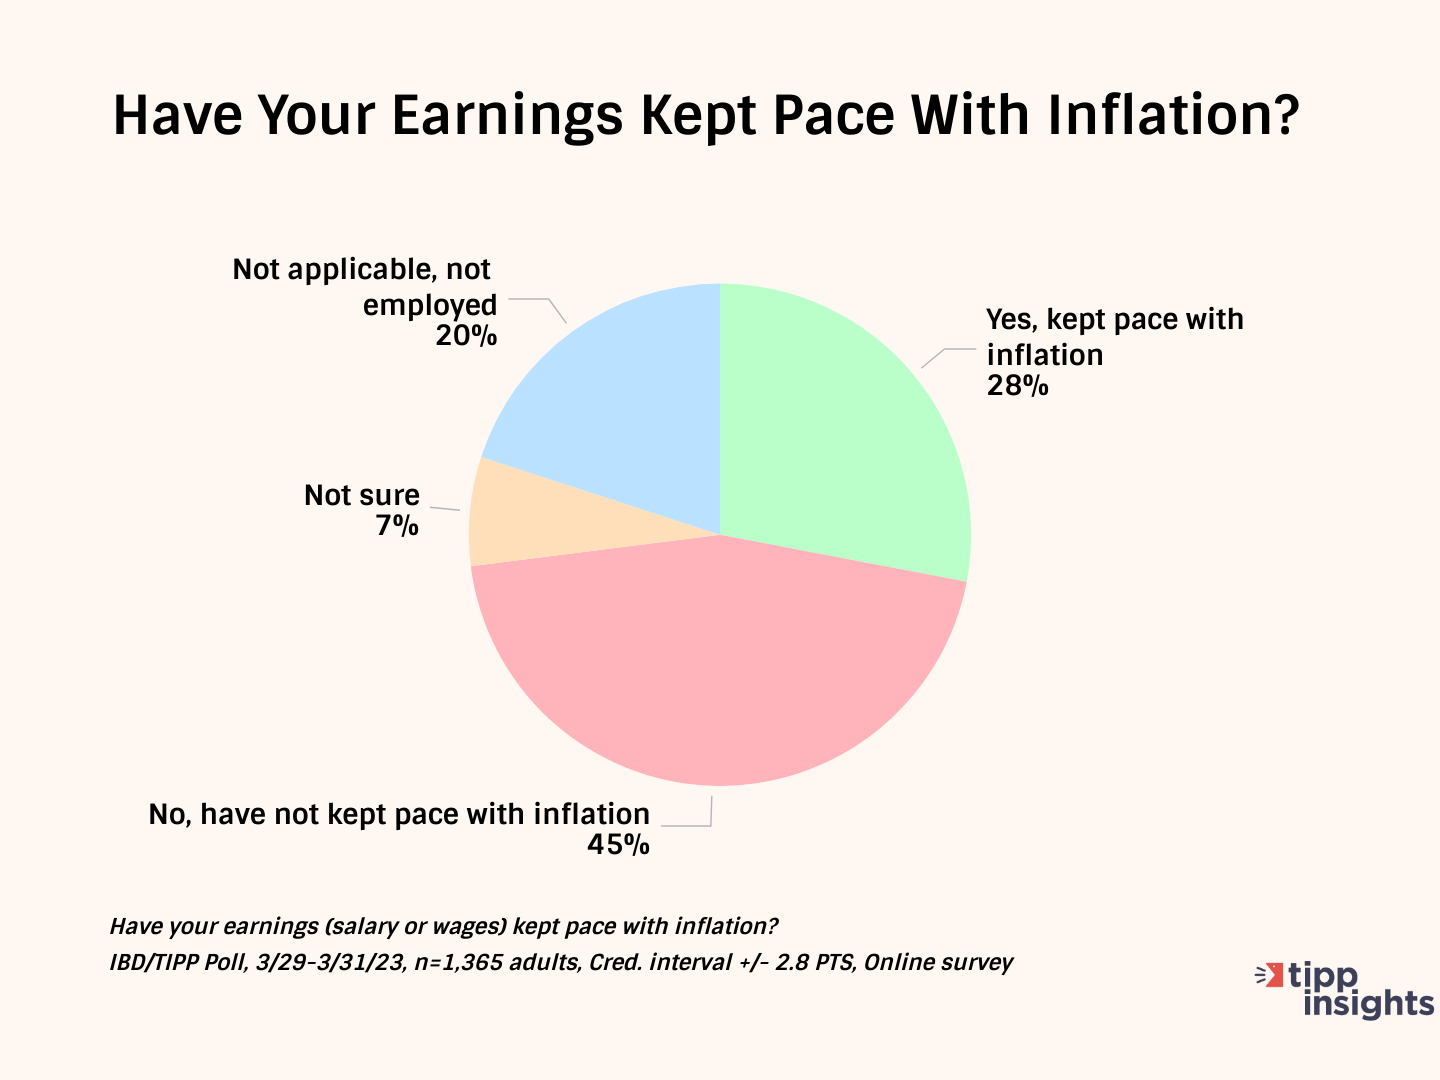
Over two in five ( 45%, 44% in March) say their wages have not kept pace with inflation. Only 28% (30% in March) say their income has kept pace with inflation. This statistic hovered in the low twenties for most of the last year. The positive change in the recent three months may denote the start of a new trend.
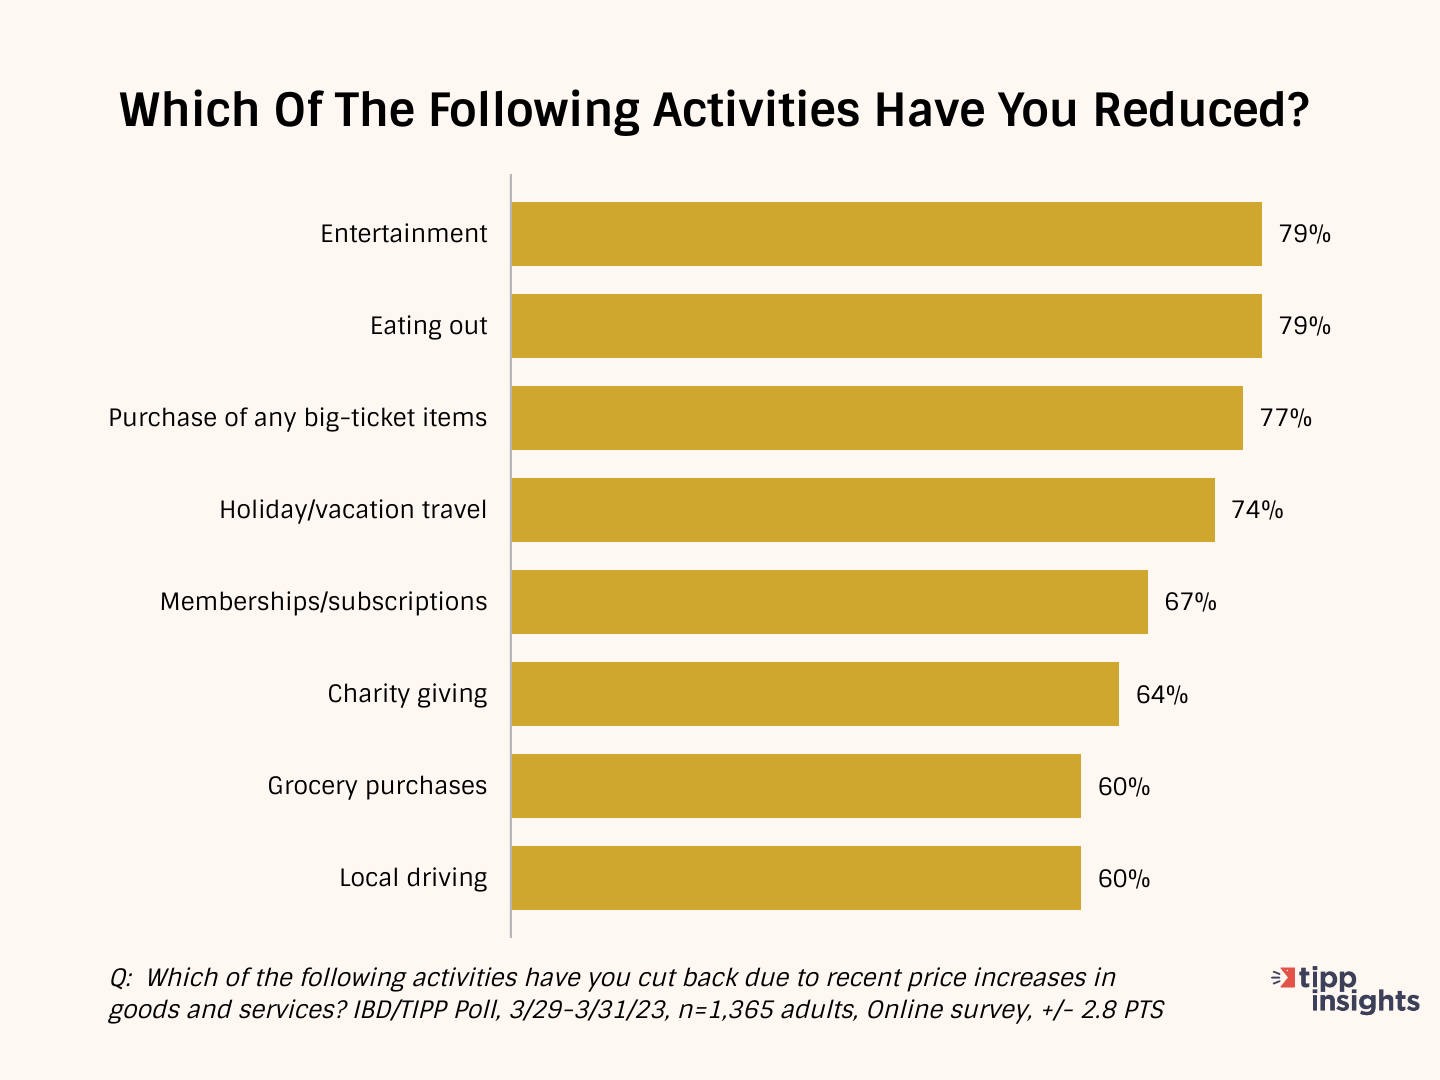
As a result of inflation, Americans are cutting back on household spending - cutting back on entertainment (79%), eating out (79%), purchasing big-ticket items (77%), holiday/vacation travel (74%), and memberships/subscriptions (67%). Many (64%) are cutting back on even good causes such as charity giving. Nearly three out of every five (60%) households spend less on groceries. The high gasoline prices forced 60% to cut back on local driving.
Inflation Direction
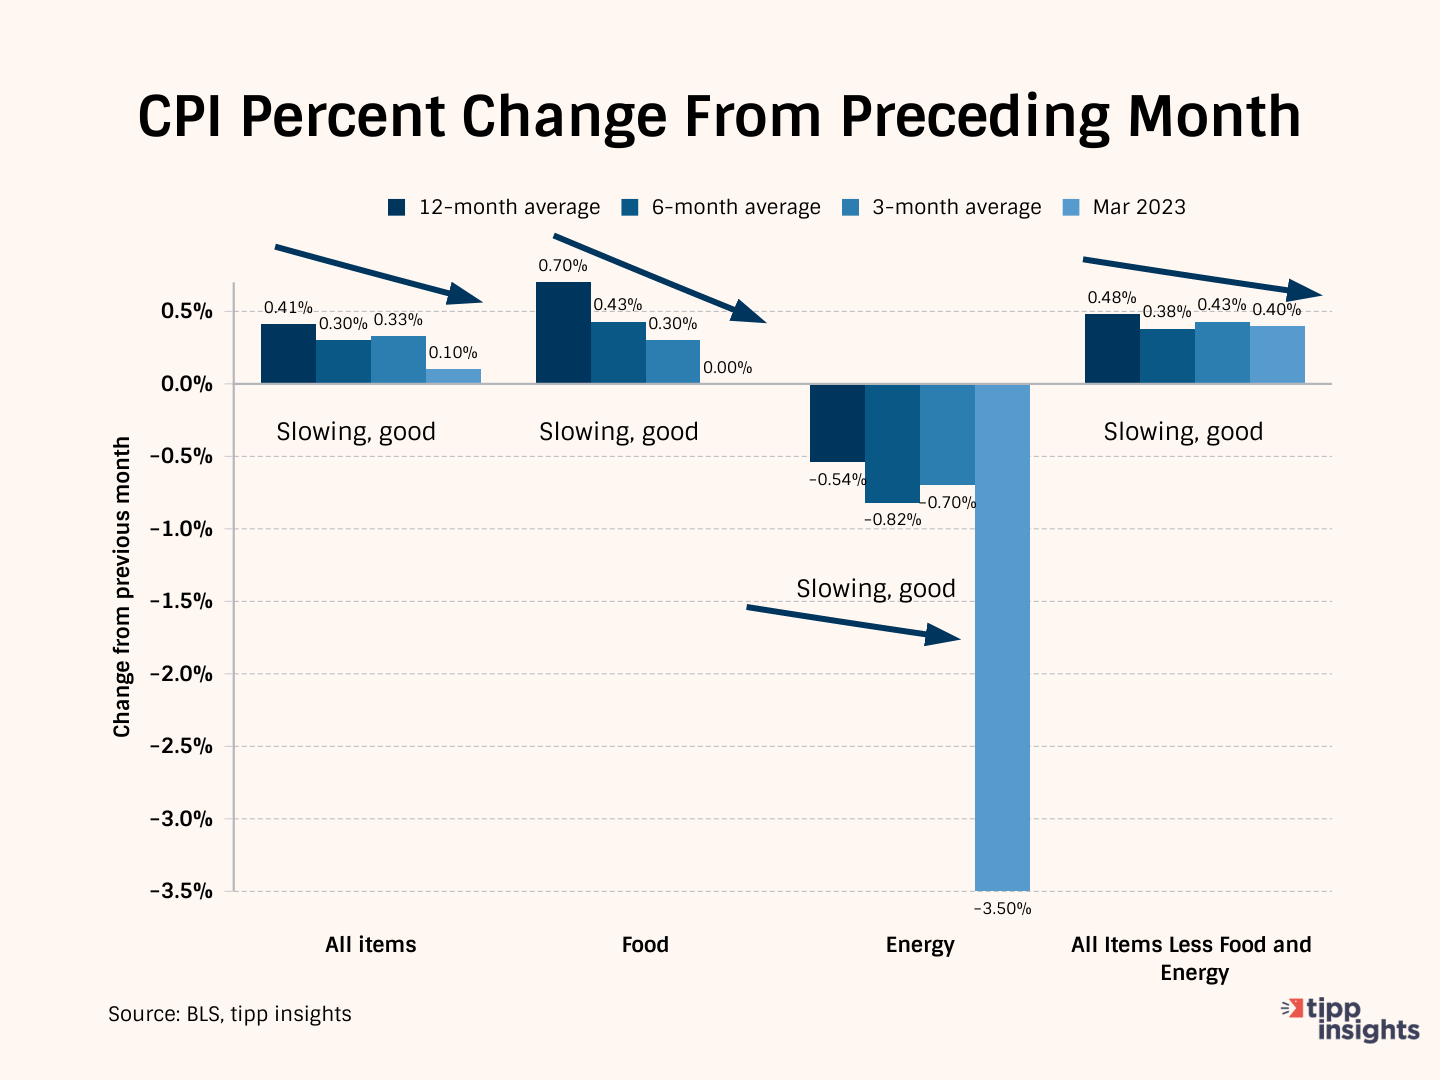
The chart below compares the 12-month average of monthly changes against the 6-month and the 3-month averages. We also show the reading for March 2023.
The 12-month average considers 12 data points and presents a long-term reference, while the six-month and three-month averages consider recent data points.
To better understand, compare the three-month average to March 2023 data. For "all items," the three-month average was 0.33% vs. 0.1% in March 2023. It is decreasing, and hence it is good.
The March reading for Food (0.00%) is lower than the 3-month average of 0.30%, lower than the 6-month average of 0.43%, and the 12-month average of 0.7%. The downward trend shows improvement.
Similarly, for Energy, the rate is decreasing. The decrease in March 2023 (-3.5%) exceeded the three-month moving average of -0.70%, indicating improvement.
For "all items less food and energy," the March reading of 0.40% is lesser than the three-month average of 0.43%, indicating improvement relative to the past three months. However, the 3-month average of 0.43% is greater than the 6-month average of 0.38% showing inflation pickup.
We interpret this as a mixed situation.
With an inverted yield curve, short-term U.S. treasuries pay higher interest rates than long-term U.S. treasuries. The closing yields on Wednesday were:
- 5.013% for the 3-month Treasury bill
- 4.956% for the 6-month Treasury bill
- 3.972% for the 2-year Treasury
- 3.421% for the 10-year
- 3.655% for the 30-year
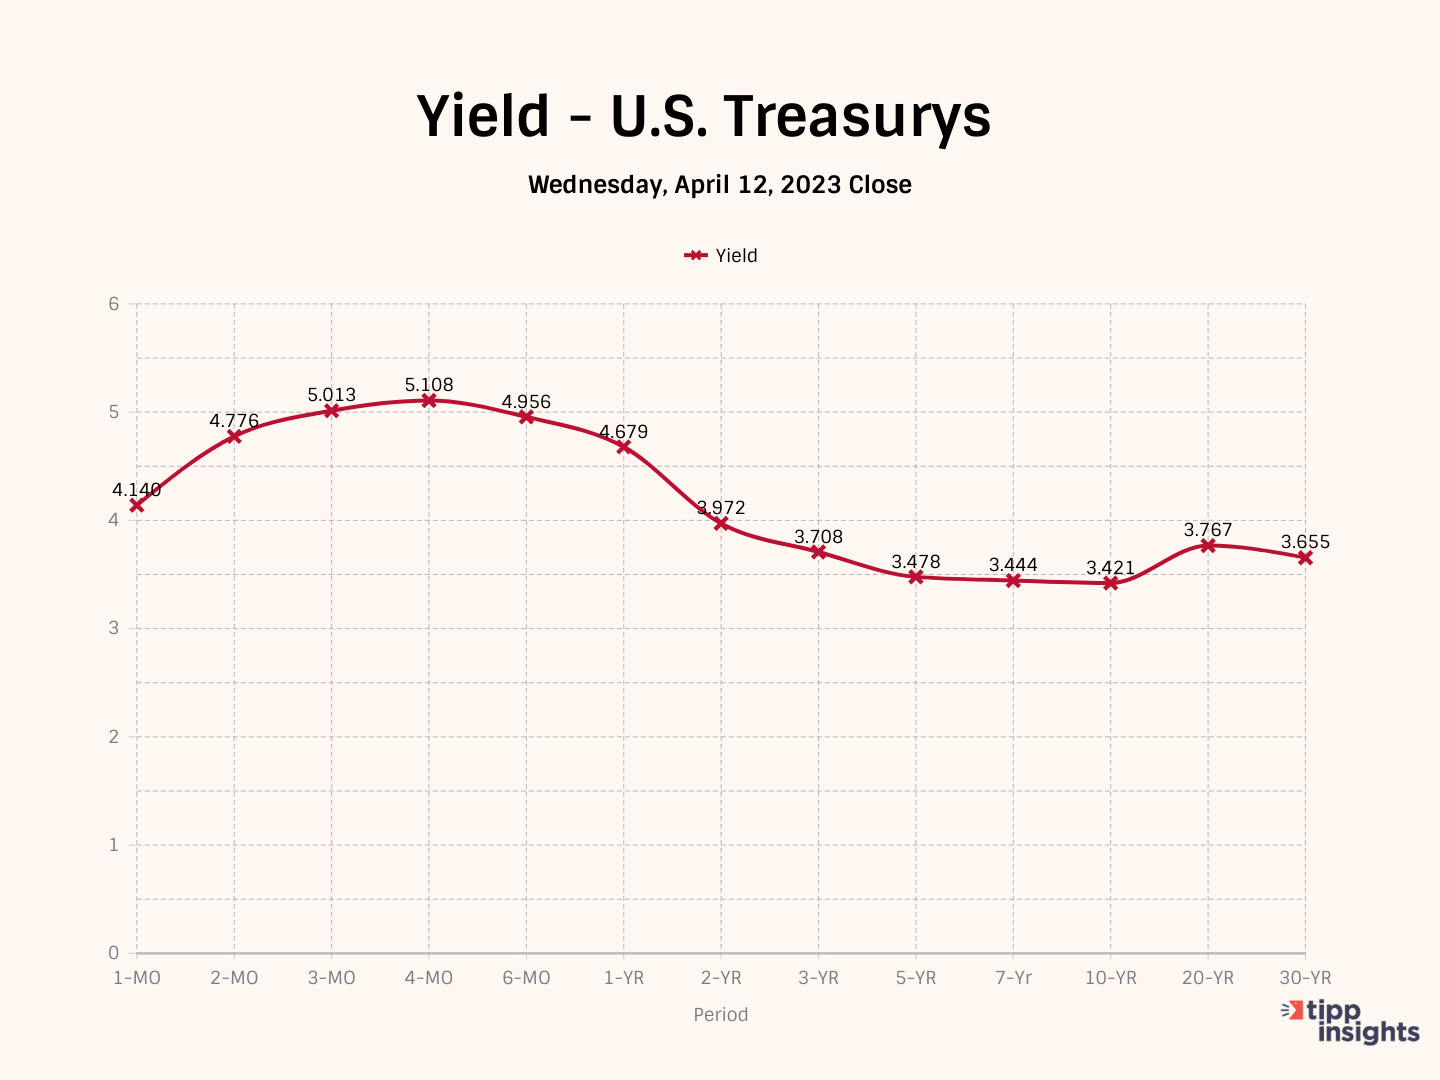
The inverted yield curve is a leading indicator of lower inflation but also a leading indicator of recession.
Most Americans (55% in April, 53% in March) believe the economy is in a recession, and another 56% (57% in March) think the economy is not improving.
To access the TIPP CPI readings each month, you can visit tippinsights.com. We'll publish the TIPP CPI and our analysis shortly after the release of the official Bureau of Labor Statistics (BLS) report.
The upcoming release of TIPP CPI is on May 11, 2023. We'll also post a spreadsheet in our store for download.
Hey, want to dig deeper? Download data from our store for a small fee!
Like our insights? Show your support by becoming a paid subscriber!
Want to show your appreciation? Donate
Want to understand better? We recently wrote an explainer that sixth graders could understand. Everyone can benefit from it. Milton Friedman's Priceless Lessons On Inflation.


