
- Bidenflation at 19.2% squeezes Americans’ budgets
- Annualized Bidenflation steady at 5.9%
- Core prices are stubborn at 3.6%
- RELATED: Americans' Economic Confidence Declines Sharply In May: RCM/TIPP
President Biden, a seasoned politician, has failed miserably in tackling inflation, and it is nearly certain that he can’t wave a magic wand and tame the beast before November. So, he has embarked on an alternate strategy to pin it on Trump. The President, famous for his tales about the "bad dude" Corn Pop, calling a voter at a campaign stop a "lying dog-faced pony soldier," the death of his uncle Finnegan due to 'cannibalism' in Papua New Guinea, and how the xenophobia of Indians and Japanese impede progress, keeps claiming that inflation was nine percent when he took office, even though it was 1.4%.
When President Biden first made the claim, we dismissed it like Special Counsel Robert Hur as coming from a “sympathetic, well-meaning, elderly man with a poor memory." He has now repeated the claim several times, and we wonder why none of his economic advisors or Nobel Laureate economist friends have corrected him.
Americans know the truth, and the claim comes across as malarkey in plain Biden speak.
The dark reality of Bidenomics is 19.2% inflation under the President’s watch, which is 5.9% annually. When he took office, inflation was at just 1.4%. Since March 2021, it has stayed above the Federal Reserve's 2% target (38 consecutive months.).
Under Biden, the federal debt has increased by $6.9 trillion. The Federal Reserve printed money out of nothing to finance his spending spree. The increased money supply without a corresponding increase in goods and services reduced the value of each dollar, causing prices to rise quickly and leading to high inflation, effectively acting as a hidden tax on everyone.
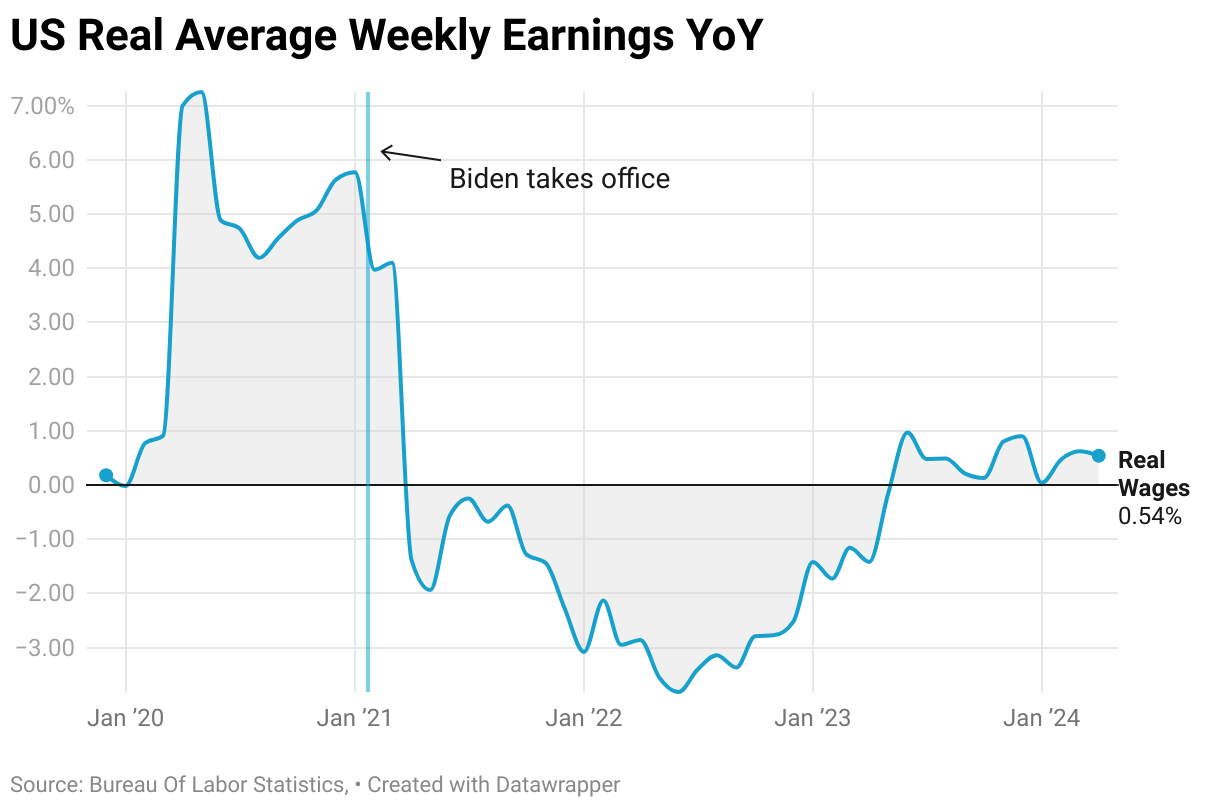
Prices have increased by 19.2%, while real wages have declined by 2.6%. Average hourly earnings for all employees dropped 2.6% to $11.09 in April 2024 from $11.39 in January 2021 when Biden took office.
According to Mark Zandi, the chief economist at Moody's Analytics, the typical U.S. household now requires $1,069 more each month (equivalent to $12,828 annually) compared to three years ago, $784 more per month compared to two years ago, and an additional $227 per month compared to last year.
As a result, credit card debt and delinquencies are surging amid high interest rates. According to TransUnion data published on Thursday, the average credit card debt of an American borrower ballooned to $6,218 in Q1 2024, an 8.5% rise from the previous year. This collectively increased total debt to $1.02 trillion as the credit card delinquency rate, defined as 90 or more days late, climbed to 8.9%, the highest since 2012. The average credit card APR hit a record 20.72%.
Housing affordability has also collapsed under the weight of Bidenomics. During Biden’s tenure, the monthly mortgage payment on a median-price home has increased 115%. According to a recent analysis by real estate site Redfin, prospective homebuyers need an annual income of $113,520 to afford a typical house in the U.S., which is 35% higher than the average household income of $84,072. The last time the typical household income exceeded the amount needed to afford the median home was in February 2021, ironically the month after Biden took office.
Therefore, it is unsurprising that inflation and food prices emerged as top economic issues among Americans in a recent nationwide TIPP Poll.

CPI Report
The government's Consumer Price Index (CPI), released on Wednesday, showed a 3.4% year-over-year price increase from April 2023 to April 2024.
The CPI rate had declined steadily for 12 consecutive months from a 40-year high of 9.1% in June 2022 to 3.0% in June 2023. In July, it broke that run and increased to 3.2%. Since then, it has moved sideways in the 3.1% to 3.7% range.
After adjusting for seasonality, the Consumer Price Index (CPI) increased by 0.3% between March 2024 and April 2024. During the same period, food prices stayed stable with a 0.0% increase, energy prices increased by 1.1%, and core prices (all items except food and energy) increased by 0.3%.
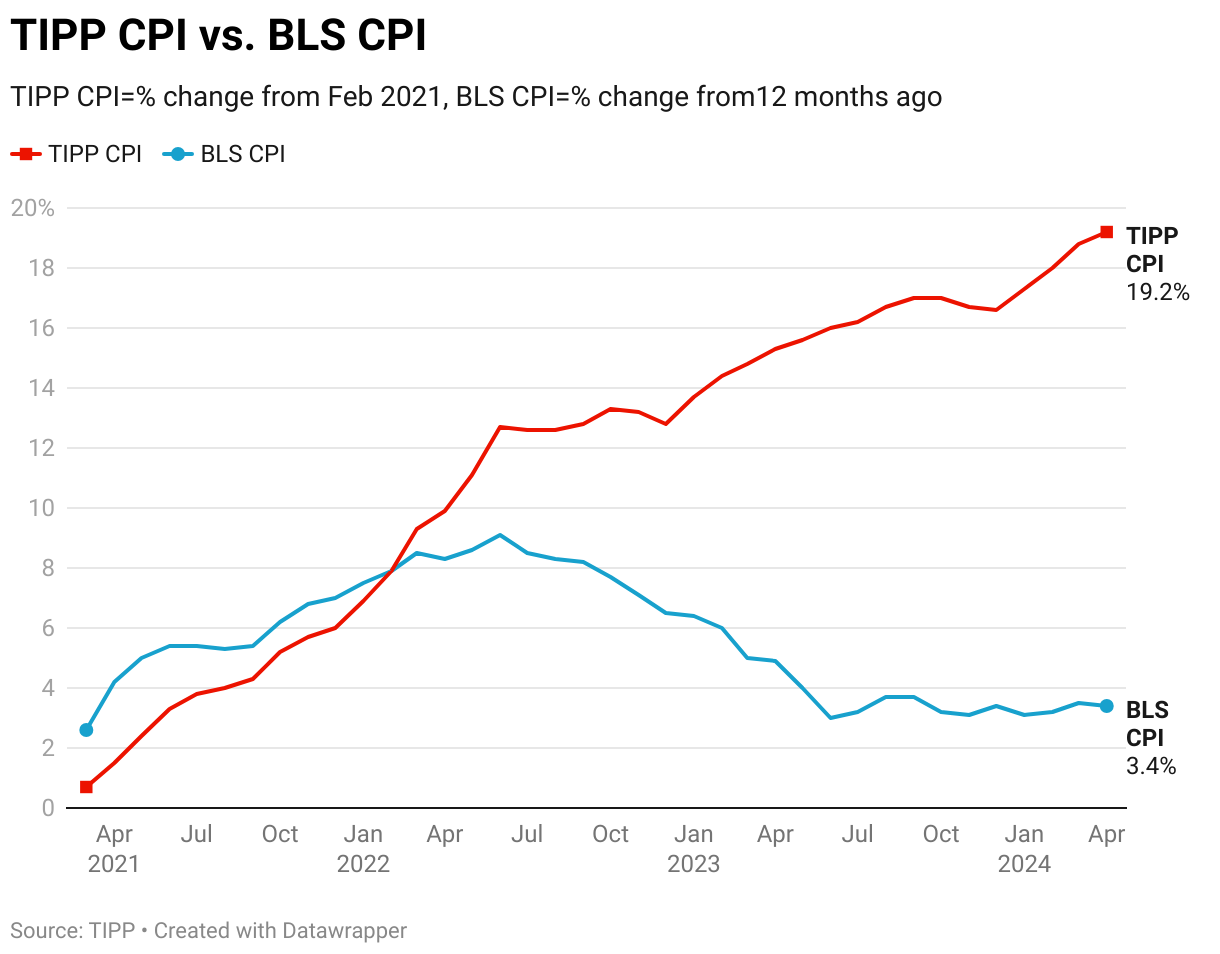
TIPP CPI
We developed the TIPP CPI, a metric that measures the rate of change using February 2021, the month after President Biden's inauguration. All TIPP CPI measures are anchored to this month, making them exclusive to the economy under President Biden's watch.
What is the motivation behind the TIPP CPI?
Although prices aren't rising as quickly as before, today's inflation is adding to past increases, making it even harder for Americans to manage their expenses. The BLS CPI rate doesn't accurately capture Americans’ inflation struggles. The official BLS CPI year-over-year calculations compare prices to already inflated bases, and these statistics could mask the full impact. Further, the media and some economists frequently use the low CPI rate to present a rosy economic outlook supporting Biden’s policies.
In contrast, the TIPP CPI rate offers a clearer understanding of Americans’ economic challenges under President Biden. We use the relevant data from the Bureau of Labor Statistics (BLS) to calculate the TIPP CPI, but we adjust the period to Biden's tenure. When discussing the TIPP CPI and the BLS CPI, we convert the index numbers into percentage changes to better understand and compare them. CPIs are like index numbers that show how prices affect people's lives, similar to how the Dow Jones Industrial Average reflects the stock market.
Bidenflation, measured by the TIPP CPI using the same underlying data, increased to 19.2% in April. It was 18.8 in March, 18.0% in February, 17.3% in January, and 16.6% in December.
TIPP CPI vs. BLS CPI
The following two charts present details about the new metric.
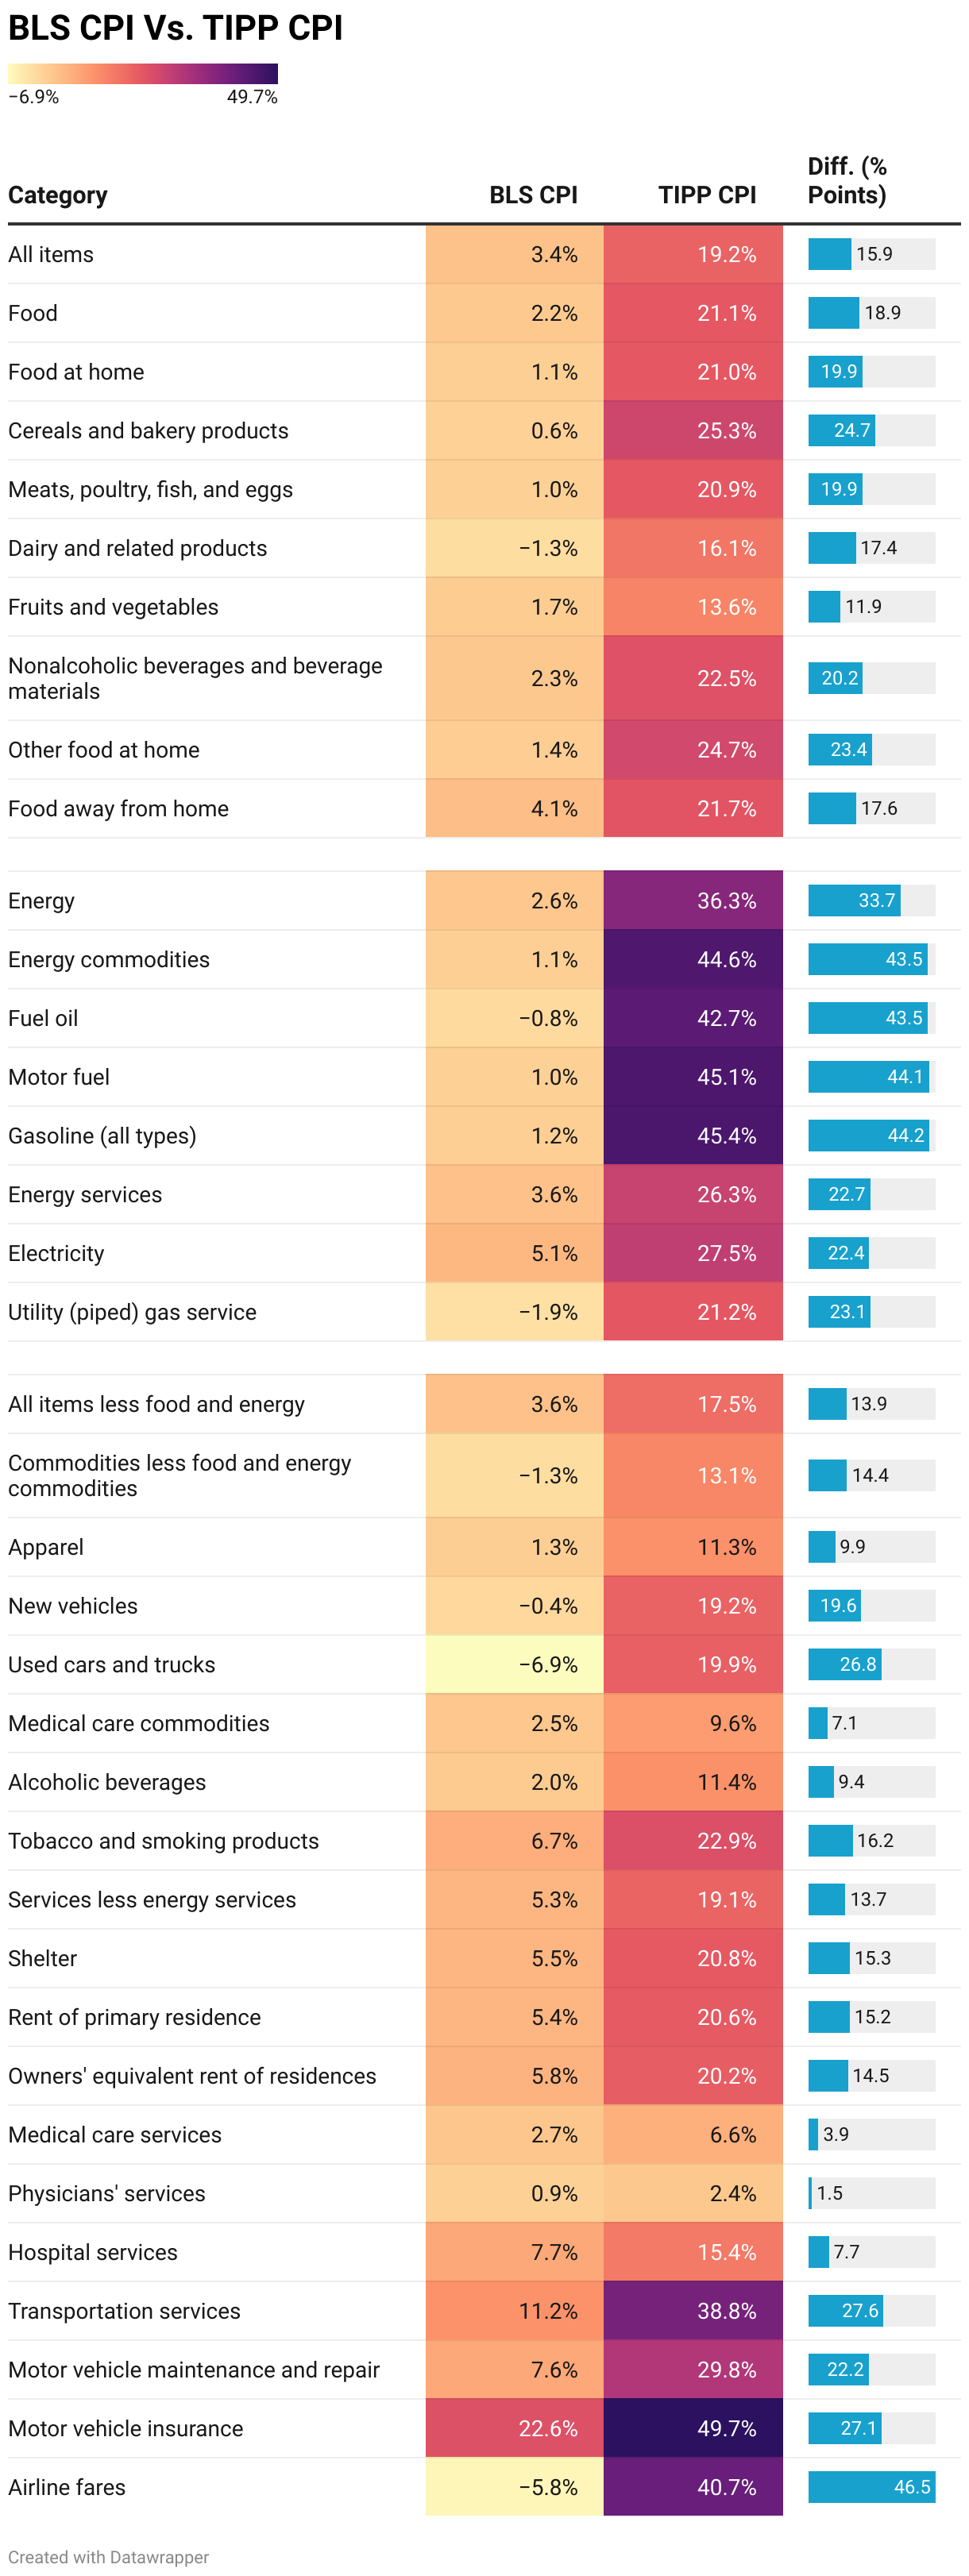
For April 2024, the BLS reported a 3.4% annual CPI increase. Compare this to the TIPP CPI of 19.2% - a 15.9-point difference. Prices have increased by 19.2% since President Biden took office. On an annual basis, TIPP CPI is 5.9%.
Food prices increased by 21.1% under Biden compared to only 2.2% as per BLS CPI, a difference of 18.9 points.
TIPP CPI data show that Energy prices increased by 36.3%. But, according to the BLS CPI, energy prices rose by 2.6%. The difference between the two is a whopping 33.7 points.
The Core CPI measures the price increase for all items, excluding food and energy. The Core TIPP CPI is 17.5% compared to 3.6% BLS CPI, a 13.9-point difference.
Further, gasoline prices have increased by 45.4% since President Biden took office, whereas the BLS CPI shows that gasoline prices have increased by 1.3%, a difference of 44.2 points.
Shelter costs rose by 20.8% under Biden’s watch, compared to the BLS reading of 5.5%, a difference of 15.3 points.
TIPP CPI finds that Used car prices have risen by 19.9% during this President’s term. Meanwhile, the BLS CPI reports that the prices have dropped 6.9%, a difference of 26.8 points.
Air ticket inflation is 40.7% compared to the BLS CPI’s finding of an improvement of 5.8%, a difference of 46.5 points.
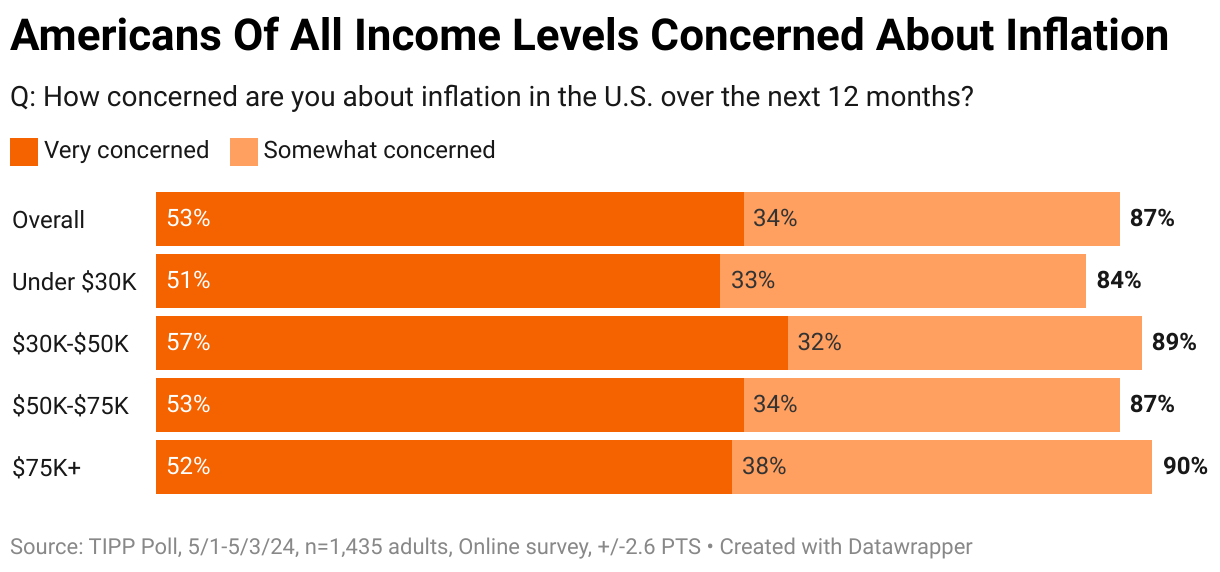
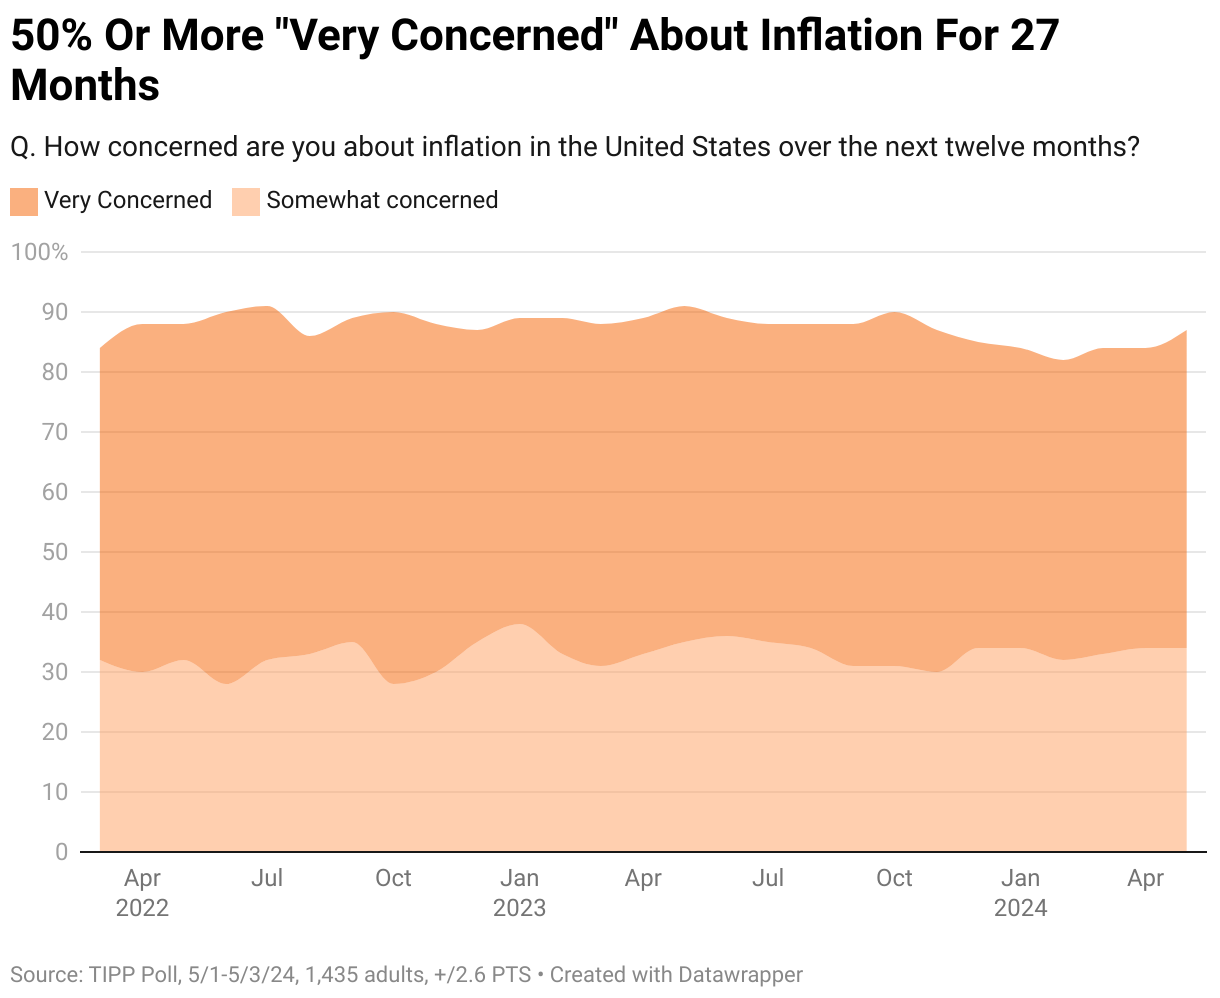
The latest TIPP Poll, completed earlier this month, shows nearly nine in ten (87%) survey respondents are concerned about inflation. Since January 2022, inflation concerns have stayed above 80%. The "very concerned" share has been at least 50% since March 2022, i.e., for the past twenty-seven months.
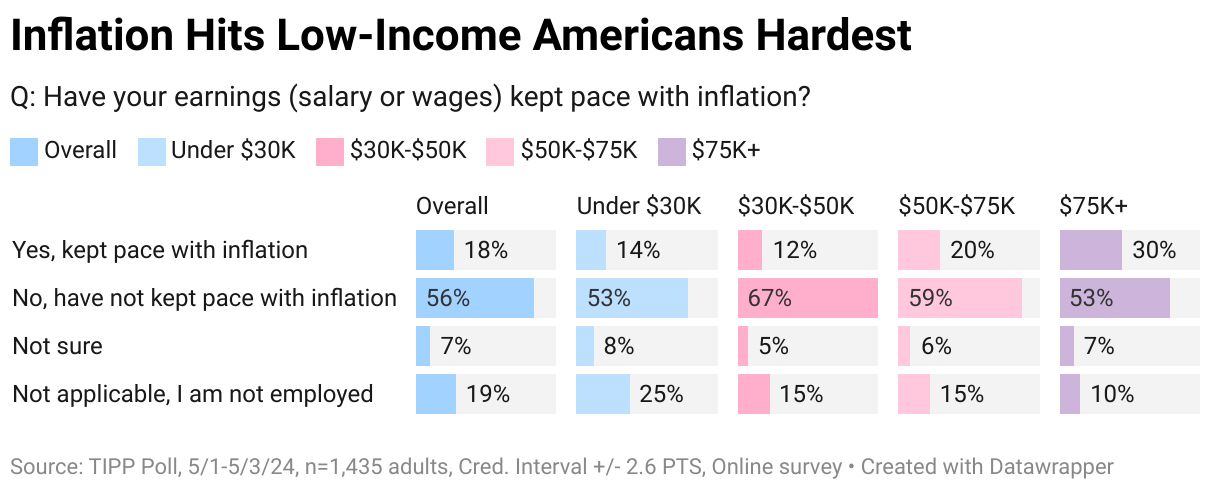
As the chart below shows, the concern is shared by all income levels.
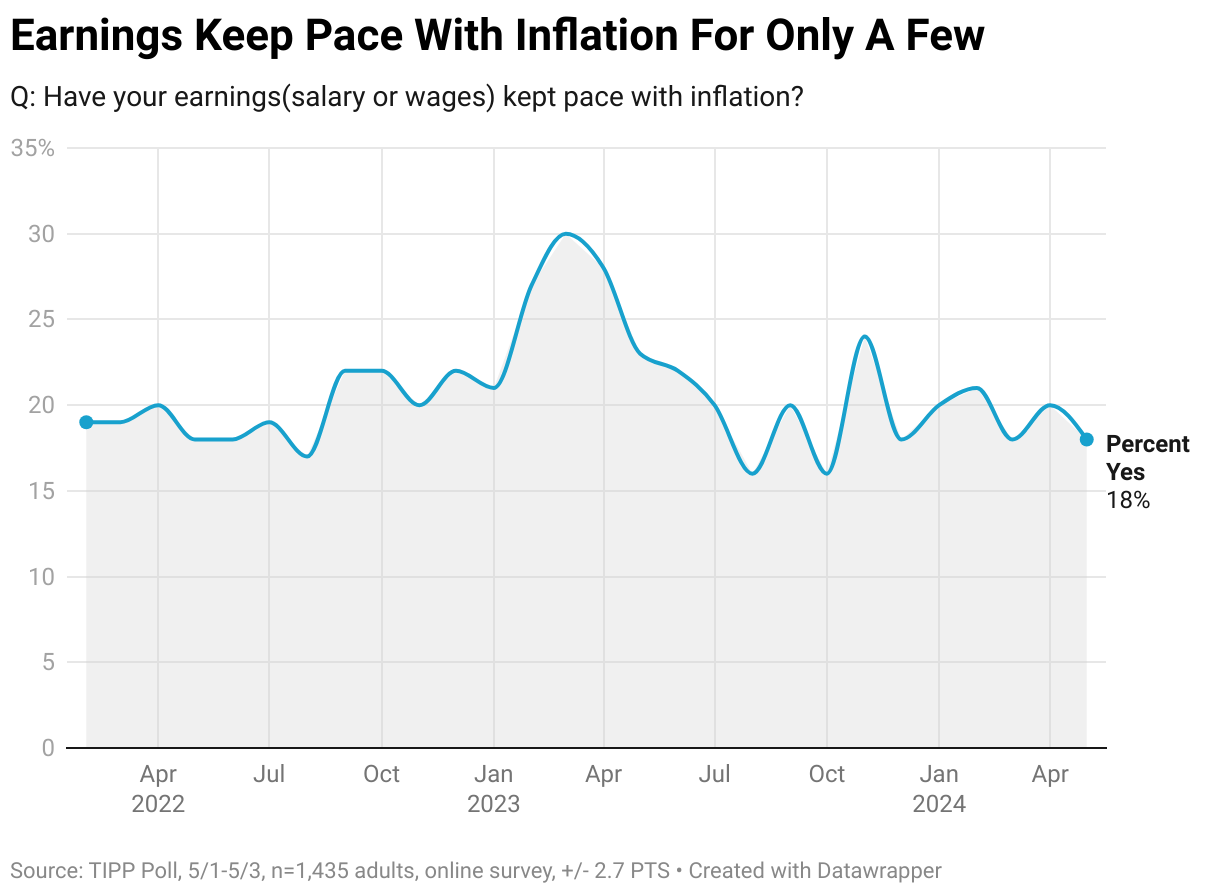
Over half (56%) say their wages have not kept up with inflation, while only one in five (18%) say their income has. Since December 2023, this statistic has moved in the tight 18% to 21% range.
Our data shows that households in higher income brackets are more likely to say that their earnings have kept pace with inflation: 20% for $50K–$75K and 30% for $75K+, compared to 14% for under $30K and 12% for $30K–$50K households.
Nominal wages represent the amount of money one earns without considering changes in the cost of living. On the other hand, real wages consider inflation and measure the purchasing power of wages. Real wages provide a more accurate reflection of what is affordable with the income earned by factoring in the changes in the cost of living.
Real weekly wages, measured year-over-year, showed negative readings for 26 out of the 39 months during the Biden presidency from February 2021 to April 2024. The 26-month negative streak was broken in June. The measure has posted positive readings for 11 months, from June 2023 and April 2024.
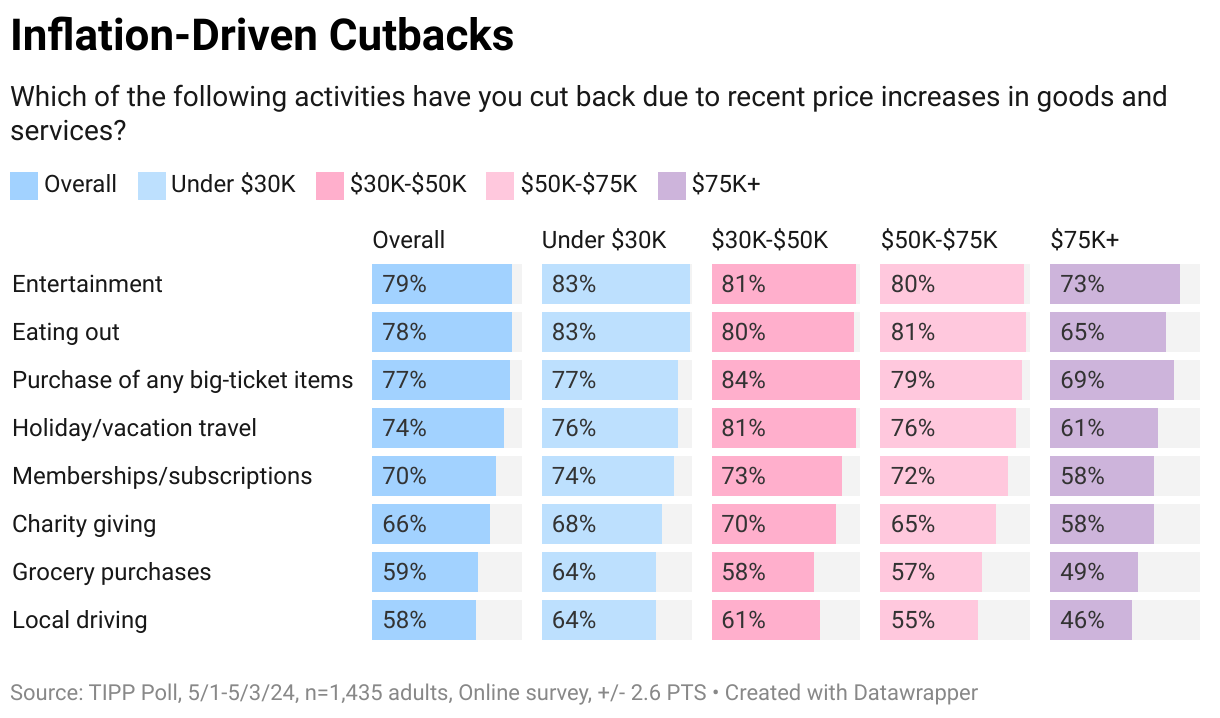
As a result of inflation, Americans are cutting back on household spending.
They are cutting back on entertainment (79%), eating out (78%), purchasing big-ticket items (77%), holiday/vacation travel (74%), and memberships/subscriptions (70%).
Nearly two-thirds (66%) are cutting back on charity giving. Over one-half (59%) of households spend less on groceries. The high gasoline prices forced 58% to cut back on local driving.
The cutbacks are more prevalent among lower-income households than their higher-income counterparts.
American Dream Of Owning A Home
Bidenflation has not been kind to help Americans realize their dream of owning a home.
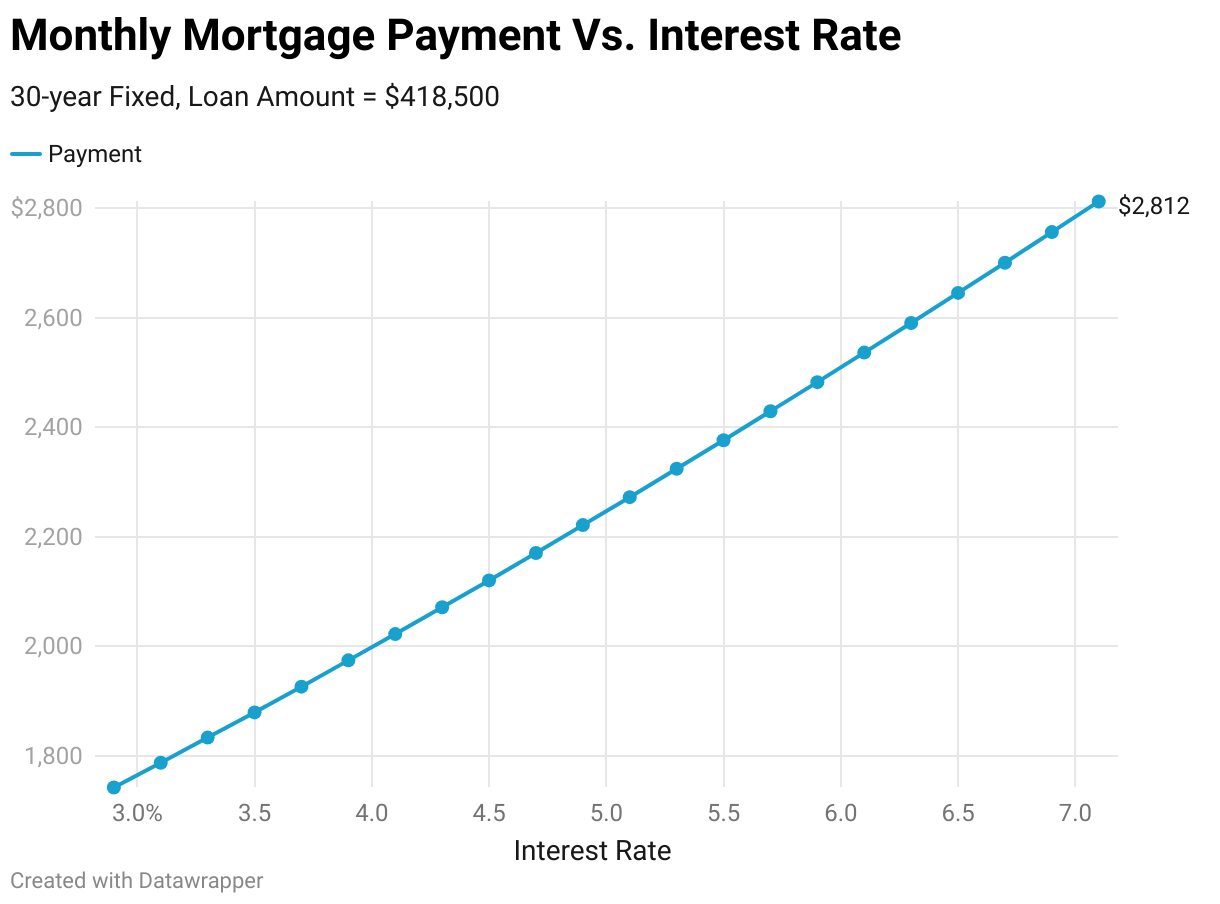
According to Freddie Mac, when Biden took office in 2021, the average 30-year home mortgage rate was 2.96%. The rate rose to 5.34% in 2022 and 6.81% in 2023. The Fed's Funds Rate, which steadily increased from near zero in April 2022 to about 5.50%, has little impact on the 30-year mortgage rate, but a tightening inflationary picture has helped push mortgage rates higher and higher. The current national average of the 30-year rate is 7.2%. Home prices have skyrocketed due to a severe housing shortage resulting from a surge in migration and unmet demand for new home construction. Further, many Americans who now own homes at low-interest rates locked for 15 years cannot sell because they will have to buy at higher interest rates. These factors have made it extraordinarily difficult for first-time home buyers, as many homes stay out of reach.
The chart below shows how rising mortgage rates have affected the average American household. The average home price in America is about $465,000. Assuming that a family makes a downpayment of 10%, they would borrow $418,500 over 30 years. Of course, the interest rates remain fixed, but the monthly set-aside for mortgage payments increases steadily with each new family aspiring to own a home. This set aside does not include other homeowner costs, such as home insurance rates, maintenance, and real estate taxes, which are also steadily rising.
Inflation Direction
The chart below compares the 12-month average of monthly changes against the 6-month and the 3-month averages. We also show the reading for April 2024.
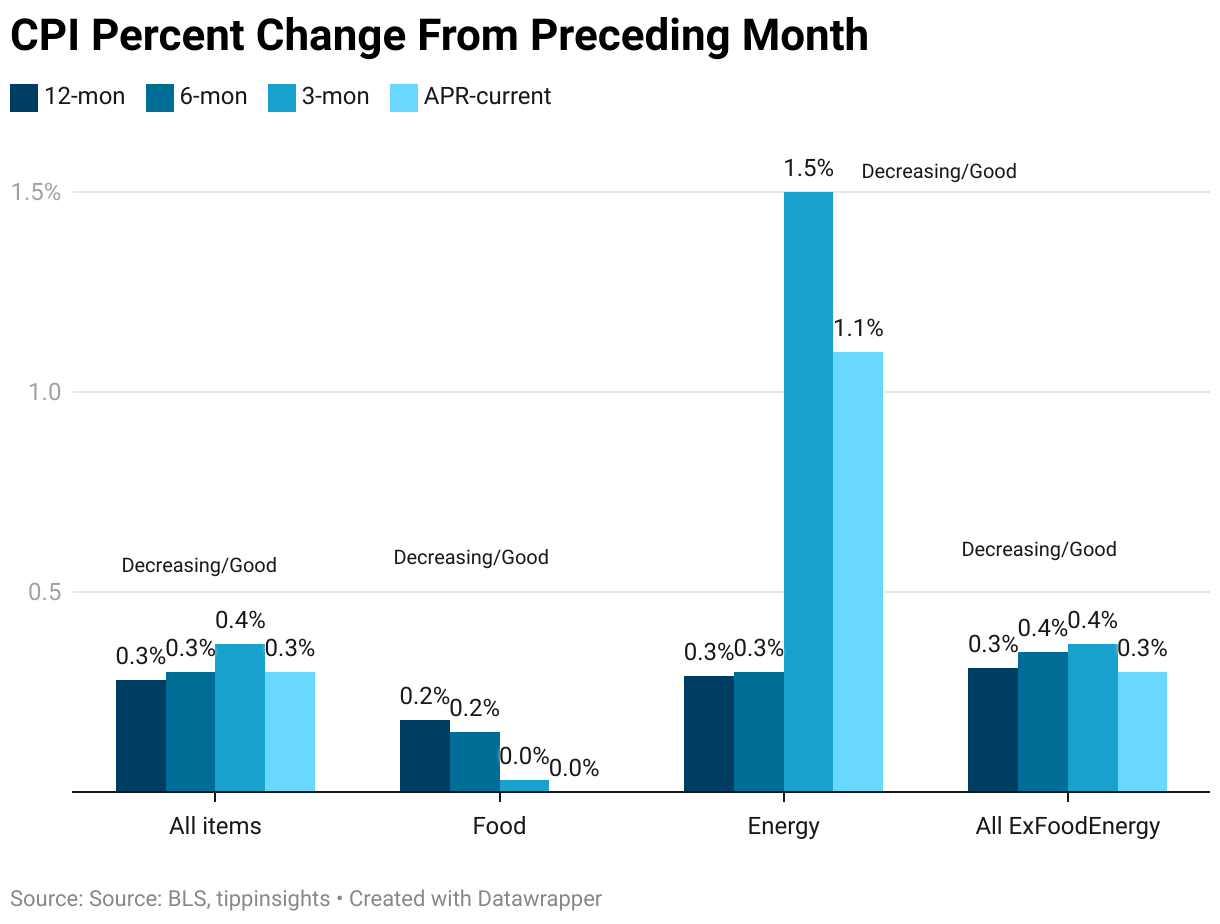
The 12-month average considers 12 data points and presents a long-term reference, while the six-month and three-month averages consider recent data points.
Typically, we compare the data from April 2024 to the three-month average to gain a clearer perspective. In April 2024, the price increase for All items was 0.30%, smaller than the three-month average of 0.40%. This shows an improvement in April.
Meanwhile, the three-month average of 0.40% is larger than the six-month average of 0.30%, indicating a recent acceleration in the rate of increase over the last three months. Based on the April reading, we can say that inflation is slowing down.
In April, Food prices did not increase, posting 0%, similar to the 3-month average of 0%. Further, the 3-month average is lower than the 6-month average of 0.20%. The slowdown suggests food prices are stabilizing, which is welcome news.
Meanwhile, Energy prices increased by 1.10%, which is smaller than the three-month average of 1.50%, indicating a slowdown. The three-month average increased compared to the 12-month average of 0.30% and the six-month average of 0.30%. In summary, the energy situation has recently improved.
All items less food and energy, known as "core inflation," was 0.30%, lower than the three-month average of 0.40%. However, the three-month average of 0.40% was the same as the six-month average of 0.40%. The data here again shows recent improvement.
In summary, we witnessed an improvement in energy prices, core items, and all other items in April. Also, food prices continued to stabilize.
Based on our trend analysis, April was a good month.
Monetary Policy
Since March 2022, the Fed has raised interest rates 11 consecutive times, bringing its benchmark interest rate to 5.25%, the highest level in 22 years.
With the core CPI entrenched at 3.6% and geopolitical tensions that could lead to volatility in the energy markets, we are unsure of what lies ahead. We believe it won't be easy to bring CPI inflation down to the Fed's target of 2.0%, and more rate hikes may be needed.
Biden wants a rate cut. He even dares to predict the Federal Reserve's monetary policy, disregarding the Fed's independence. In a White House press conference during Japanese Prime Minister Fumio Kishida’s visit, he boldly stated, “Well, I do stand by my prediction that, before the year is out, there’ll be a rate cut.”
In an election year, the Fed must balance rate cut pressures to help Biden's reelection and the larger interest of taming inflation.
Fiscal Policy
The national debt is $34.55 trillion, according to the Debt to the Penny dataset, which the Treasury updates daily. For the current fiscal year, which began in October 2023, the U.S. is expected to pay over $1 trillion in interest, more than the U.S. defense budget.
In an interview with Sky News on Wednesday, JP Morgan CEO Jamie Dimon emphasized the need for the U.S. government to address its budget deficit before financial markets force a reckoning. Dimon said:
The sooner we focus on it, the better. At one point, it will cause a problem… the problem will be caused by the market, and then you’ll be forced to deal with it and probably in a far more uncomfortable way than if you dealt with it to start.
The spending spree has also driven up consumer price inflation. Dimon said:
Any country can borrow money and drive some growth, but it may not always lead to good growth, so I think America should be quite aware that we’ve got to focus on our fiscal deficit issues a little bit more, and that is important for the world.
Biden wants a $7.3 trillion budget for the next year, which means more borrowing and more inflation.
Most Americans are concerned about the sustainability of this trajectory. The high interest rates are also hurting Americans and sapping their confidence.
Monetary policy alone can’t fix the inflation situation without fiscal austerity—a lesson President Biden would never learn. Inflation is here to stay as long as Biden pursues a loose fiscal policy. Coupled with a slowing economy, “the stag,” expect Bidenflation to transform into stagflation.
To access the TIPP CPI readings each month, you can visit tippinsights.com. We'll publish the TIPP CPI and our analysis in the days following the Bureau of Labor Statistics (BLS) report. The upcoming release of TIPP CPI is on June 13, 2024. We'll also post a spreadsheet in our store for download.
Hey, want to dig deeper? Download data from our store for a small fee!


