- Bidenflation at 17.0% erodes Americans’ purchasing power
- Annualized Bidenflation hits 6.2%, nearly double the CPI
- Sharp rise in food prices, little improvement in core prices
- Real wages not keeping up
- U.S. economy grapples with stagflation
The dark reality of Bidenomics is 17.0% inflation under President Biden’s watch. When he took office, inflation was at just 1.4%. Biden’s policies are a complete and utter failure that has led to stagflation in the United States.
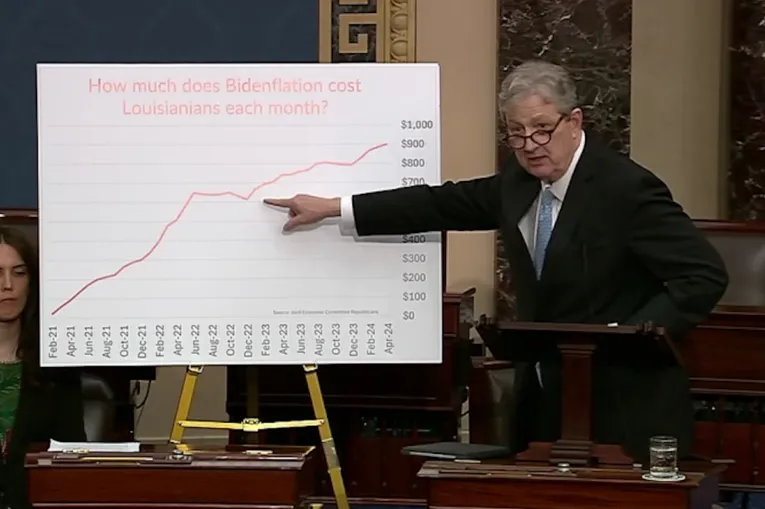
Inflation is a tax on citizens, forcing them to spend $709 a month more than they did two years ago. Inflation has stayed above the Federal Reserve's 2% target for 32 consecutive months.
According to the Labor Department, average hourly earnings for all employees dropped 3.32% to $11.05 in October from $11.43 in January 2021 when Biden assumed office. Despite nominal salary increases at their fastest pace in years, American workers are now worse off than two years ago.
CPI Report
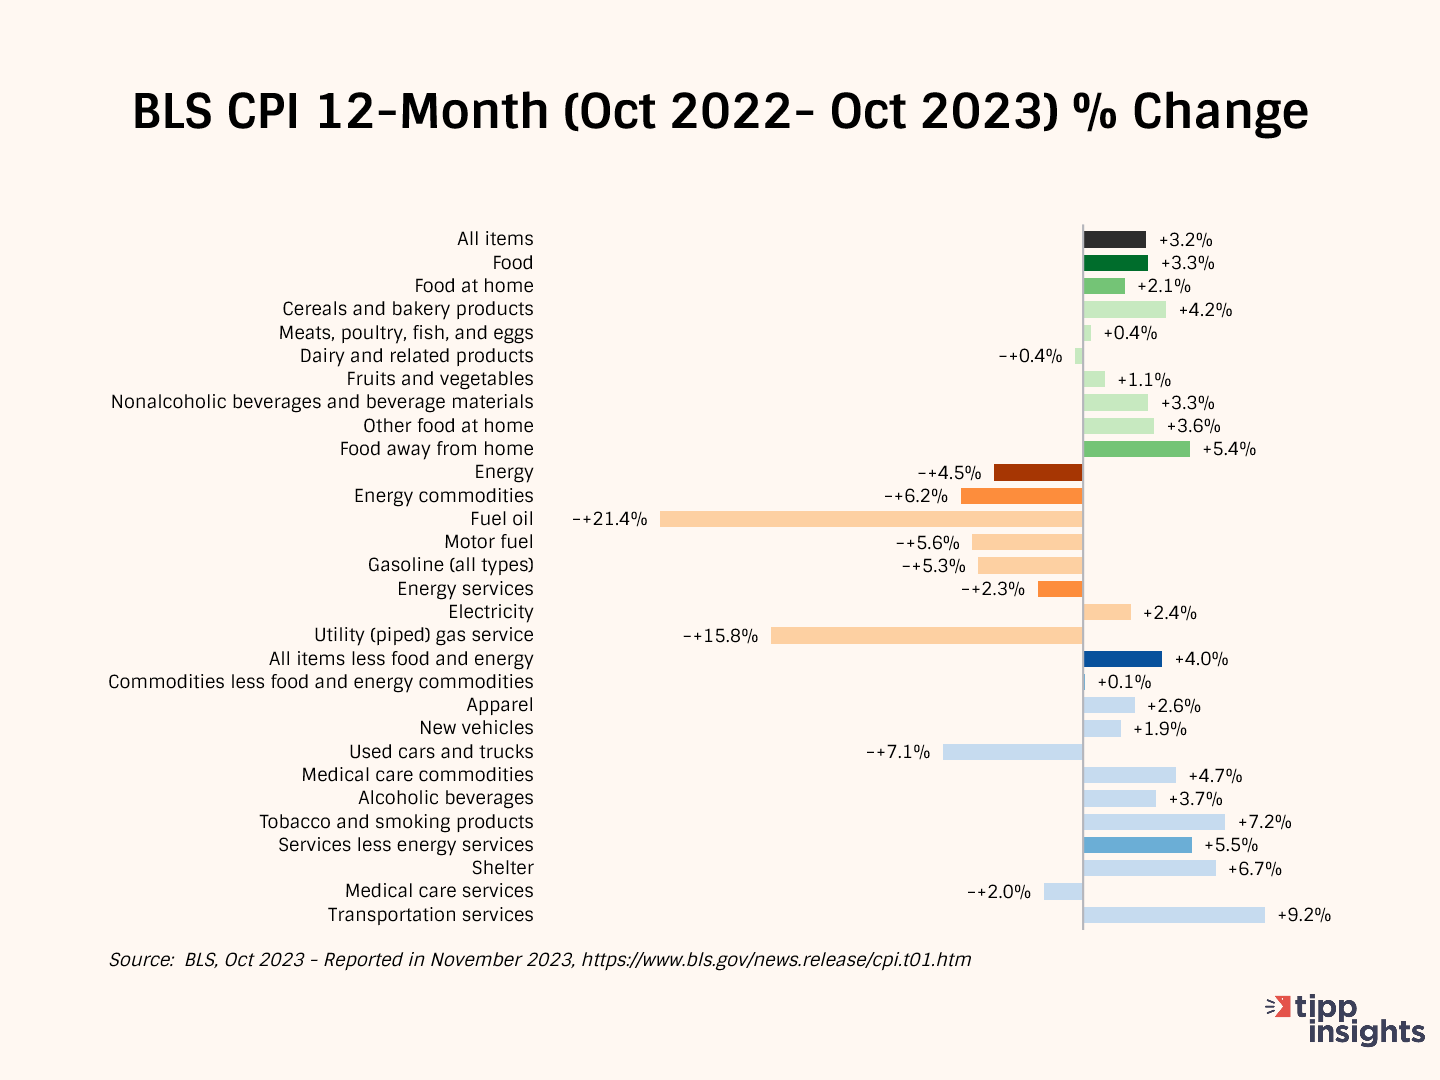
The Consumer Price Index (CPI) released by the government on Tuesday showed a 3.2% year-over-year price increase from October 2022 to October 2023.
The CPI rate had declined steadily from a 40-year high of 9.1% in June 2022 to 3.0% in June 2023 for 12 consecutive months. In July, it broke that run and increased to 3.2%, and further increased for the second month in August to 3.7% and remained at 3.7% in September. In October, it returned to 3.2%.
The CPI remained unchanged (0.0%) between September 2023 and October 2023 after adjusting for seasonality and increased by 0.18% on an unadjusted basis. In the same period, Food prices rose by 0.3%, Energy prices declined by 2.5%, and All items except food and energy (Core) increased by 0.2%
Wall Street celebrated the CPI report, anticipating a Fed pause in rate hikes. Some economists predict we might avoid a recession, believing this time it is different. According to the Wall Street Journal, if true, it would be the first time the Fed tamed significant inflation without triggering a recession in 80 years.
Unlike these economists, we belong to the 'curmudgeon camp,' where we believe indicators such as weak tax revenue, an inverted yield curve, and a contracting manufacturing sector point to a slowing economy. Public opinion aligns with our perspective. For instance, the November TIPP Poll revealed that most Americans view the economy negatively. More than half (54%) believe we are in a recession, and seven out of ten (70%) feel the economy is not improving. Perception is reality.
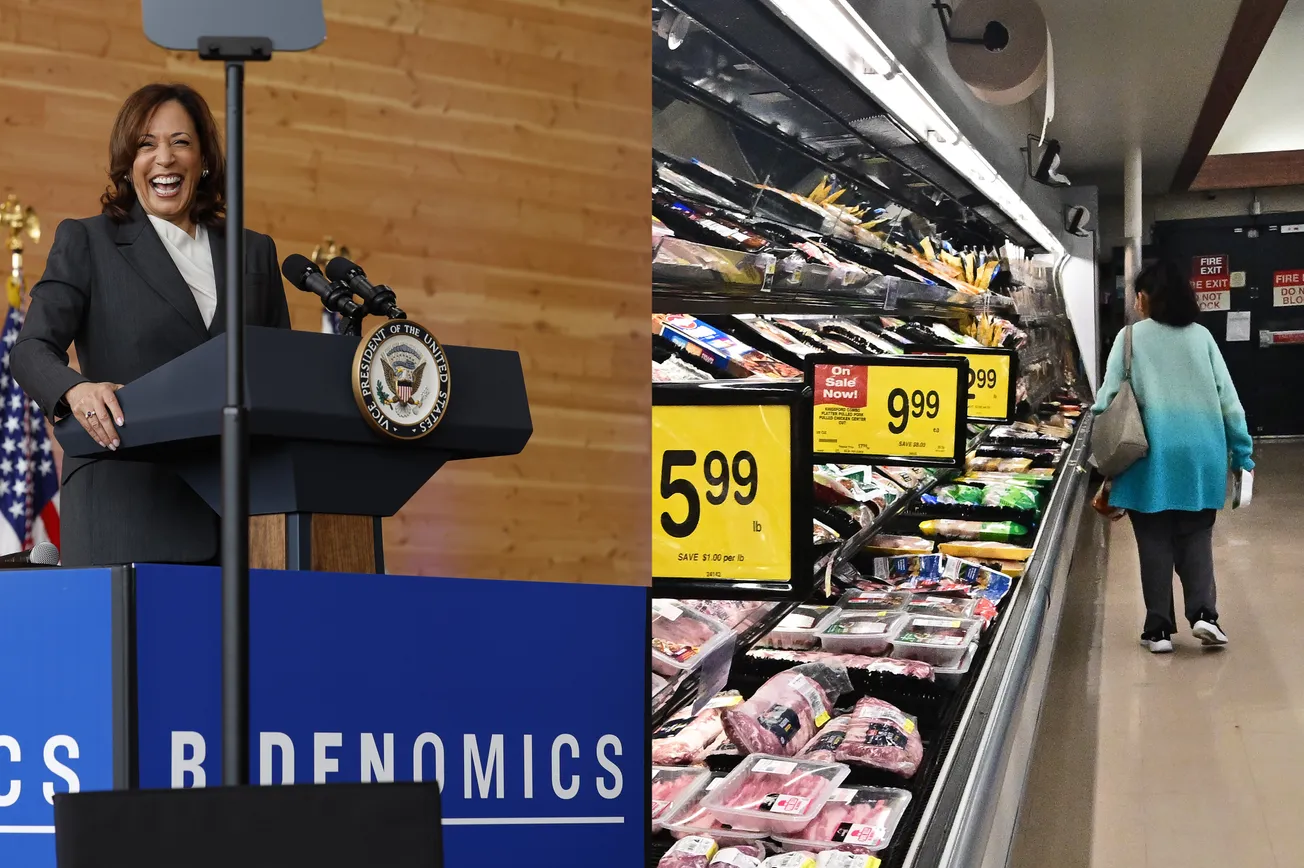
President Biden took a victory lap for Bidenomics:
Today we saw more progress bringing down inflation while maintaining one of the strongest job markets in history. At 3.2%, annual inflation is now down by 65% from the peak. Gas prices are below $3.40 per gallon, reflecting an average decline of $1.65 from the peak after Putin’s invasion of Ukraine. Inflation has come down while the unemployment rate has been below 4% for 21 months in a row—the longest stretch in more than 50 years—while wages, wealth, and the share of working-age Americans with jobs are all higher now than before the pandemic.
President Biden, like his media allies, is known for his skill in selectively presenting only positive news and ignoring any negative news.
But we’ll deliver to you their omissions.
First, food prices rose 0.3% between September and October 2023. The average increase over the past 12 months is 0.26%, and the past three months is 0.23%.
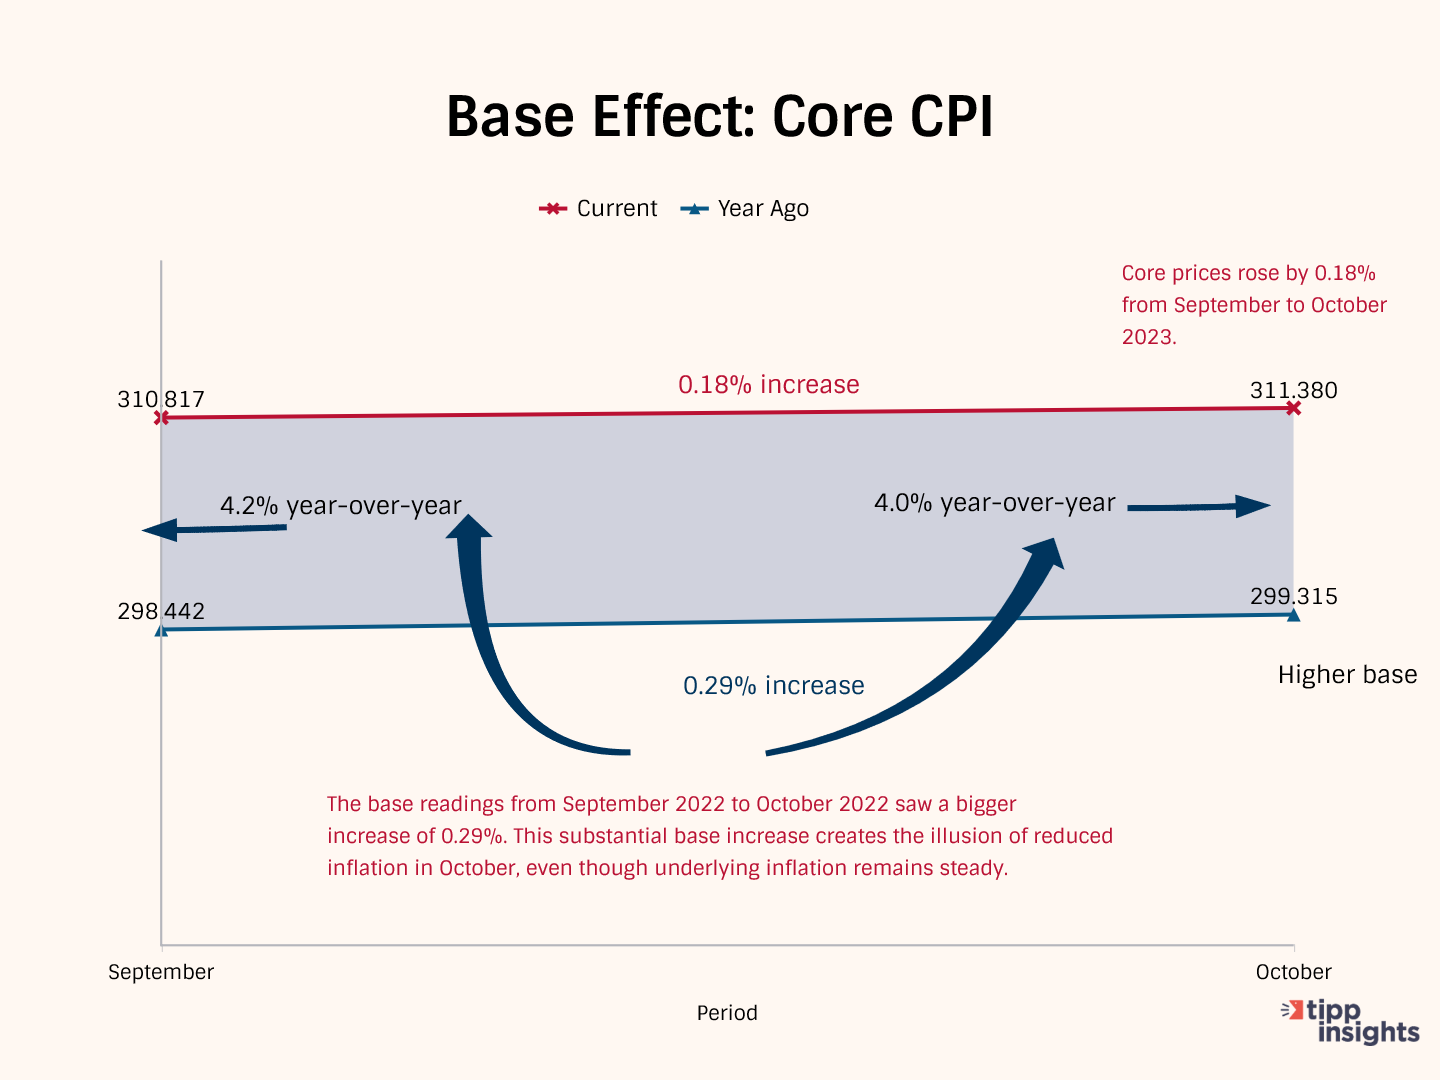
Core prices (all items less food and energy) materially did not improve. See the chart below. Core prices rose by 0.18% from September to October 2023. The base readings from September 2022 to October 2022 saw a bigger increase of 0.29%. This substantial base increase creates the illusion of reduced inflation in October, even though underlying inflation remains steady.
While it is true that the unemployment rate has been low, real wages are not growing in pace with inflation.
TIPP CPI
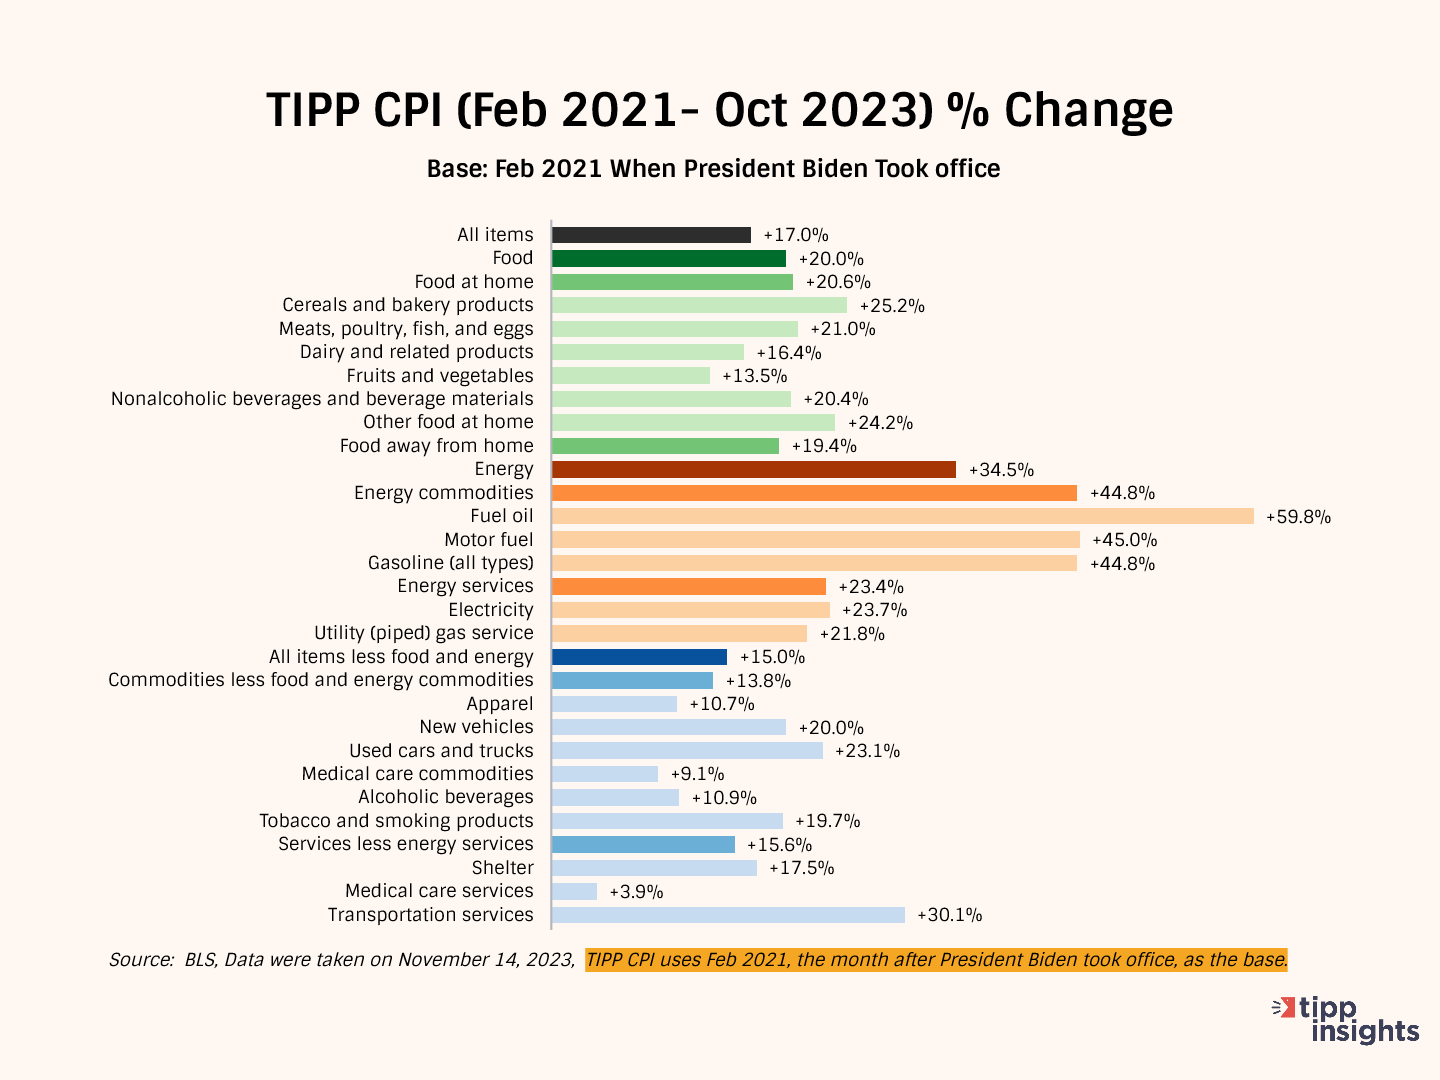
We developed the TIPP CPI, a metric that uses February 2021, the month after President Biden's inauguration, as its base. All TIPP CPI measures are anchored to the base month of February 2021, making it exclusive to the economy under President Biden's watch.
We use the relevant data from the Bureau of Labor Statistics (BLS) to calculate the TIPP CPI, but we adjust the period to Biden's tenure. CPIs are like index numbers that show how prices affect people's lives, similar to how the Dow Jones Industrial Average reflects the stock market.
When discussing the TIPP CPI and the BLS CPI, we convert the index numbers into percentage changes to better understand and compare them.
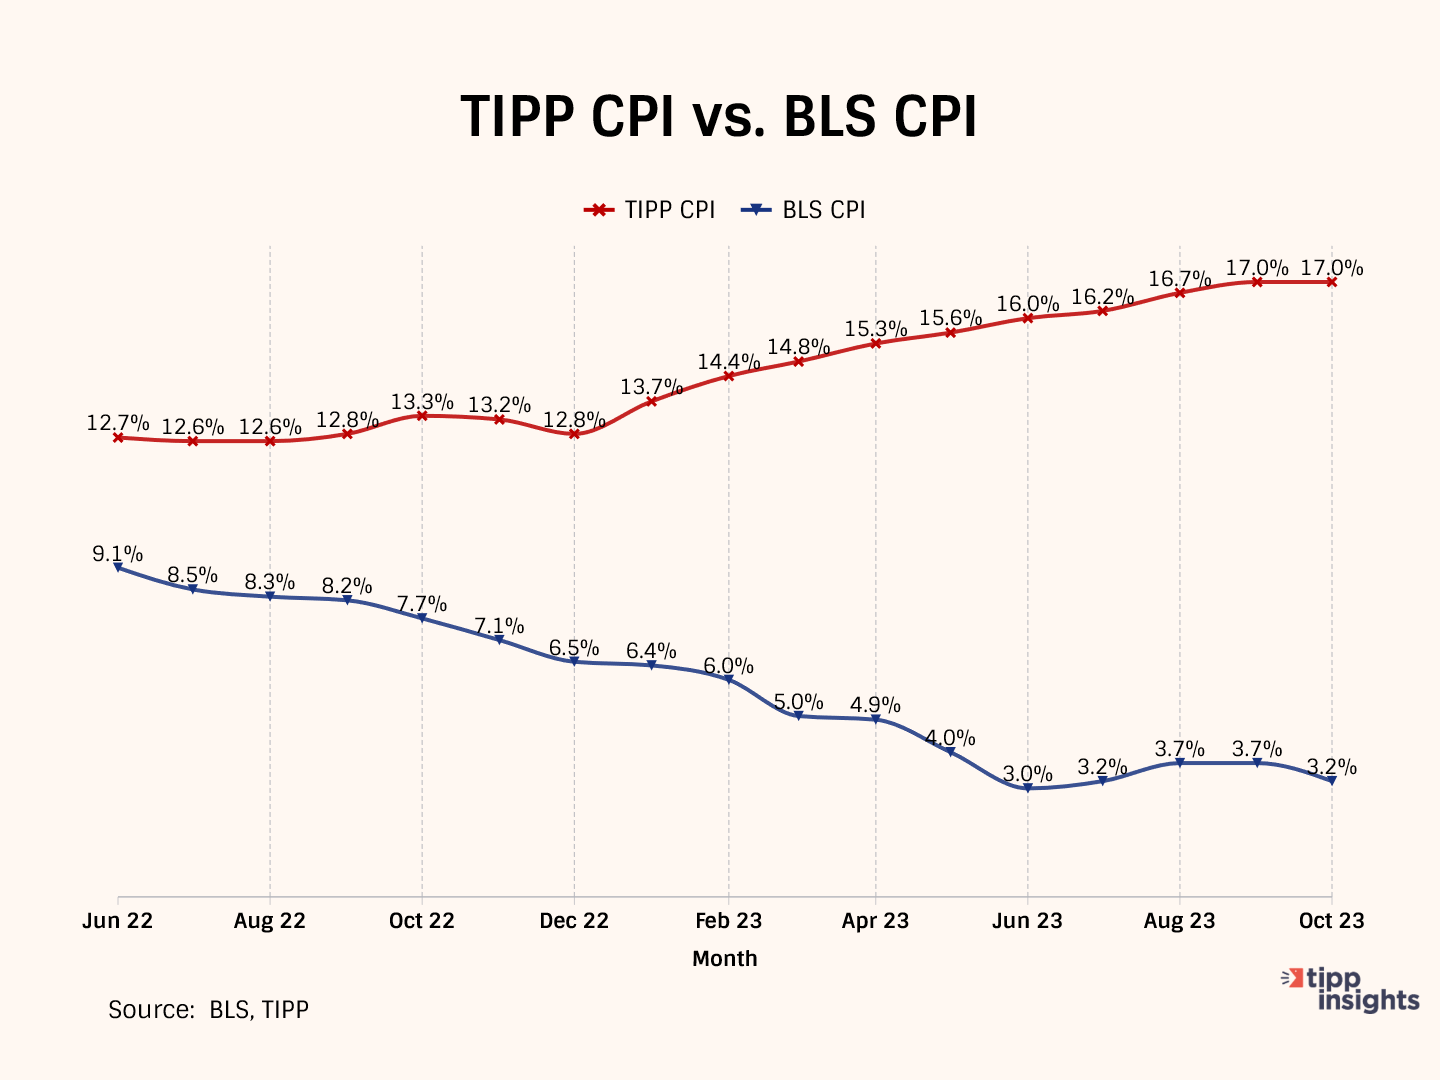
Bidenflation, measured by the TIPP CPI using the same underlying data, stayed steady at 17% in October. It was 17.0% in September, 16.7% in August, and 16.2% in July.
By the middle of 2022, significant inflation had already taken hold. In October 2022, CPI inflation stood at 7.7 percent. As the official BLS CPI year-over-year increases will compare prices to already inflated bases in the coming months, these statistics might mask the full impact.
TIPP CPI vs. BLS CPI
The following four charts present details about the new metric.
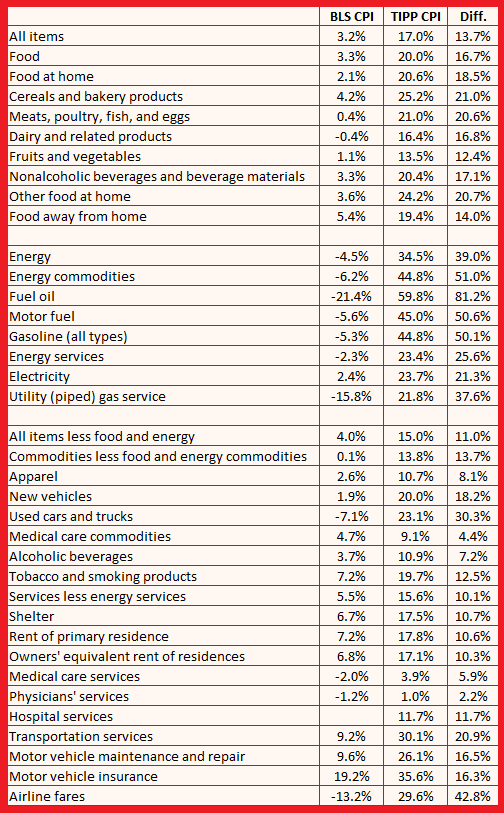
The annual CPI increase reported by BLS is 3.2% for October 2023. Compare this to the TIPP CPI of 17.0%, a 13.7-point difference. Prices have increased by 17.0% since President Biden took office. On an annualized basis, TIPP CPI is 6.2%.
Food prices increased by 20.0% under Biden compared to only 3.3% as per BLS CPI, a difference of 16.7 points.
TIPP CPI data show that Energy prices increased by 34.5%. But, according to the BLS CPI, energy prices improved by 4.5%. The difference between the two is a whopping 39.0 points.
The Core CPI is the price increase for all items, excluding food and energy. The Core TIPP CPI was 15.0% compared to 4.0% BLS CPI in the year-over-year measure, an 11.0-point difference.
Further, Gasoline prices have increased by 44.8% since President Biden took office, whereas the BLS CPI shows that gasoline price has improved by 5.3%, a difference of 50.1 points.
TIPP CPI finds that Used car prices have risen by 23.1% during President Biden's term. Meanwhile, the BLS CPI reports that the prices have dropped 7.1%, a difference of 30.3 points.
Inflation for air tickets under President Biden is 29.6% compared to the BLS CPI’s finding of an improvement of 13.2%, a difference of 42.8 points.
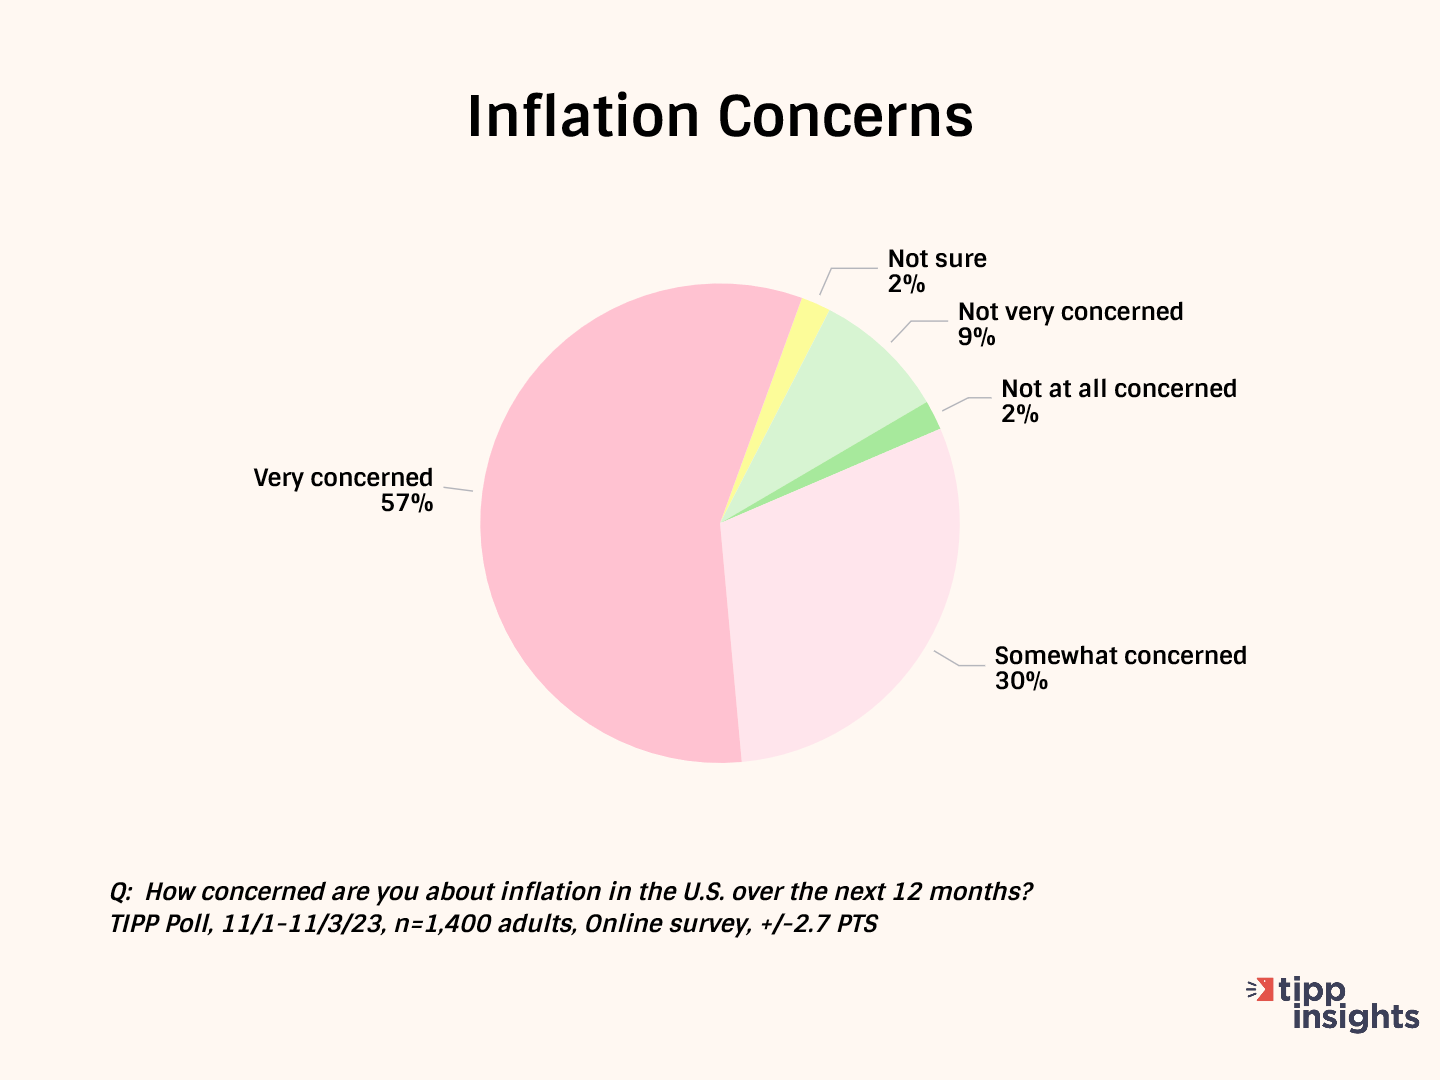
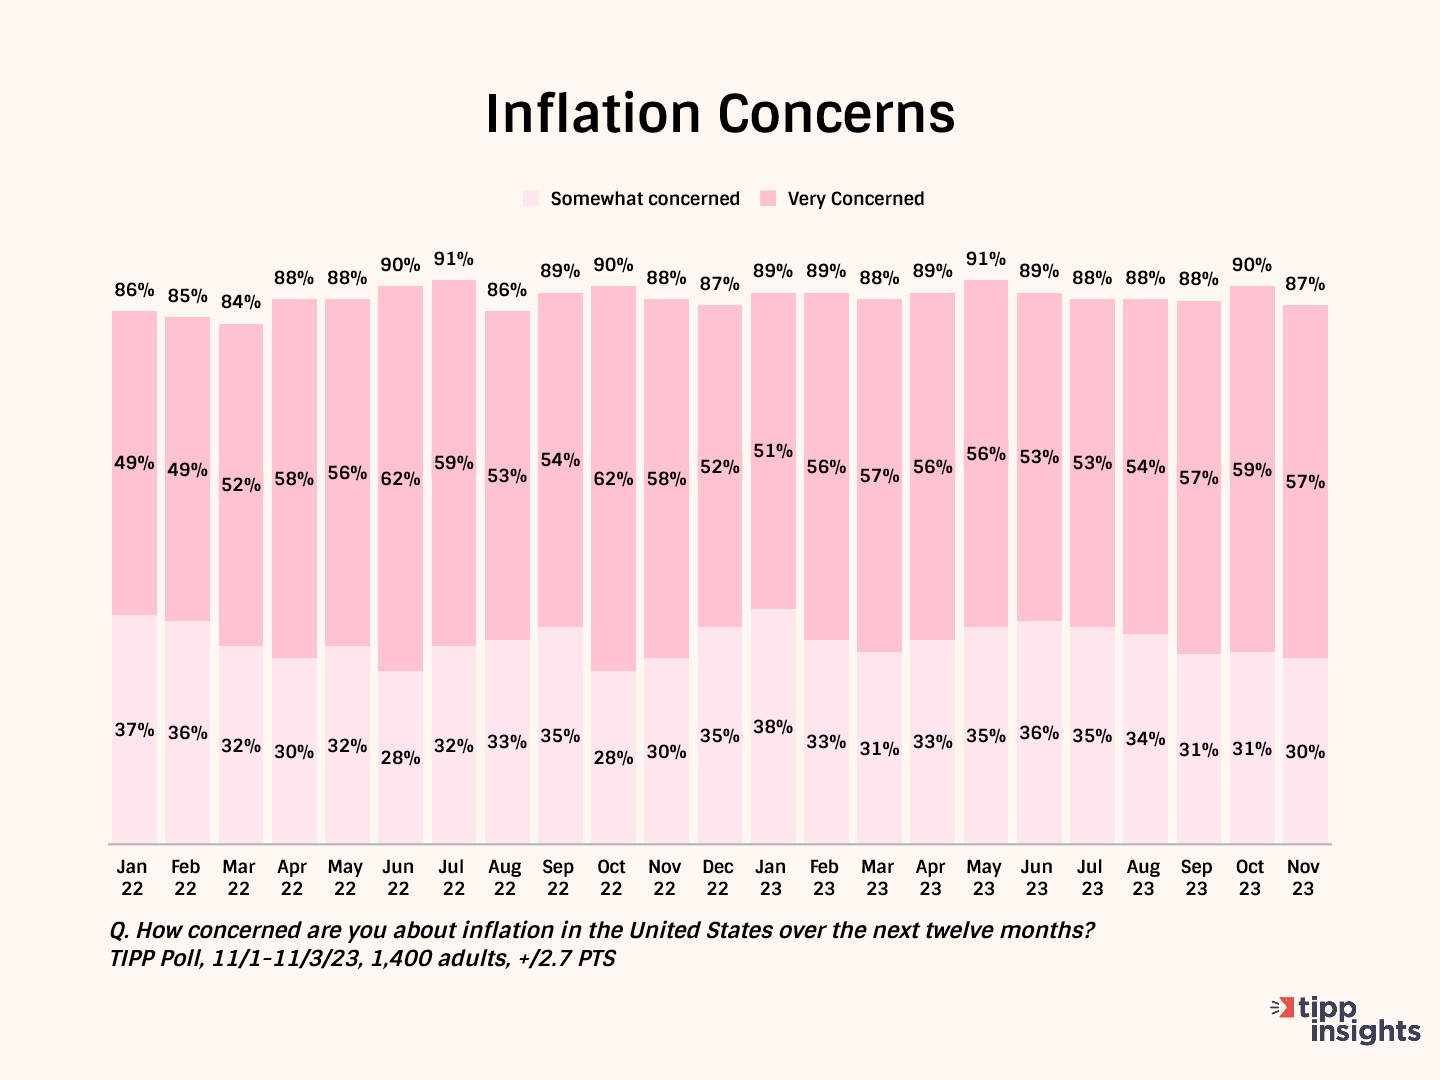
The latest TIPP Poll, completed earlier this month, shows nine in ten (87%) survey respondents are concerned about inflation. Since January 2022, inflation concerns have stayed above 85%. The "very concerned" share has been over 50% for twenty-one months.
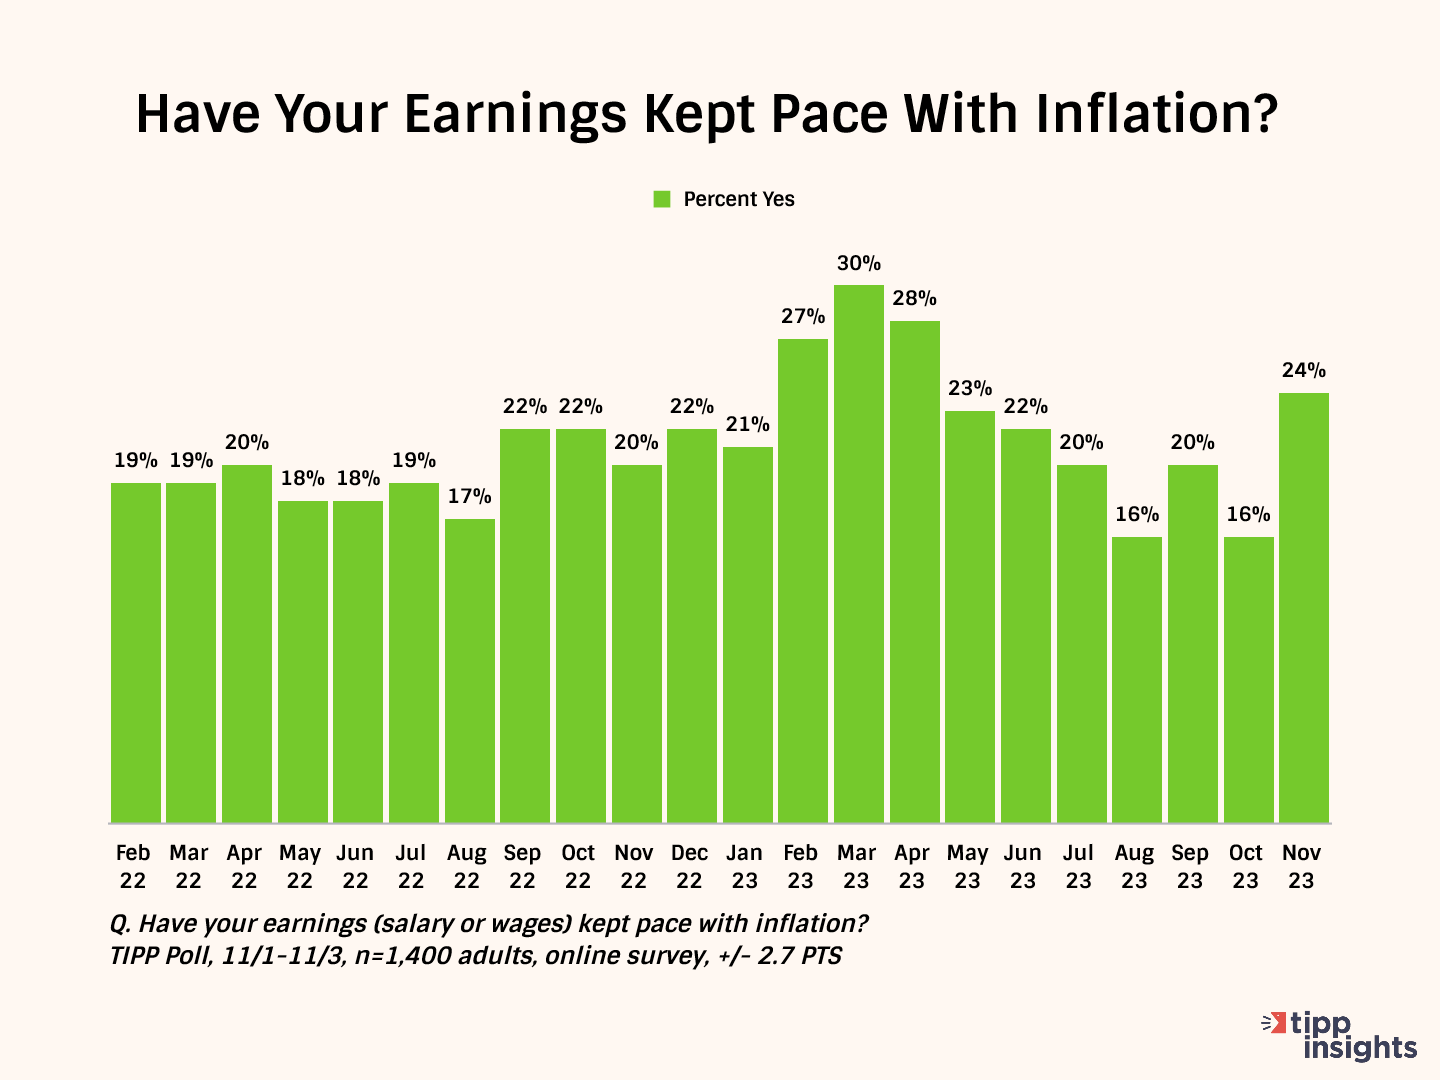
Over half (52%) say their wages have not kept up with inflation. Only 24% say their income has kept pace with inflation.
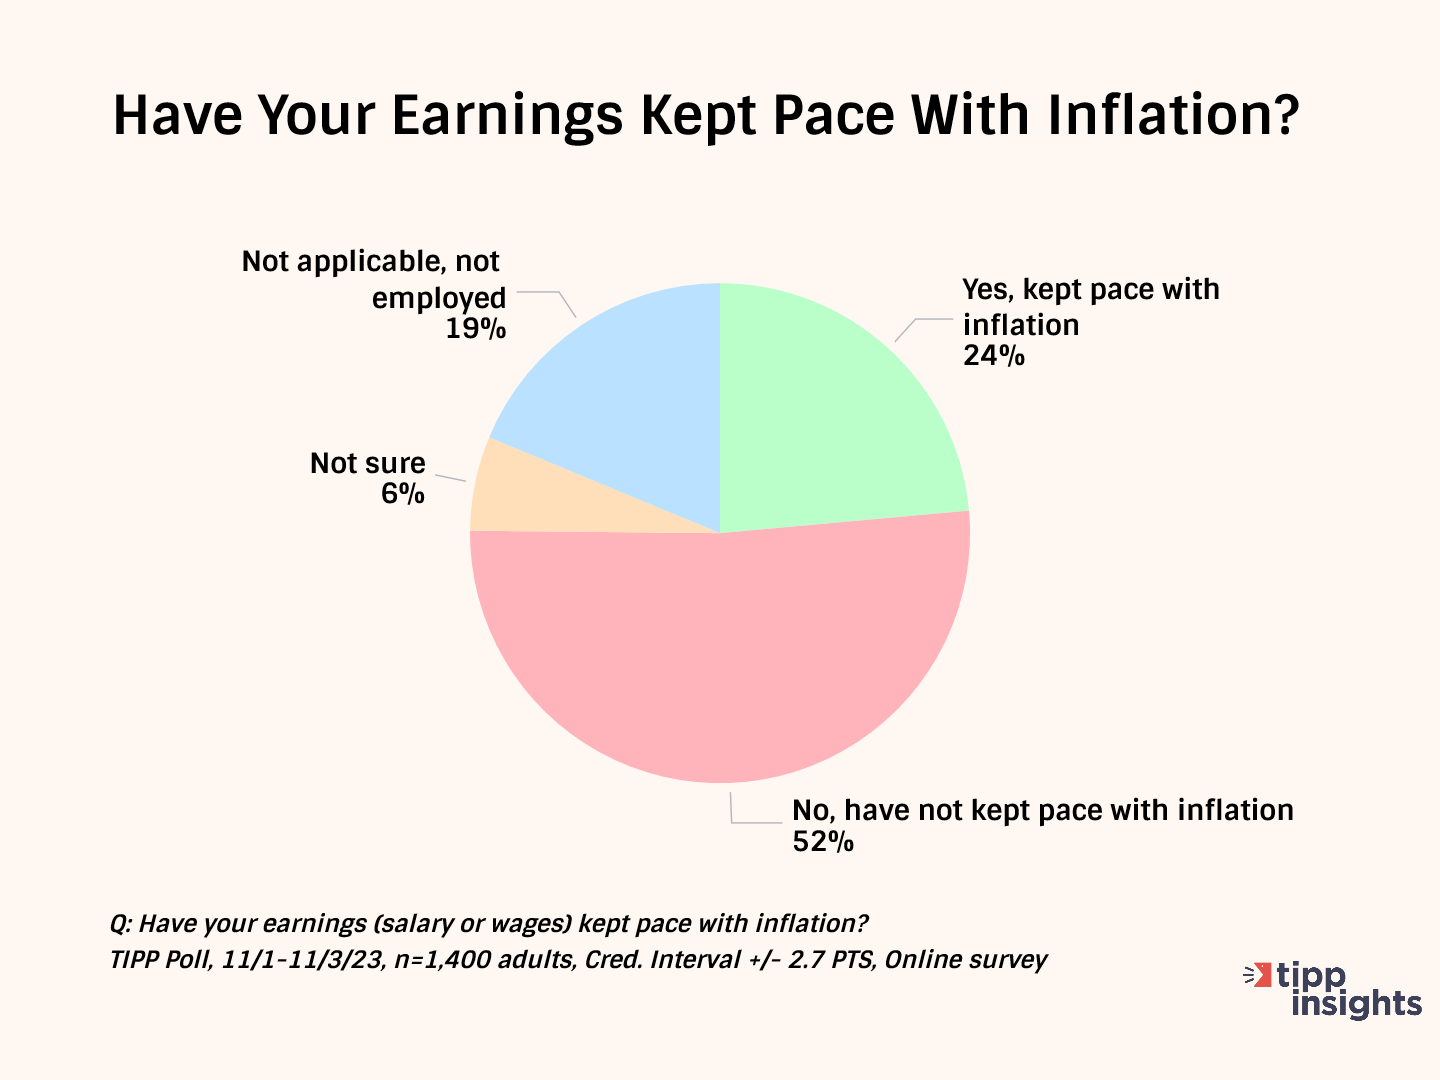
This statistic hovered in the low twenties for most of the last year. The positive change between January and March has petered out since May. Notice the steady descent from March 2023. It posted 16% in October after the September blip of 20%. In November, it jumped back to 24%
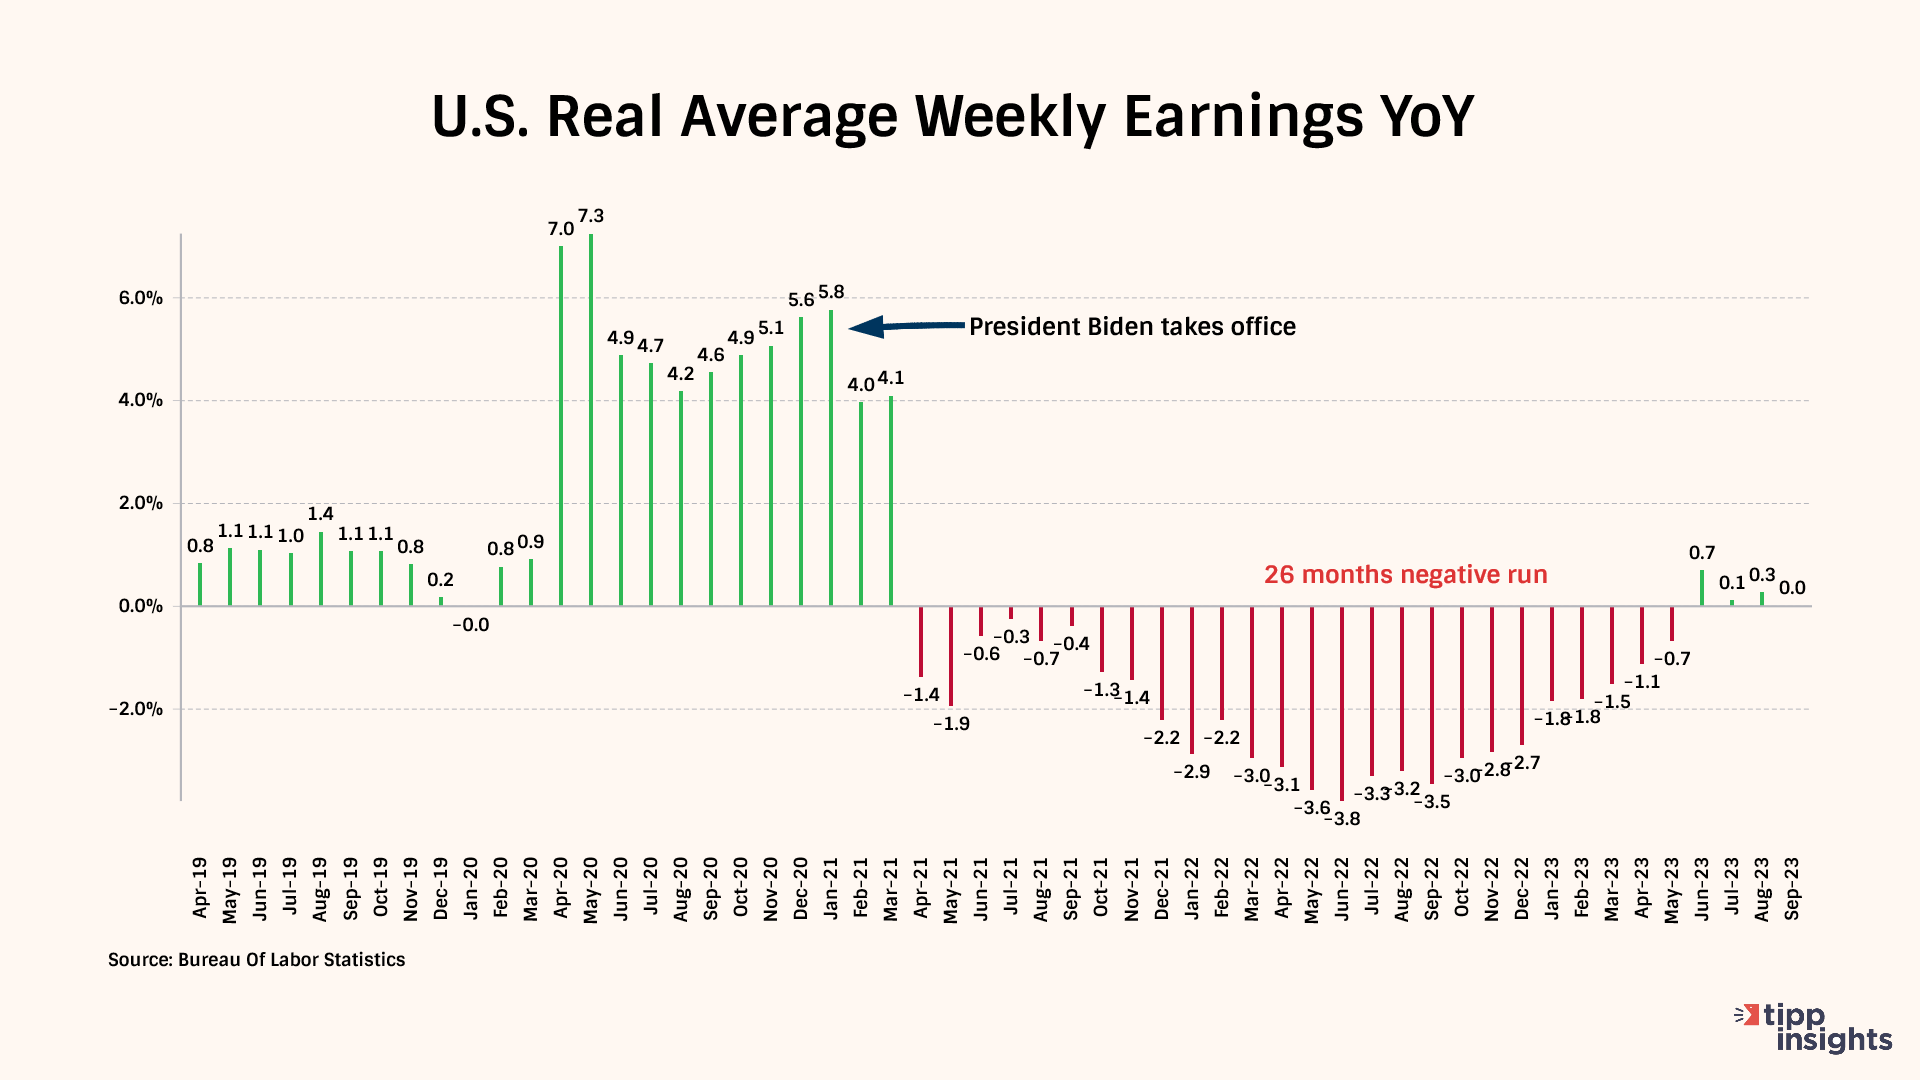
Nominal wages represent the amount of money one earns without considering changes in the cost of living. On the other hand, real wages consider inflation and measure the wages' purchasing power. Real wages provide a more accurate reflection of what is affordable with the income earned by factoring in the changes in the cost of living.
Real weekly wages measured year-over-year dropped for 26 of the 34 months of the Biden presidency. It broke the 26-month negative run in June and posted positive readings for three months. However, it is barely above zero in September.
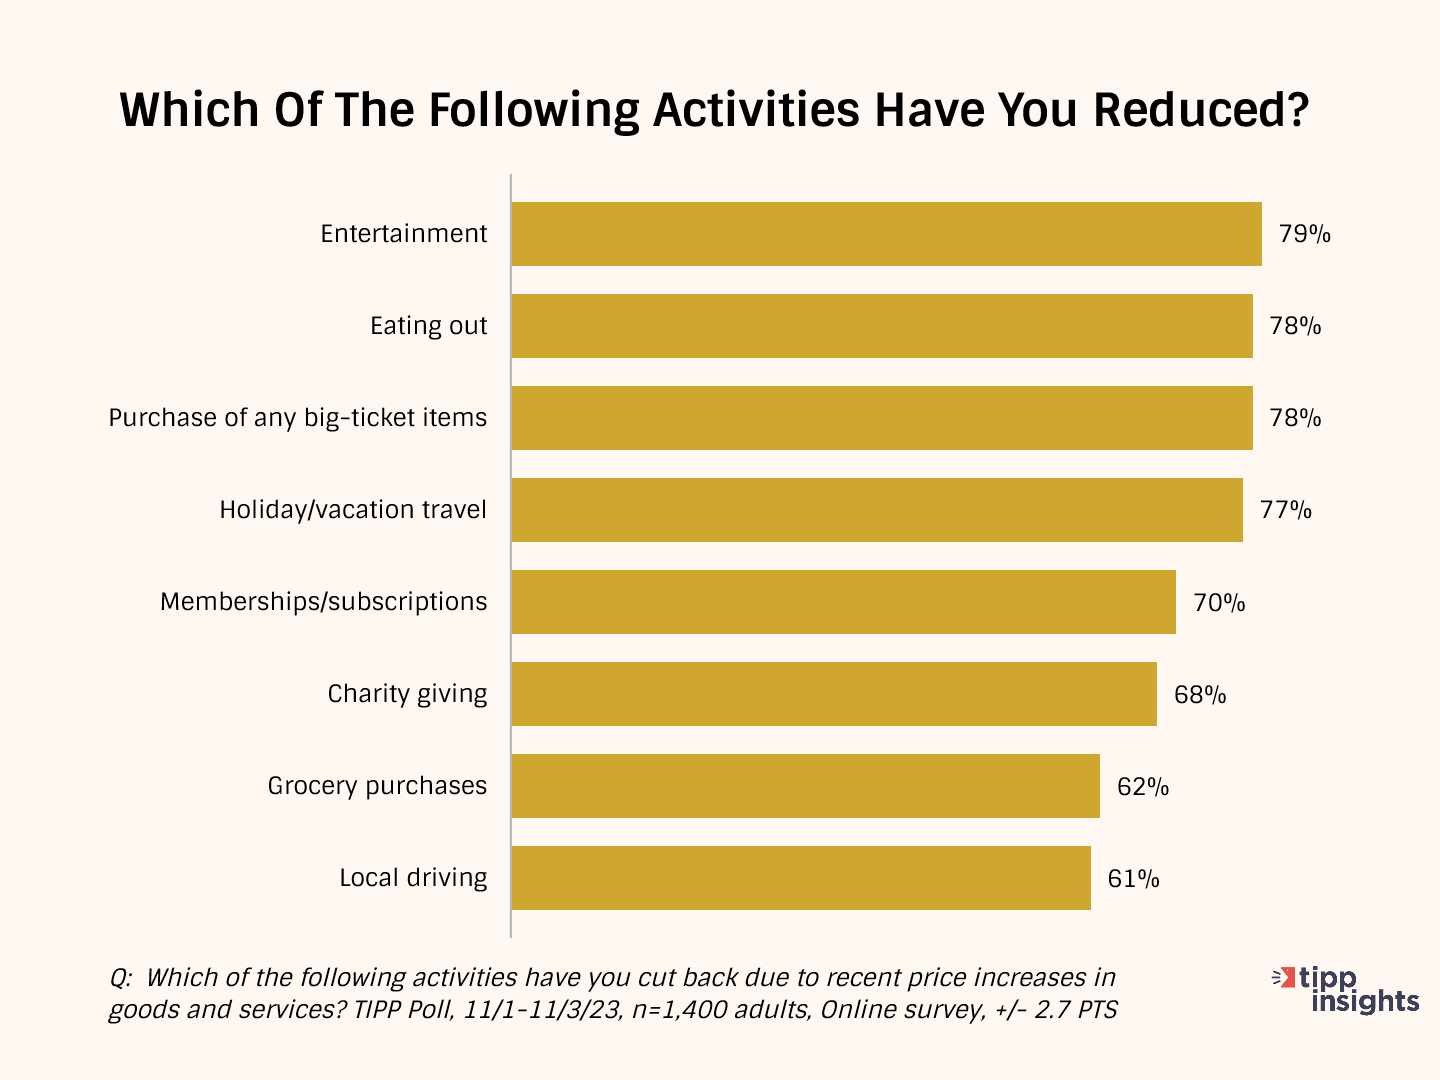
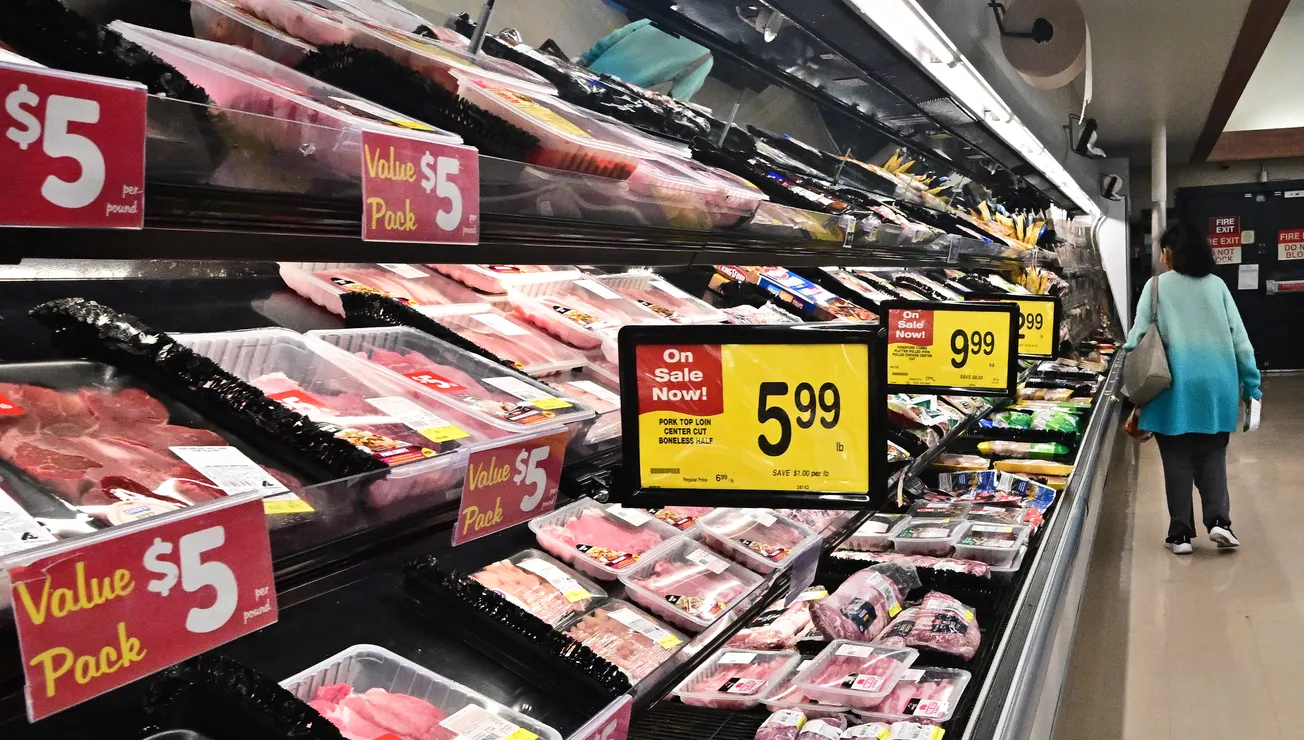
As a result of inflation, Americans are cutting back on household spending.
They are cutting back on entertainment (79%), eating out (78%), purchasing big-ticket items (78%), holiday/vacation travel (77%), and memberships/subscriptions (70%).
Many (68%) are cutting back on even good causes such as charity giving. Nearly two-thirds (62%) of households spend less on groceries. The high gasoline prices forced 61% to cut back on local driving.
Inflation Direction
The chart below compares the 12-month average of monthly changes against the 6-month and the 3-month averages. We also show the reading for October 2023.
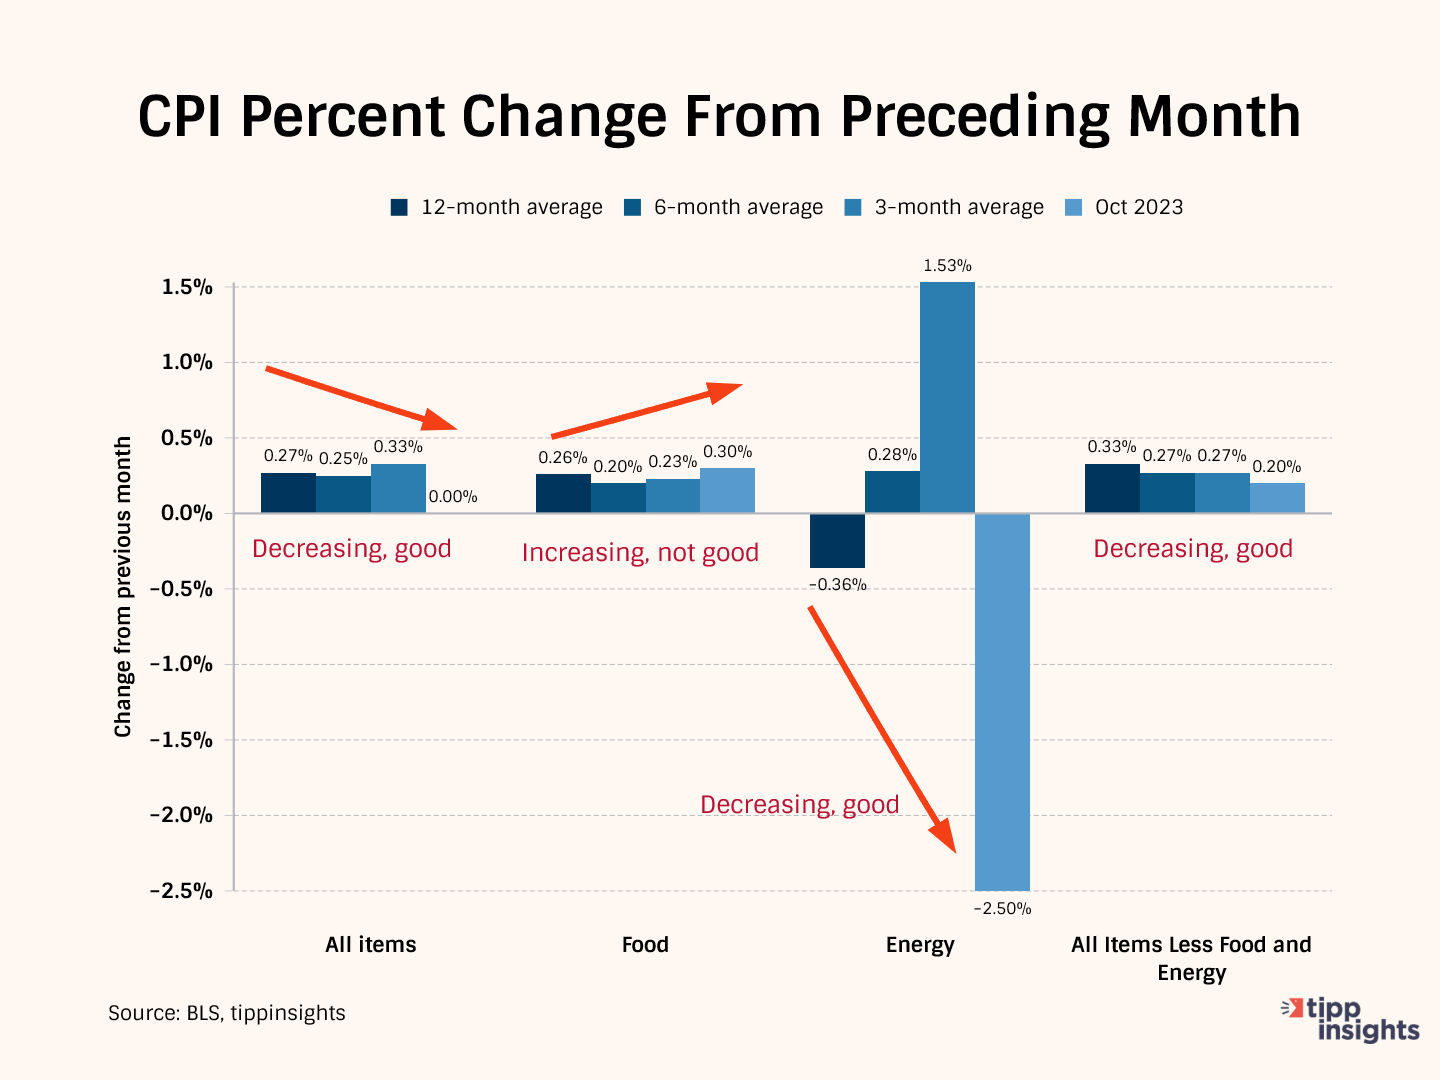
The 12-month average considers 12 data points and presents a long-term reference, while the six-month and three-month averages consider recent data points.
Typically, we compare the three-month average with the data from October 2023 to gain a clearer perspective. In October 2023, the price increase for All items was 0.0%, smaller than the three-month average of 0.33%. This shows a significant improvement in October.
Meanwhile, the three-month average of 0.33% is higher than the six-month average of 0.25%, indicating a recent acceleration in the rate of increase over the last three months.
Furthermore, the six-month average of 0.25% is lesser than the twelve-month average of 0.27%, an improvement in the trend over the last six months.
In conclusion, this pattern suggests that price increases have slowed down in October compared to the long term. Even though the ideal pattern is a downward-pointed staircase, we are happy to see the improvement.
In October, Food prices rose by 0.30%, exceeding the 3-month average of 0.23%, the 6-month average of 0.20%, and the 12-month average of 0.26%. This acceleration in October is disappointing.
Meanwhile, Energy prices decreased by 2.5%, less than the three-month moving average of 1.53%, indicating improvement. It also outperformed the 12-month average of -0.36% and the six-month average of 0.28%.
All items less food and energy, known as "core inflation," represents inflation after excluding the volatile food and energy components. In October, core inflation was 0.20%, lower than the three-month average of 0.27%, indicating improvement for the month.
Both the three-month and six-month averages remained at 0.27%, suggesting stable core inflation over these periods. However, the six-month average of 0.27% is lower than the 12-month average of 0.33%, suggesting improvement.
In summary, except for food prices, we see an overall improvement.
Monetary Policy
Since March 2022, the Fed has raised interest 11 consecutive times, bringing its benchmark interest rate to 5.25%, the highest level in 22 years. High interest rates are likely to slow down the economy further.
Each time the Federal Reserve increases interest rates to contain inflation, the U.S. government must pay more interest to service its ballooning debt. A rising debt-to-GDP ratio limits the ability to fund essential government services.
The national debt is touching $34 trillion while the interest rates are increasing, which is a big issue for the government because it relies on borrowed money to cover expenses.
For example, in October, the government had to pay $41 billion more in interest on the debt than the previous year, totaling $88.9 billion. The interest paid was higher than what they spent on national defense and even more than what the government spent on both Medicaid and Medicare health insurance programs combined.
The CPI report gave hope to many that the Fed is done with rate hikes. With core CPI above 4.0% and geopolitical tensions that could lead to volatility in oil supply, we are unsure of what is on the horizon. We also don’t subscribe to the “no recession” idea. One thing is certain – a sluggish economy lies ahead.
To access the TIPP CPI readings each month, you can visit tippinsights.com. We'll publish the TIPP CPI and our analysis in the days following the Bureau of Labor Statistics (BLS) report. The upcoming release of TIPP CPI is on December 13, 2023. We'll also post a spreadsheet in our store for download.
Hey, want to dig deeper? Download data from our store for a small fee!
Want to understand better? We recently wrote an explainer on inflation that sixth graders could understand. Everyone can benefit from it. Milton Friedman's Priceless Lessons On Inflation.
We could use your help. Support our independent journalism with your paid subscription to keep our mission going.


