
- "Bidenflation" stands at 16.7%, exposing a significant increase in prices since President Biden took office
- Real wages have declined under Biden's watch, forcing people to cut back on various expenditures
- The American economy is likely to experience a protracted period of stagflation, characterized by economic stagnation accompanied by high inflation
- "Bidenomics" is a failure, and Biden's misdirected energy policy is the root cause of these issues
More than six out of every ten (61%) Americans live paycheck to paycheck.
American credit card debt has surged by 38%, increasing from $743.5 billion in the first quarter of 2021 to a recent total of $1.031 trillion.
You may wonder why.
Look nowhere else than Bidenomics.
Americans are grappling with soaring prices. These days, it takes $1,000 in earnings to buy what $857 could purchase when Biden took office. And the earnings have not kept up with inflation.
How do Americans address the shortfall?
Take on two jobs, reduce expenses, skip meals, use credit cards, or dip into retirement savings. There's evidence that all these strategies are employed in Biden's America.
The dark shadow of Bidenomics is 16.7% inflation under Biden’s watch. His policies are a complete and utter failure that has led to stagflation in the United States. No amount of sugarcoating can hide the truth.
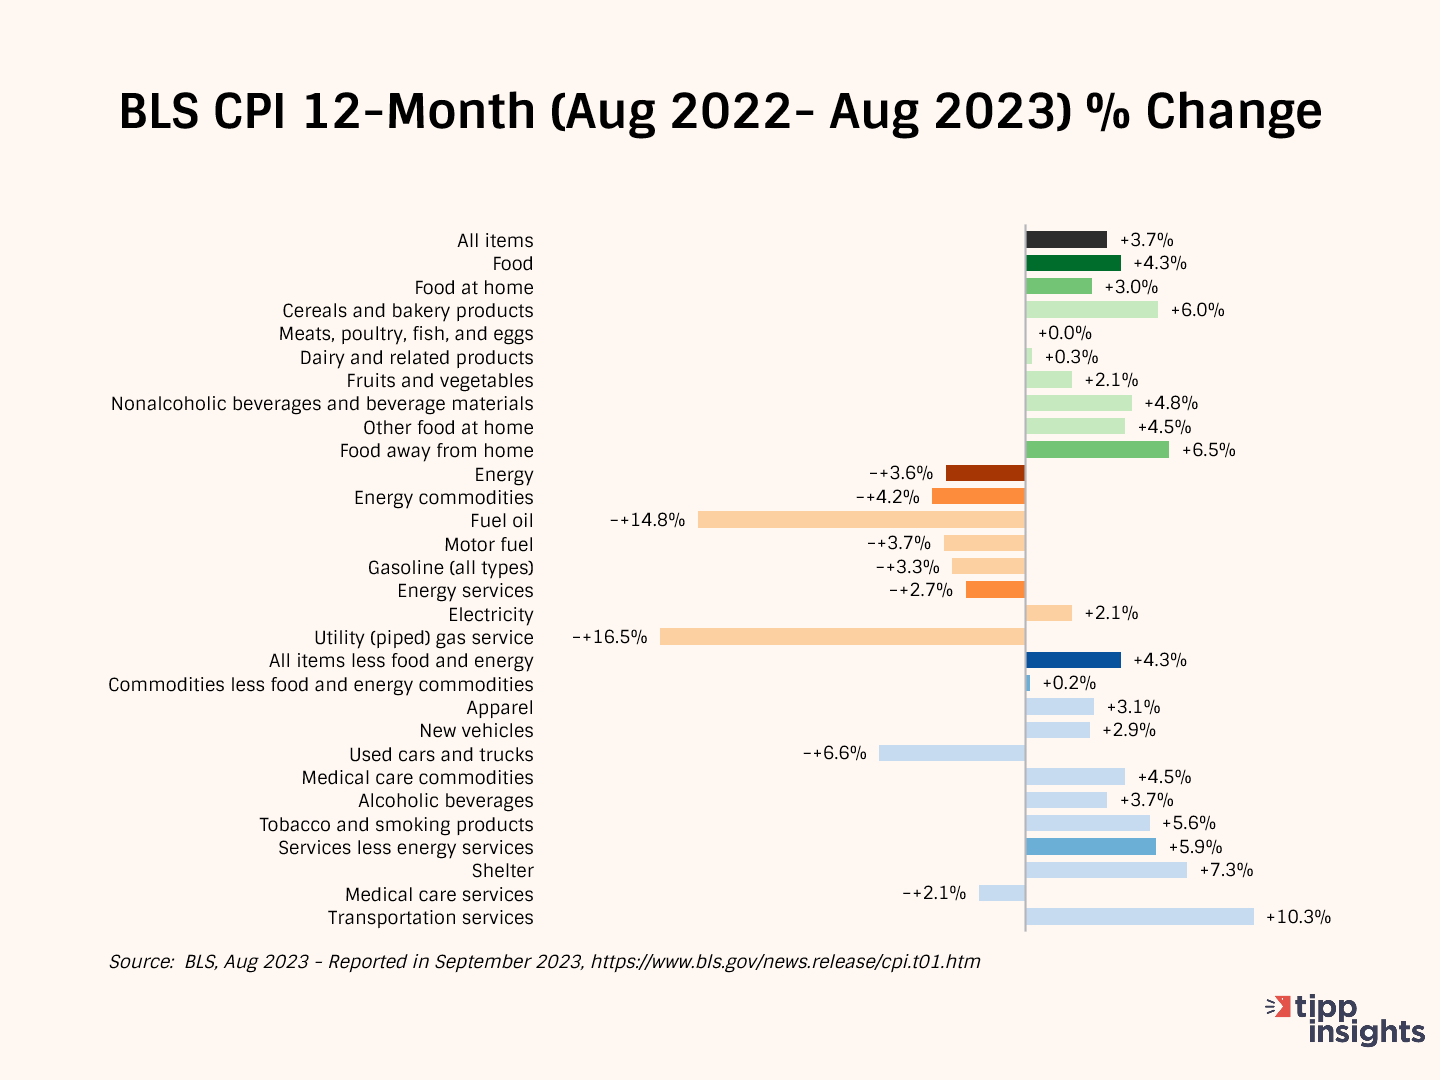
The Consumer Price Index (CPI) released by the government on Wednesday showed a 3.7% year-over-year increase in prices from August 2022 to August 2023.
The CPI rate had declined steadily from a 40-year high of 9.1% in June 2022 to 3.0% in June 2023 for 12 consecutive months. In July, it broke that run and increased to 3.2%, and further increased for the second month in August to 3.7%.
The CPI rose 0.6% between July 2023 and August 2023 after adjusting for seasonality and slightly less at 0.4% on an unadjusted basis. In the same period, Food rose by 0.2%, Energy by 5.6%, and All items except food and energy (Core) by 0.3%.
President Biden’s statement opened on a positive note:
Today’s report provides more evidence that core inflation is trending down toward pre-pandemic levels at a time when employment remains strong.
That was only partially correct for three reasons:
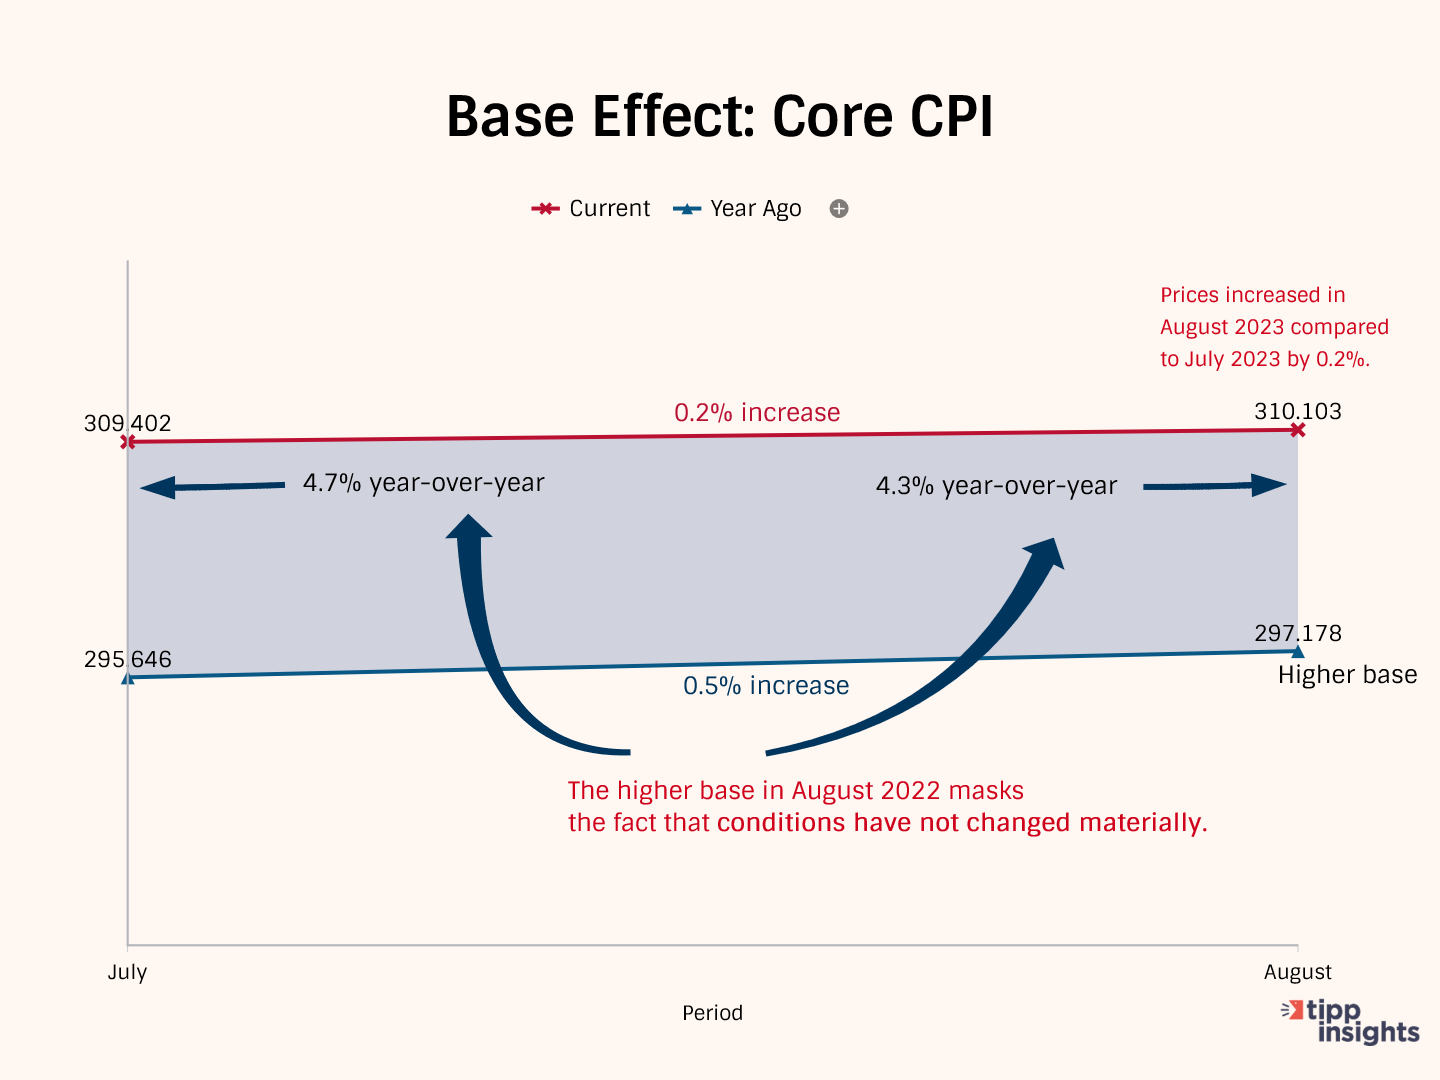
- Core inflation rate increased by 0.3% between July 2023 and August 2023. The increase was bigger than 0.2% between June and July this year.
- The August core increase of 0.3% is higher than the 3-month average of 0.23%, indicating an acceleration.
- Even though the year-over-year core dropped from 4.7% to 4.3%, it was due to the base effect, as seen in the chart below. Realistically, there is no significant change in conditions for President Biden to take solace in.
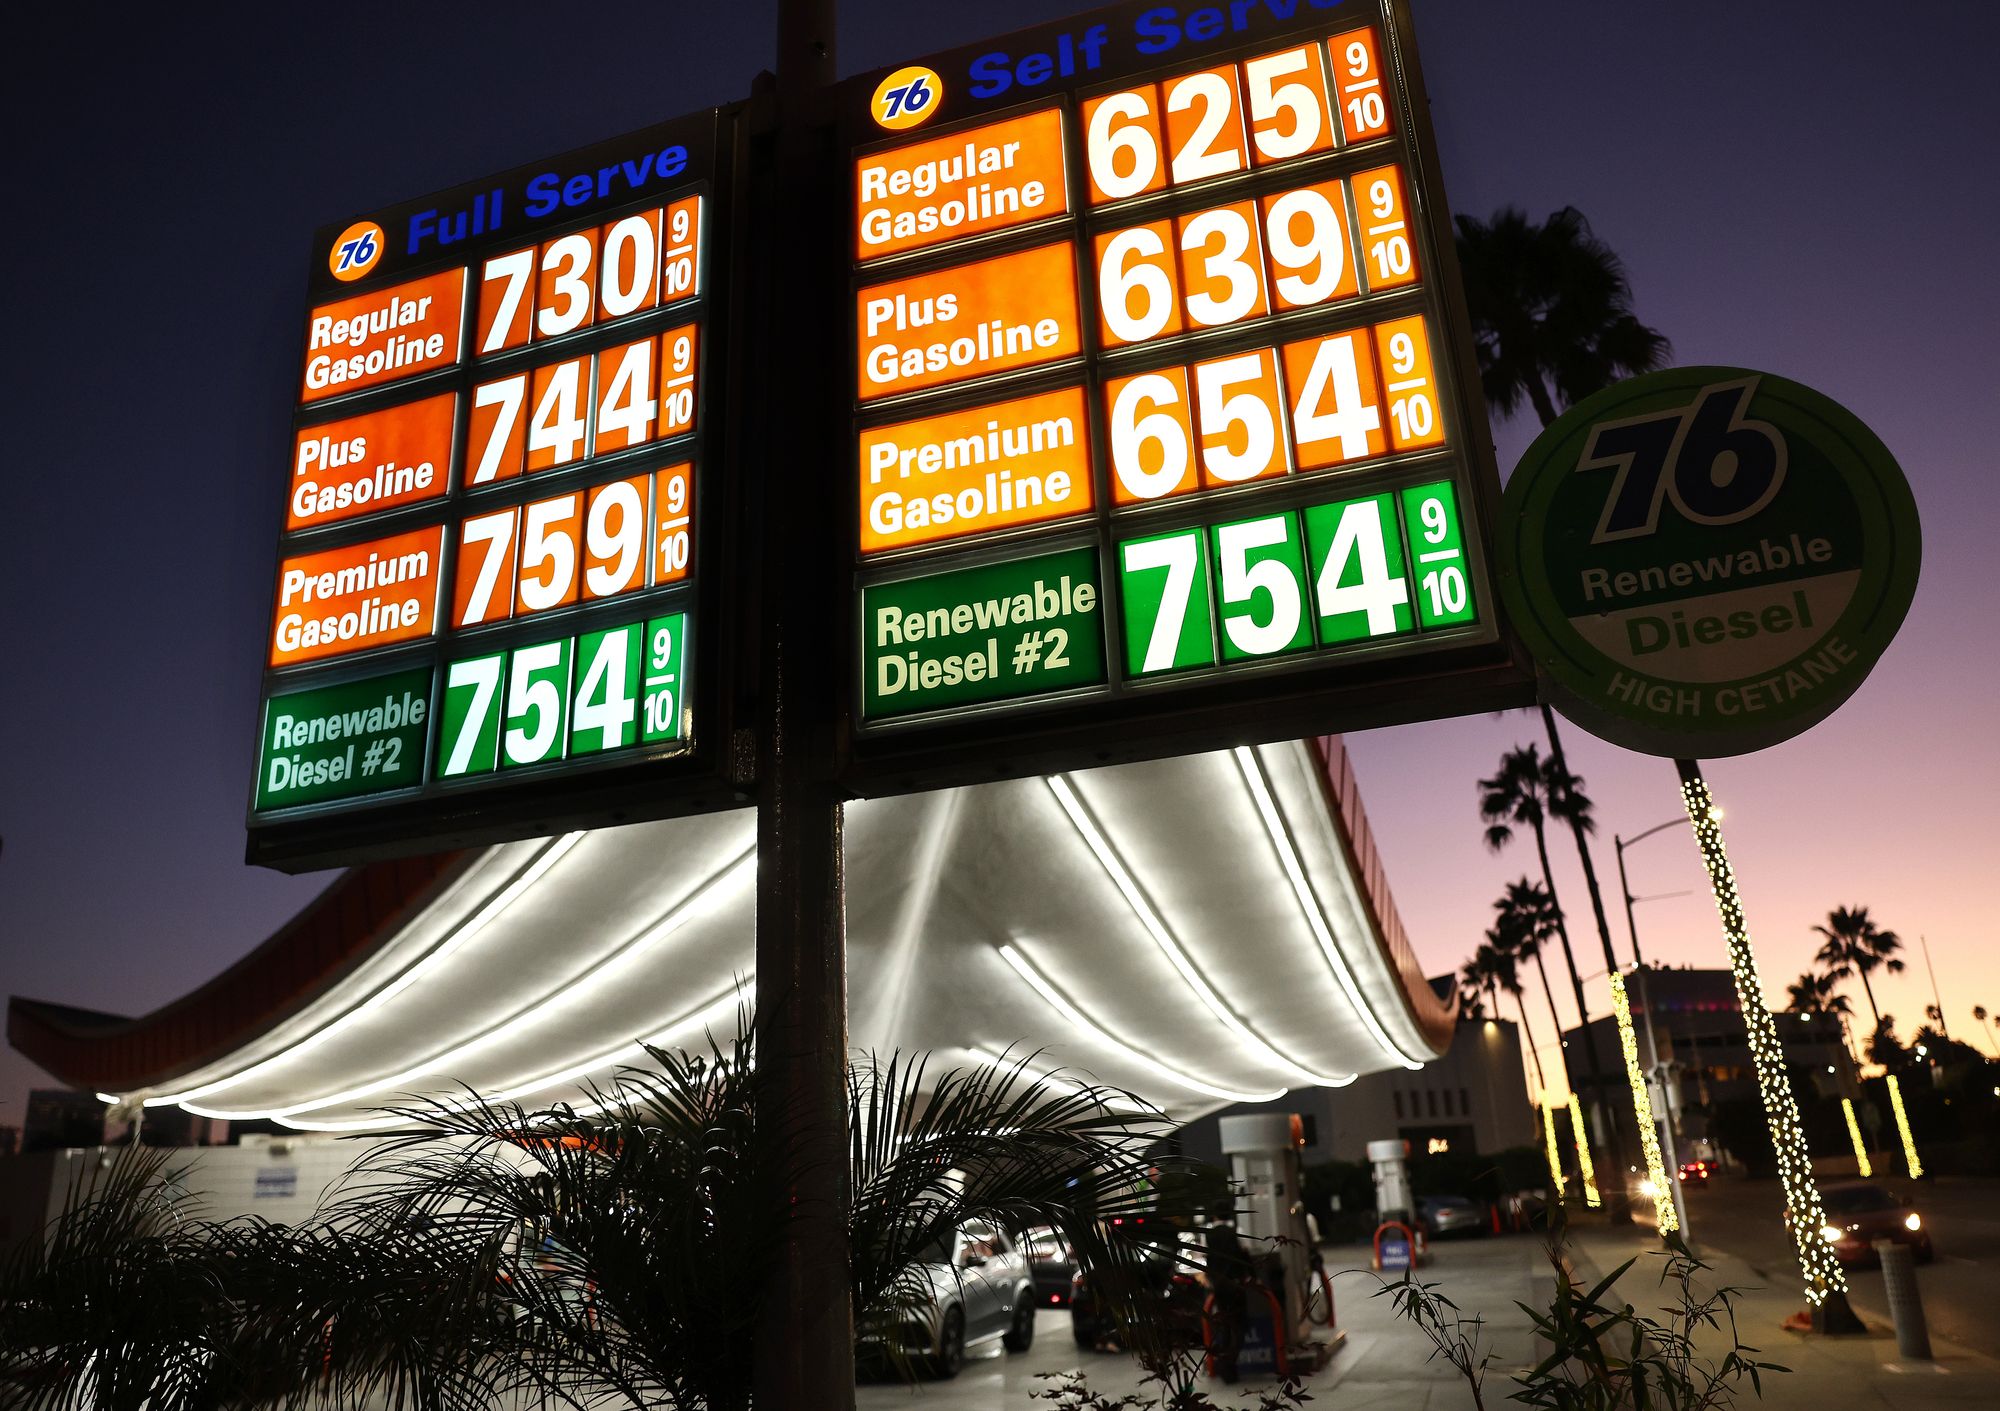
President Biden’s statement acknowledged recent gasoline price increases:
Overall inflation has also fallen substantially over the last year, but I know last month’s increase in gas prices put a strain on family budgets. That’s why I remain laser-focused on cutting energy costs, including by investing in clean energy to bolster our energy security.
President Biden’s energy policies are inflicting great pain on Americans. He deliberately pursued policies pushing the U.S. from energy independence to dependence. Our energy dependence enriches Russia’s war chest. Meanwhile, we depleted our strategic petroleum reserve (SPR) to gain an advantage in the midterms, potentially compromising our national security.
The Biden economy continues to be the worst-performing going back to President Carter. Since February 2021, the first full month of President Biden's term, the prices of various commodities, including food, gasoline, used cars, and air tickets, have consistently increased. Although the rate of increase has slowed, prices are still rising monthly.
As we have noted numerous times, President Biden's reckless spending has resulted in inflation levels not seen in 40 years. The U.S. economy will experience an extended period of stagflation characterized by stagnation accompanied by inflation.
TIPP CPI
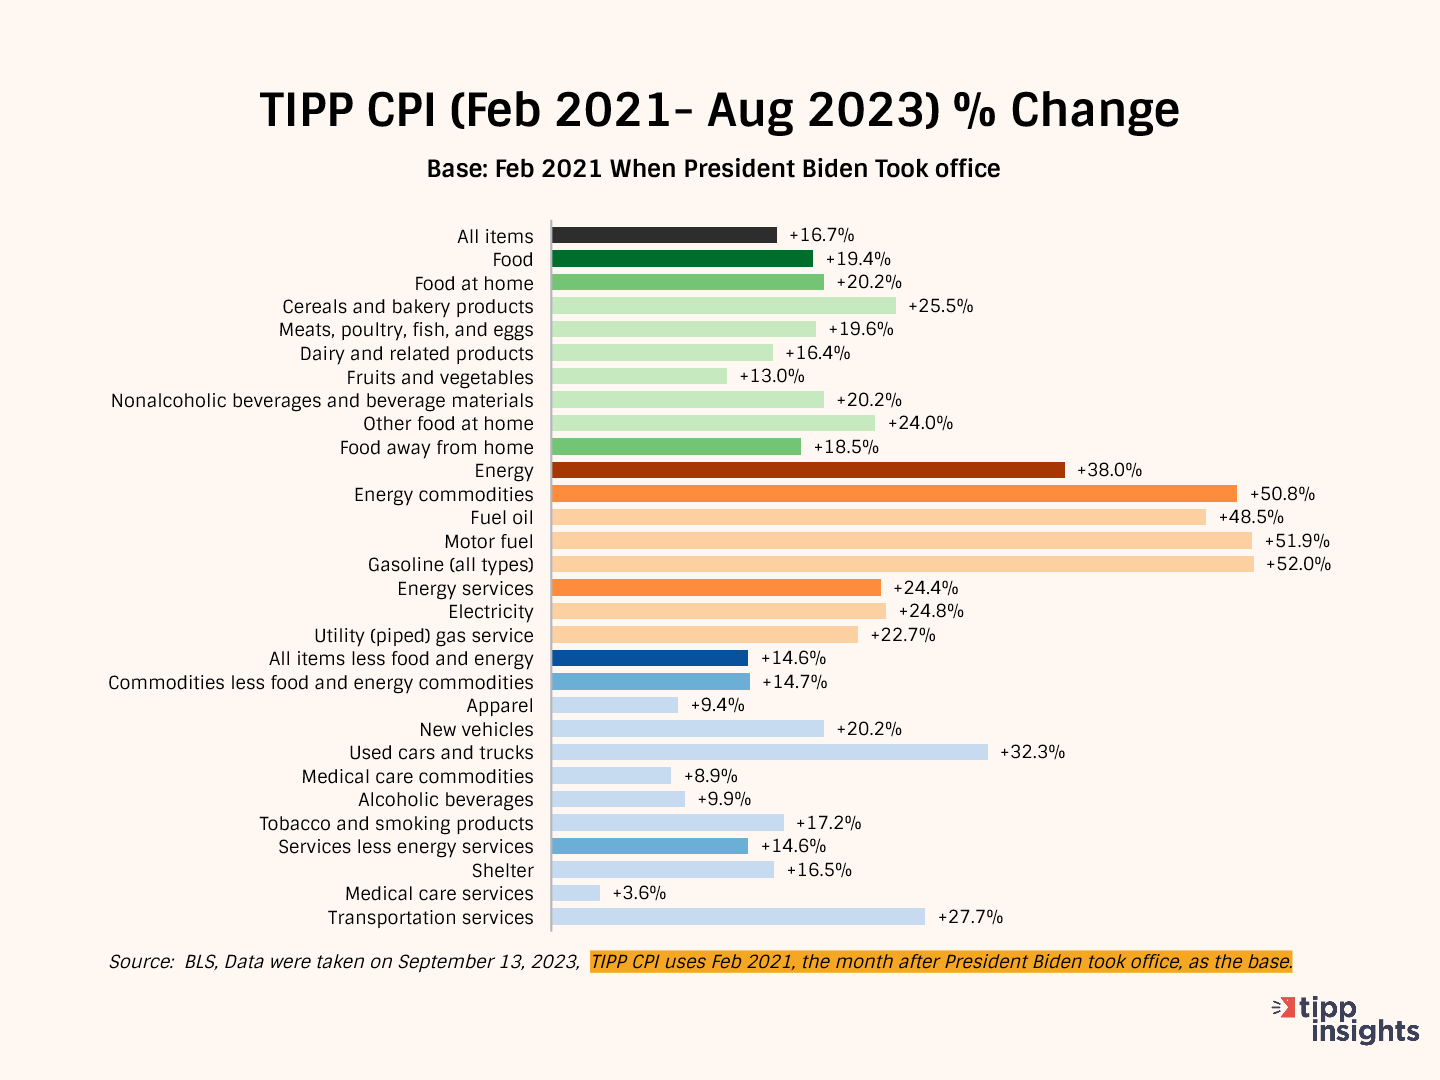
We developed the TIPP CPI, a metric that uses February 2021, the month after President Biden's inauguration, as its base. All TIPP CPI measures are anchored to the base month of February 2021, making it exclusive to the economy under President Biden's watch.
We use the relevant data from the Bureau of Labor Statistics (BLS) to calculate the TIPP CPI, but we adjust the period to Biden's tenure. CPIs are like index numbers that show how prices affect people's lives, similar to how the Dow Jones Industrial Average reflects the stock market.
When discussing the TIPP CPI and the BLS CPI, we convert the index numbers into percentage changes to better understand and compare them.
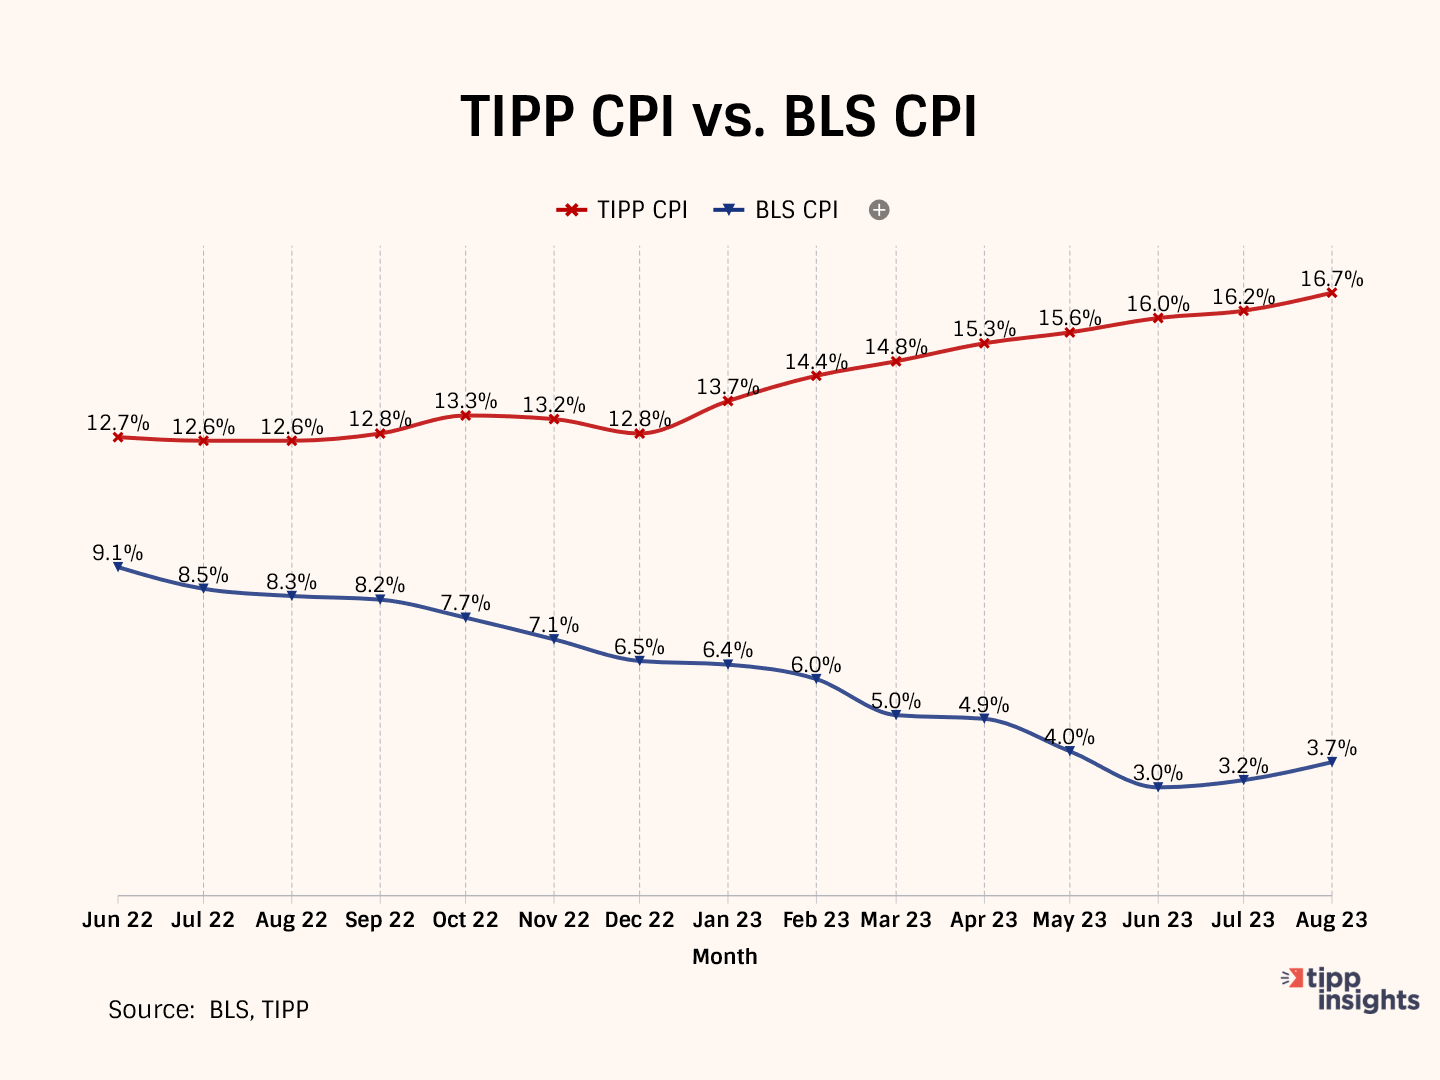
Bidenflation, measured by the TIPP CPI using the same underlying data, reached 16.7% in August. It was 16.2% in July,16.0% in June, and 15.9% in May.
By the middle of 2022, significant inflation had already taken hold. In August 2022, CPI inflation stood at 8.3 percent. While the official BLS CPI year-over-year increases will compare prices to already inflated bases in the coming months, these statistics might mask the full impact.
TIPP CPI vs. BLS CPI
The following four charts present details about the new metric.
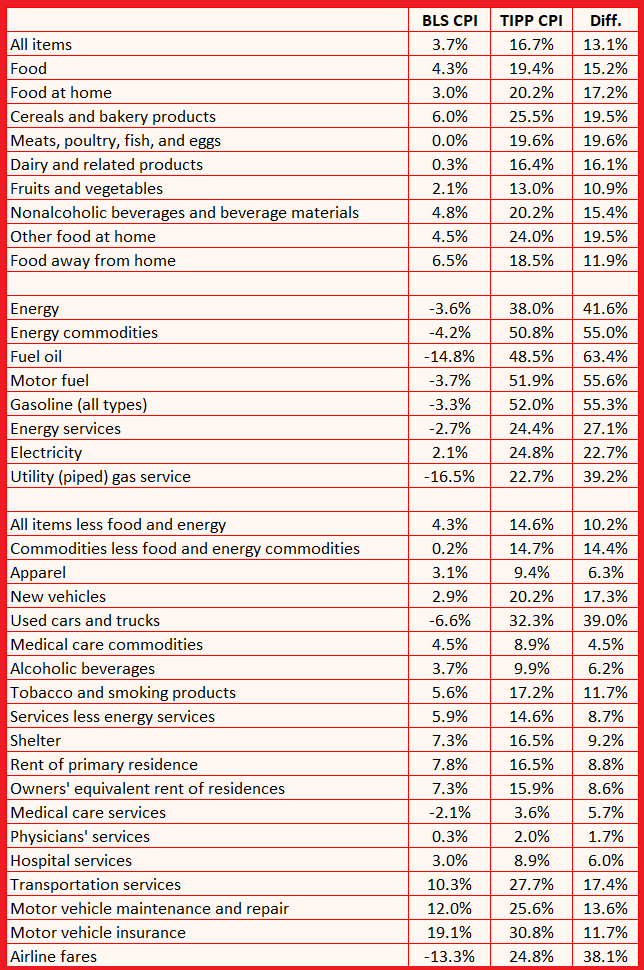
The annual CPI increase reported by BLS is 3.7% for August 2023. Compare this to the TIPP CPI of 16.7%, a 13.1-point difference. Prices have increased by 16.7% since President Biden took office. On an annualized basis, TIPP CPI is 6.5%.
Food prices increased by 19.4% under Biden compared to only 4.3% as per BLS CPI, a difference of 15.2 points.
TIPP CPI data show that Energy prices increased by 38.0%. But, according to the BLS CPI, energy prices declined by 3.6%. The difference between the two is a whopping 41.6 points.
The Core CPI is the price increase for all items, excluding food and energy. The Core TIPP CPI was 14.6% compared to 4.3% BLS CPI in the year-over-year measure, a 10.2-point difference.
Further, Gasoline prices have increased by 52.0% since President Biden took office, whereas the BLS CPI shows that gasoline price has improved by 3.3%, a difference of 55.3 points.
TIPP CPI finds that Used car prices have risen by 32.3% during President Biden's term. The BLS CPI shows that the prices have dropped by 6.6%, a difference of 39.0 points.
Inflation for air tickets under President Biden is 24.8% compared to the BLS CPI’s finding of an improvement of 13.3%, a difference of 38.1 points.
Americans' Concerns
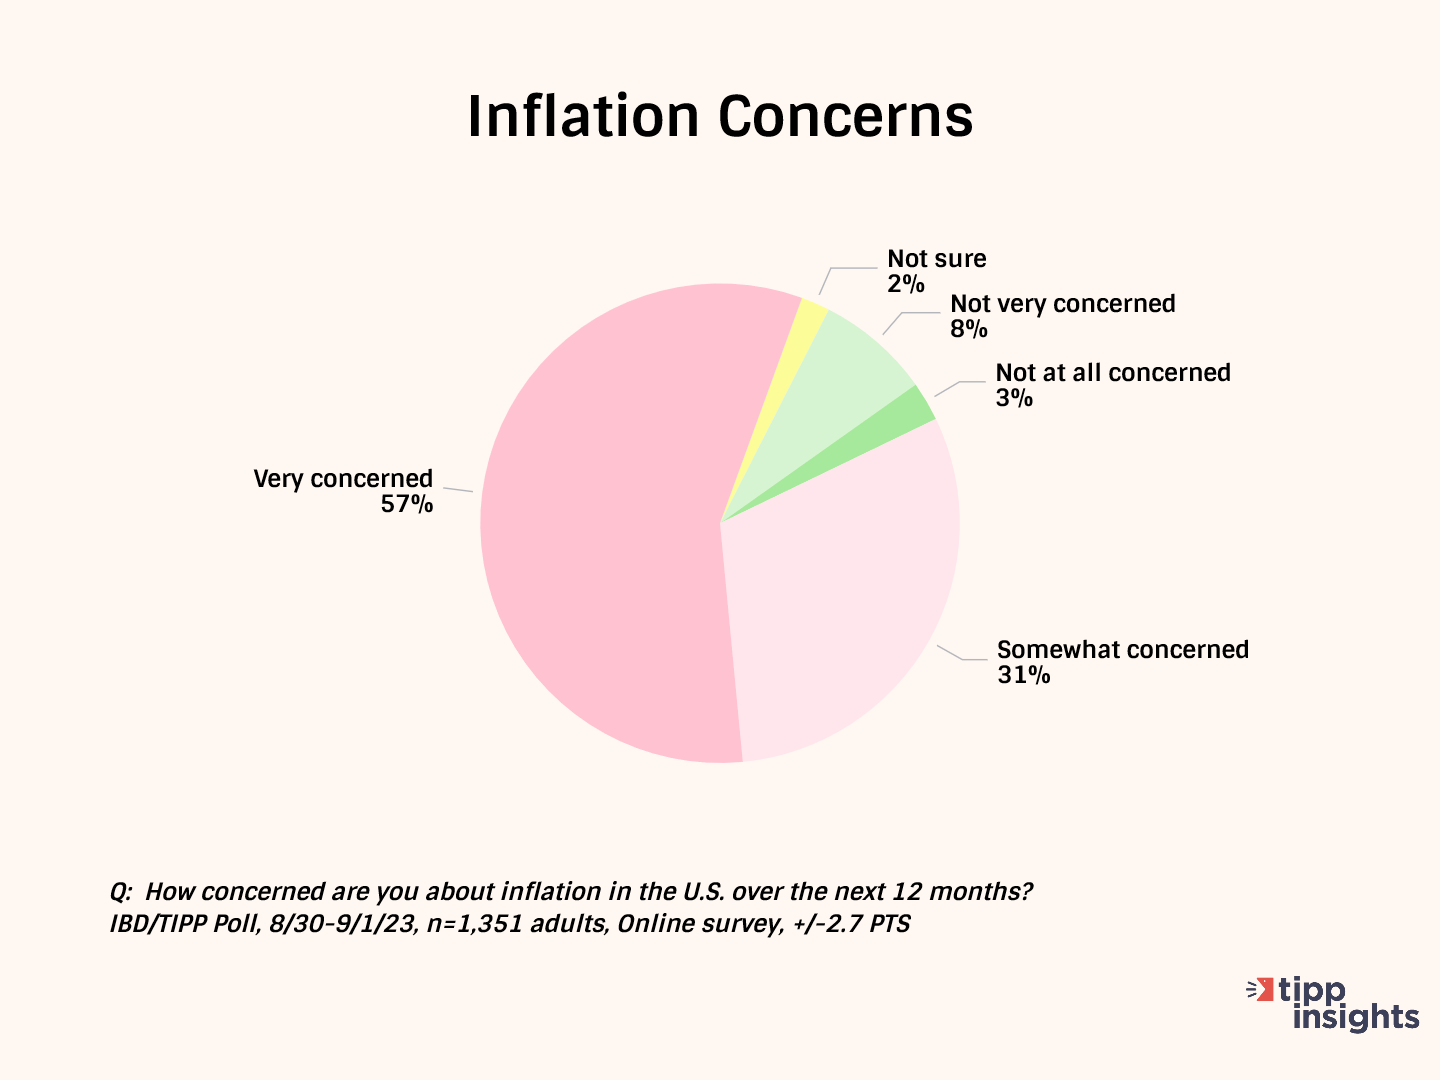
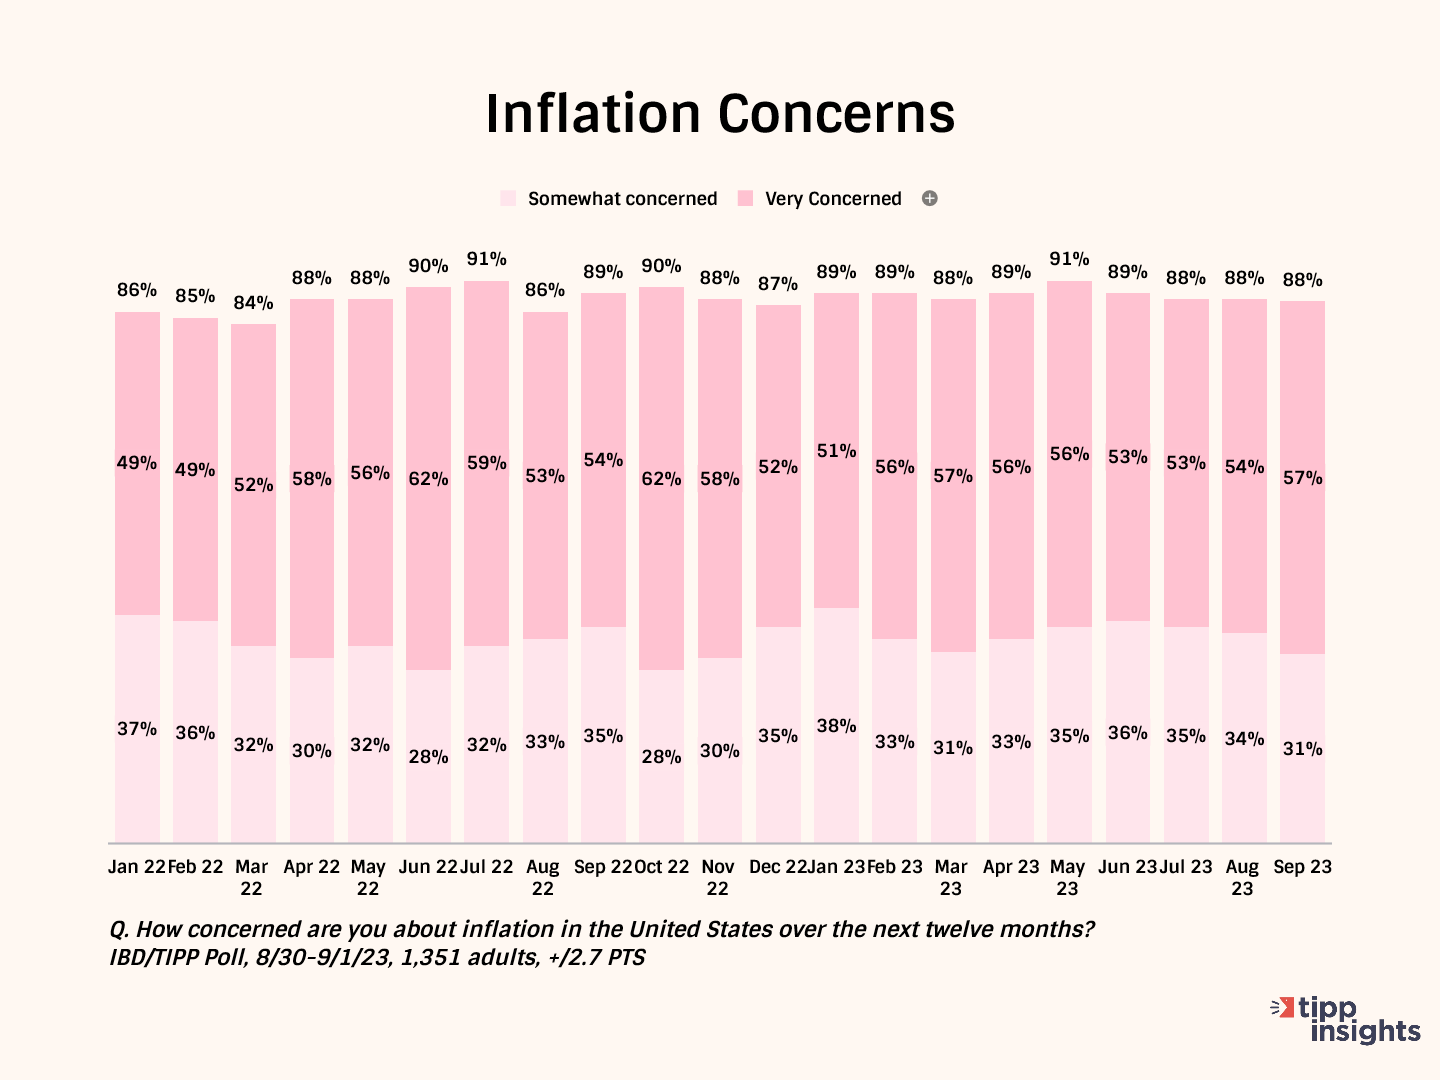
The latest Investor's Business Daily/TIPP Poll, completed earlier this month, shows nine in ten (88%) survey respondents are concerned about inflation. Throughout the past year, inflation concerns have stayed above 85%. The "very concerned" share has been over 50% for nineteen months.
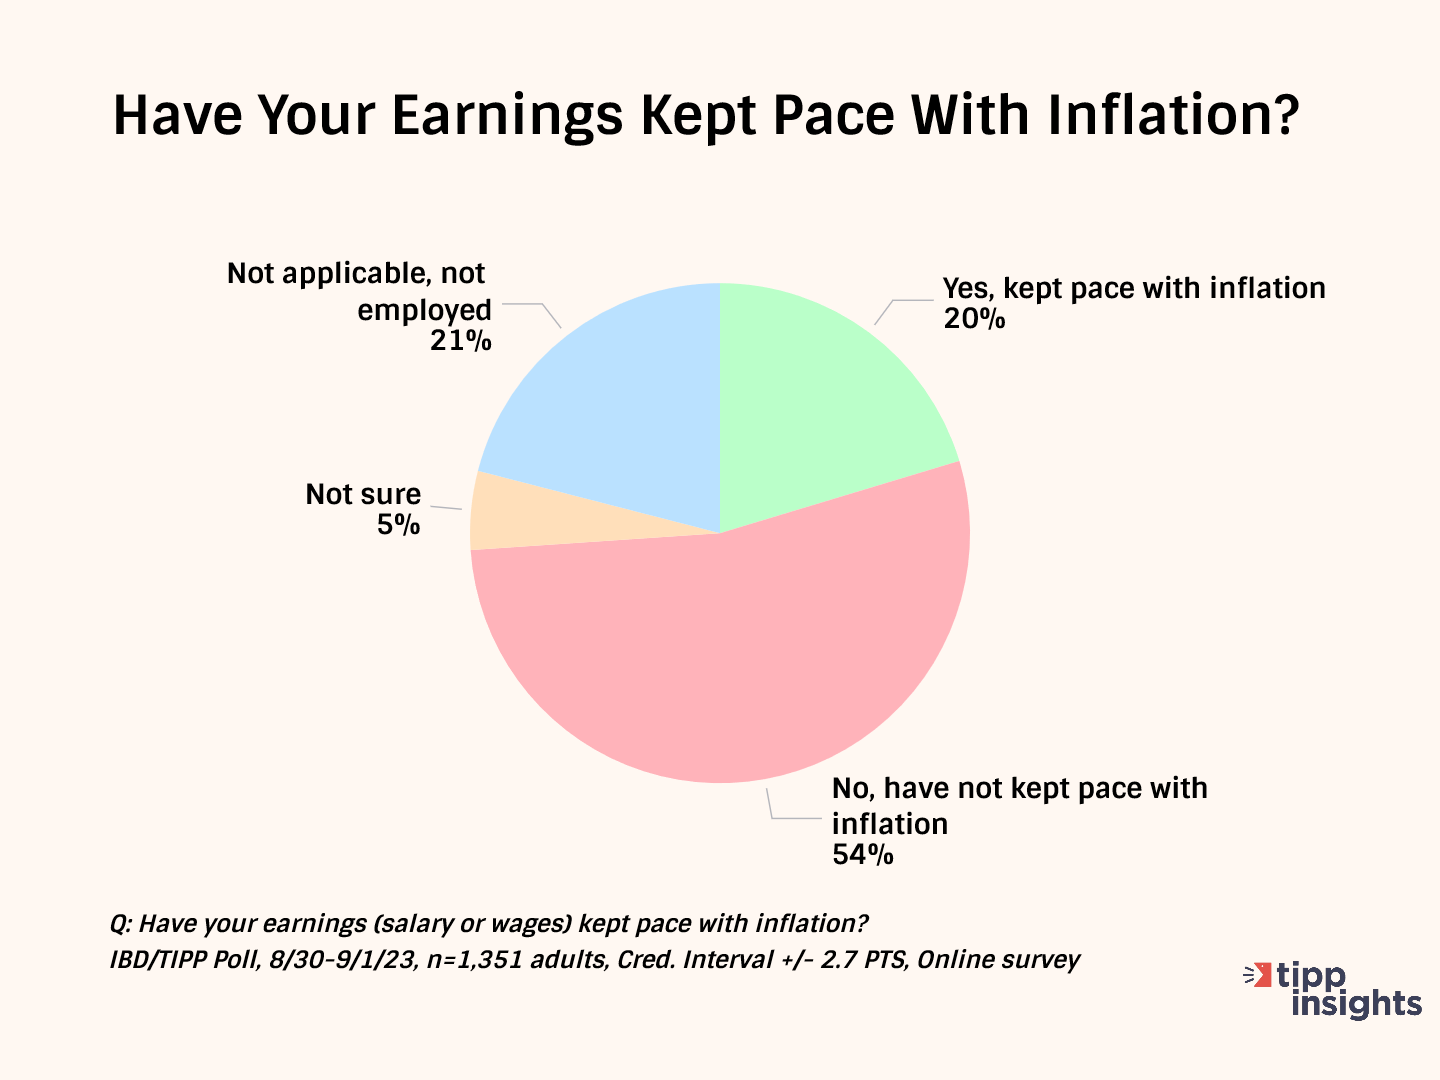
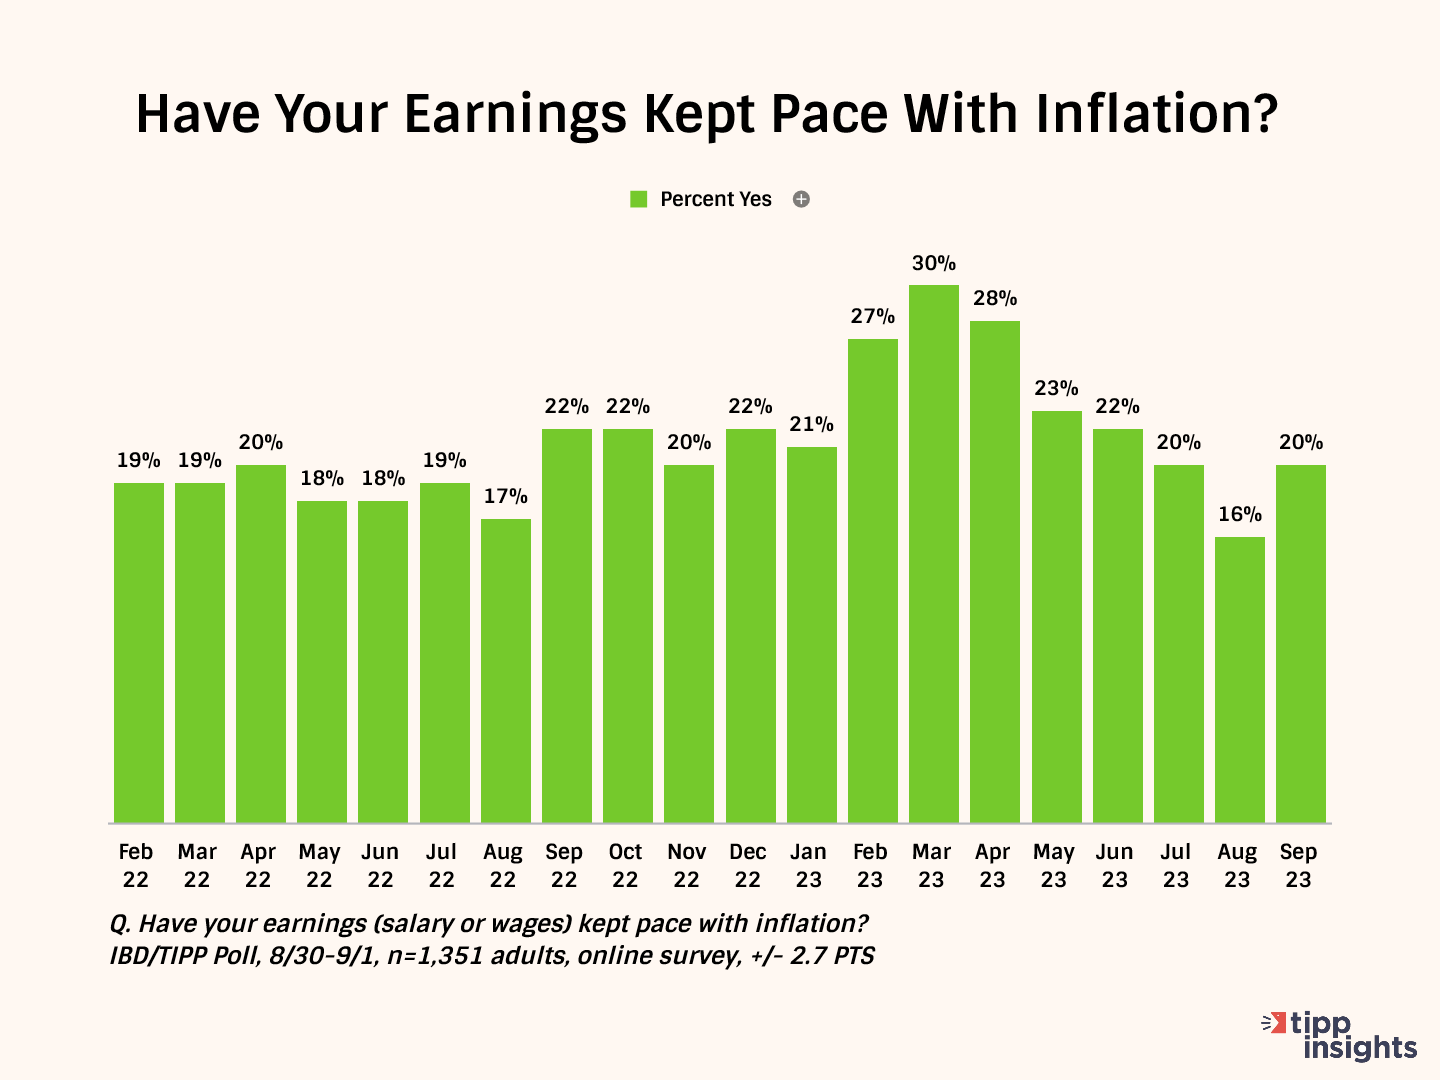
Over half (54%) say their wages have not kept up with inflation. Only 20% say their income has kept pace with inflation.
This statistic hovered in the low twenties for most of the last year. The positive change between January and March has petered out since May. Notice the steady descent from March 2023. However, in September, it posted 20% after the low of 16% in August.
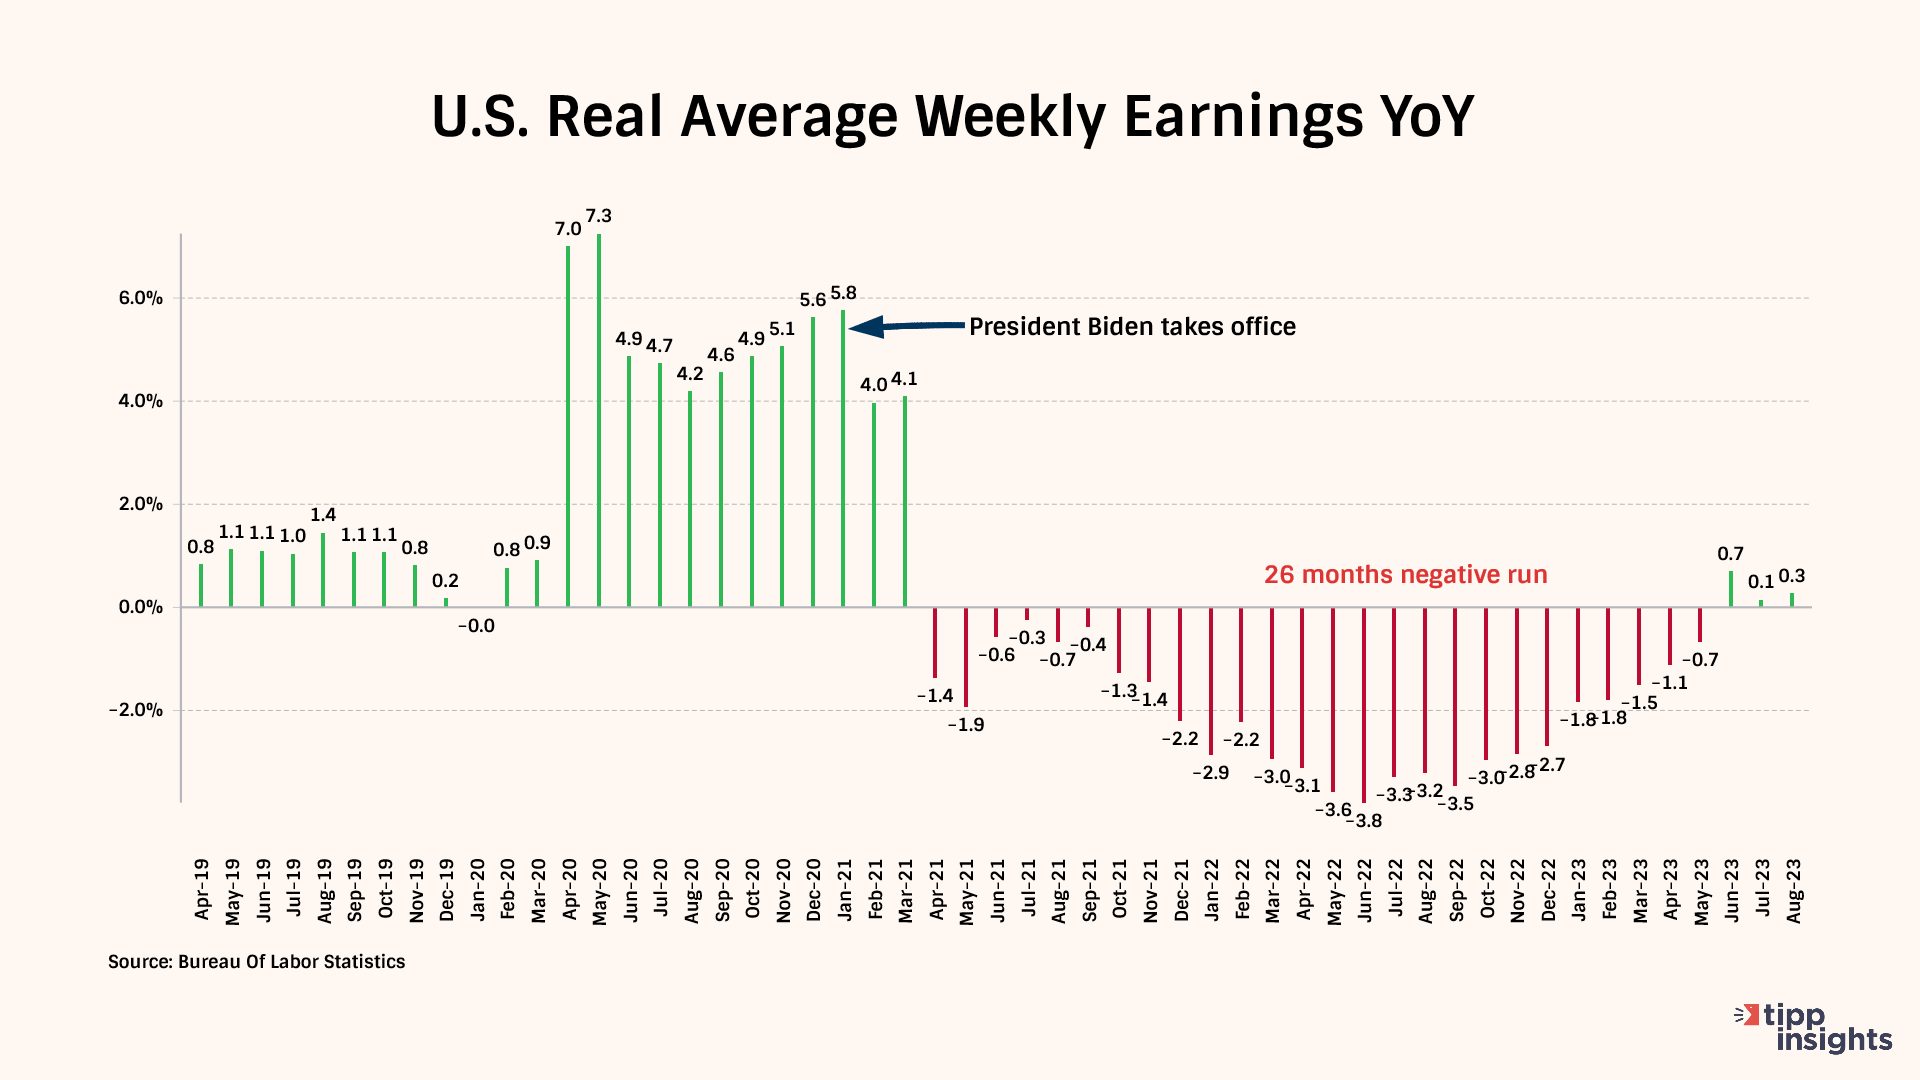
Nominal wages represent the amount of money one earns without considering changes in the cost of living. On the other hand, real wages consider inflation and measure the wages' purchasing power. Real wages provide a more accurate reflection of what is affordable with the income earned by factoring in the changes in the cost of living.
Real weekly wages measured year-over-year dropped for 26 of the 31 months of the Biden presidency. On a positive note, it broke a 26-month negative run in June.
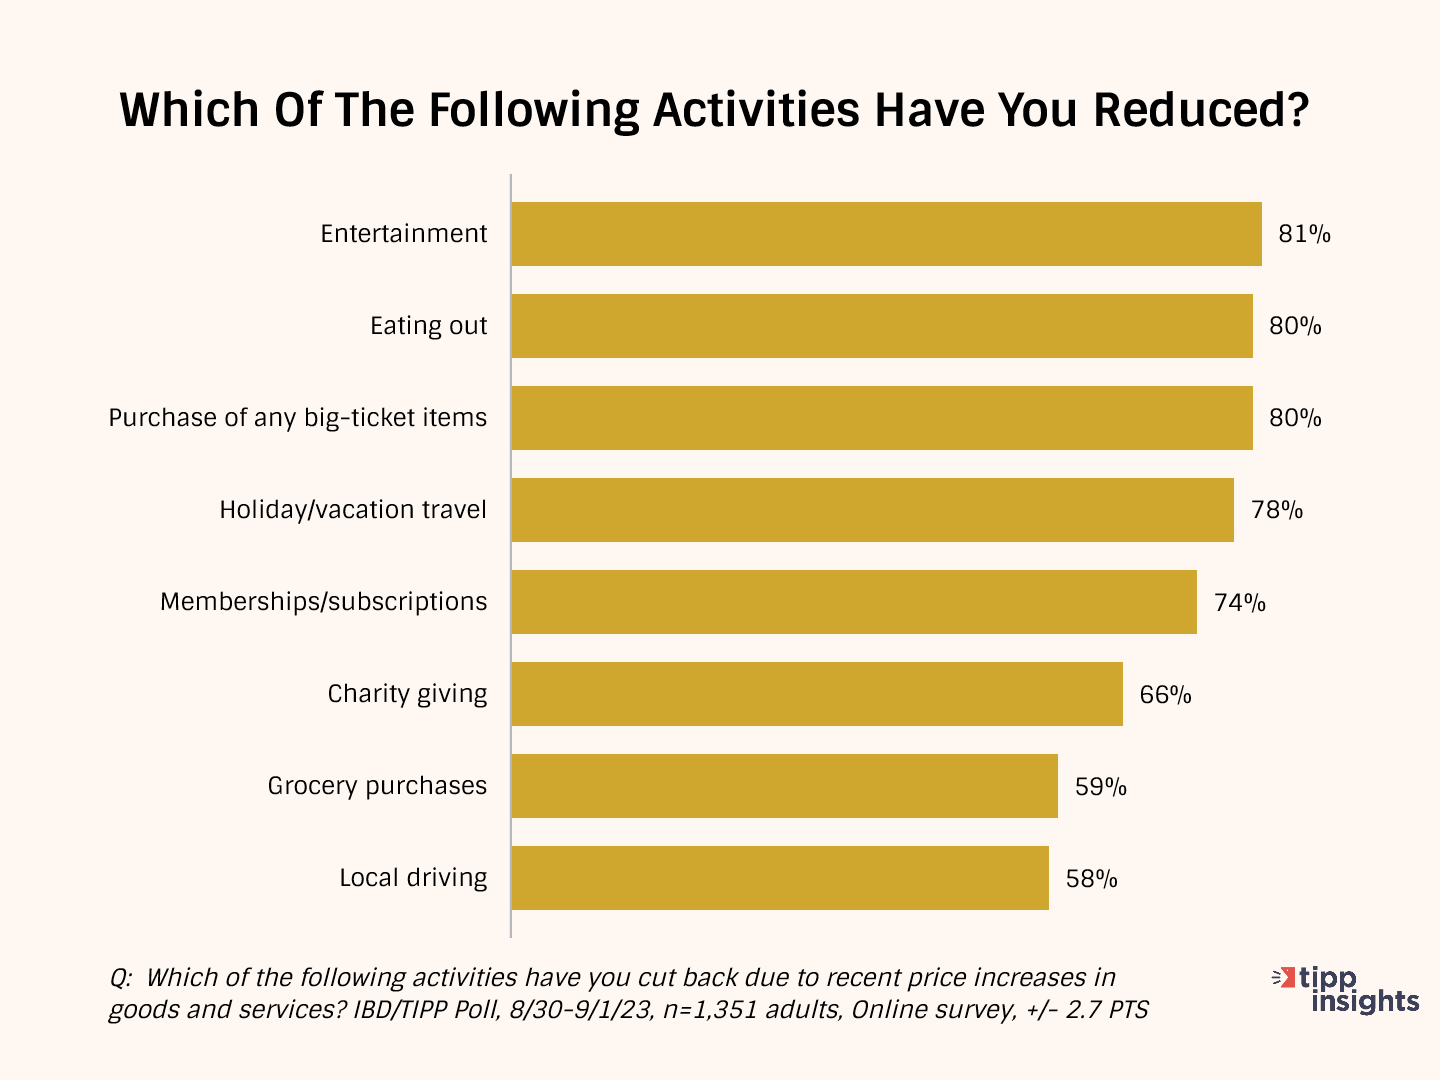
As a result of inflation, Americans are cutting back on household spending.
They are cutting back on entertainment (81%), eating out (80%), purchasing big-ticket items (80%), holiday/vacation travel (78%), and memberships/subscriptions (74%).
Many (66%) are cutting back on even good causes such as charity giving. Over one in two (59%) households spend less on groceries. The high gasoline prices forced 58% to cut back on local driving.
Inflation Direction
The chart below compares the 12-month average of monthly changes against the 6-month and the 3-month averages. We also show the reading for August 2023.
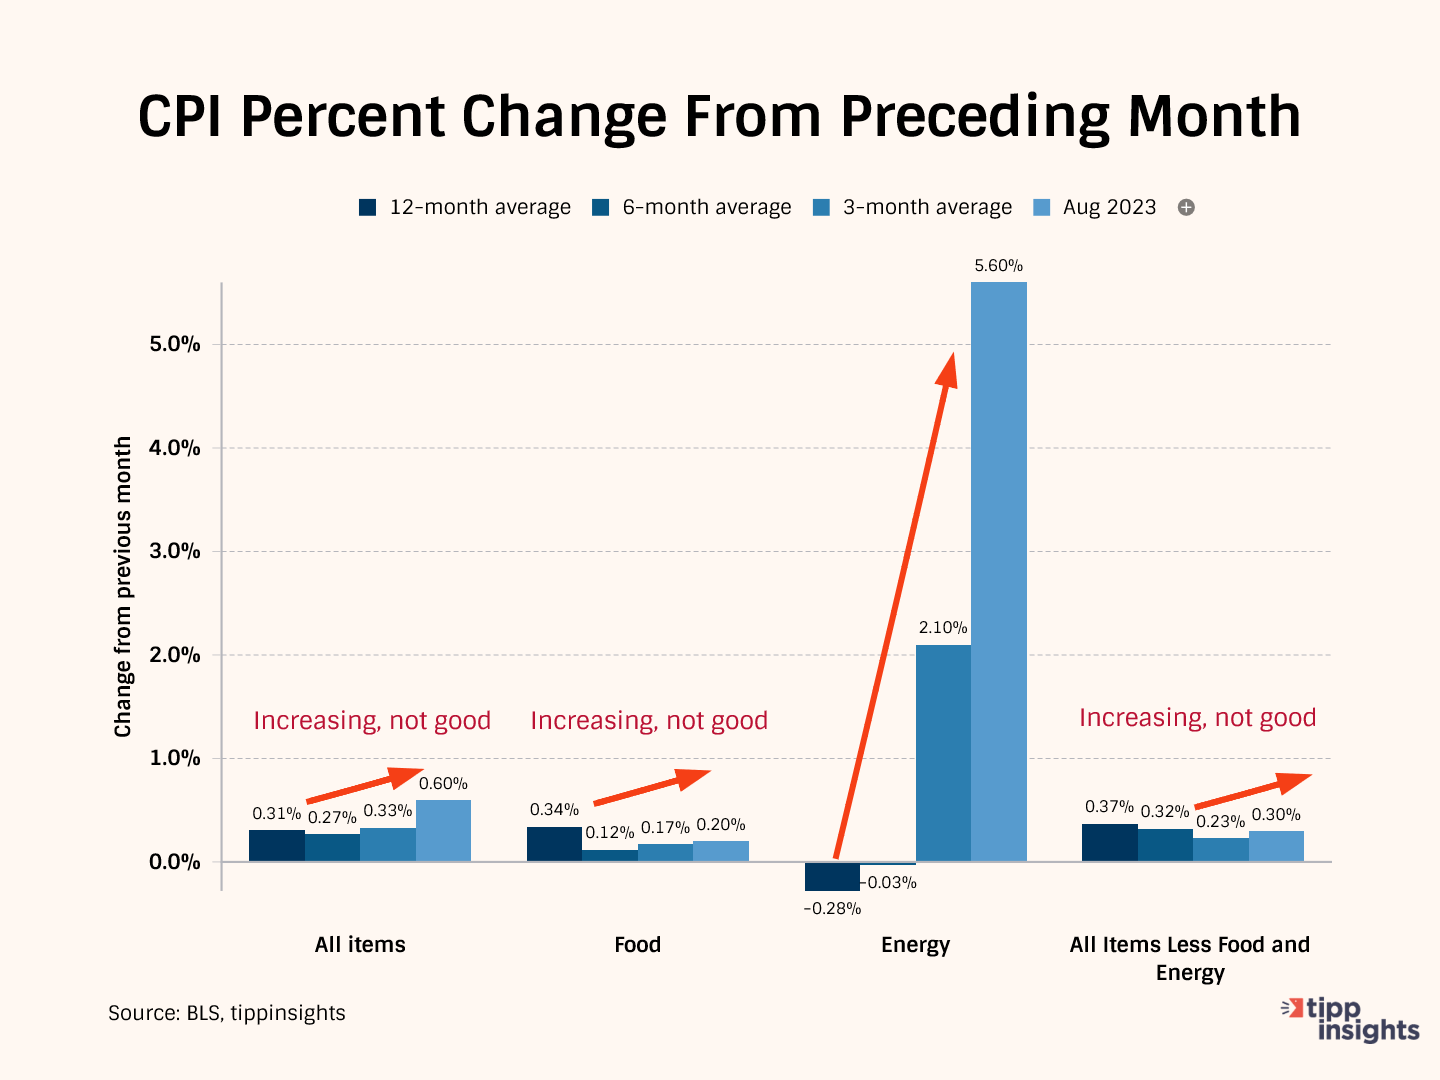
The 12-month average considers 12 data points and presents a long-term reference, while the six-month and three-month averages consider recent data points.
Typically, we compare the three-month average to the data from August 2023 to get a clearer picture. In August 2023, the price increase for 'All items' was 0.60%. However, the three-month average was lower at 0.33%. This means that the current reading is higher than the average of the past three months, indicating an acceleration in price increases.
The twelve-month long-term average of 0.31% is higher than the six-month average of 0.27%, which shows an improvement in the recent six months. Meanwhile, the three-month average of 0.33% is higher than the six-month average of 0.27%.
In conclusion, this pattern suggests that while price increases have slowed down in the long term, there was a noticeable pickup in August.
In August, the price increase for Food was 0.20%, higher than the 3-month average of 0.17%. This indicates that food prices have increased. Further, when we compare the three-month average of 0.17% to the average of the past six months, which was 0.12%, we can see that the recent 3-month period had a slightly higher price increase.
The twelve-month average was 0.34%, much higher than the six-month (0.12%) and three-month (0.17%) averages. The data confirms the improvement relative to the past long-term 12-month average. However, the recent increase is worrisome.
The Energy situation sharply deteriorated last month, with a spike of 5.6%. This increase in August 2023 is worse than the three-month moving average of 2.10%, indicating deterioration.
"All items less food and energy" is called "core inflation," i.e., after removing volatile food and energy components. The core inflation reading in August was 0.30%, higher than the three-month average of 0.23%. This indicates that there was deterioration in August.
Meanwhile, the three-month average of 0.23% is lower than the six-month average of 0.32%, suggesting a slowdown in core inflation. Additionally, the six-month average of 0.32% is lower than the 12-month average of 0.37%.
In summary, inflation worsened all around.
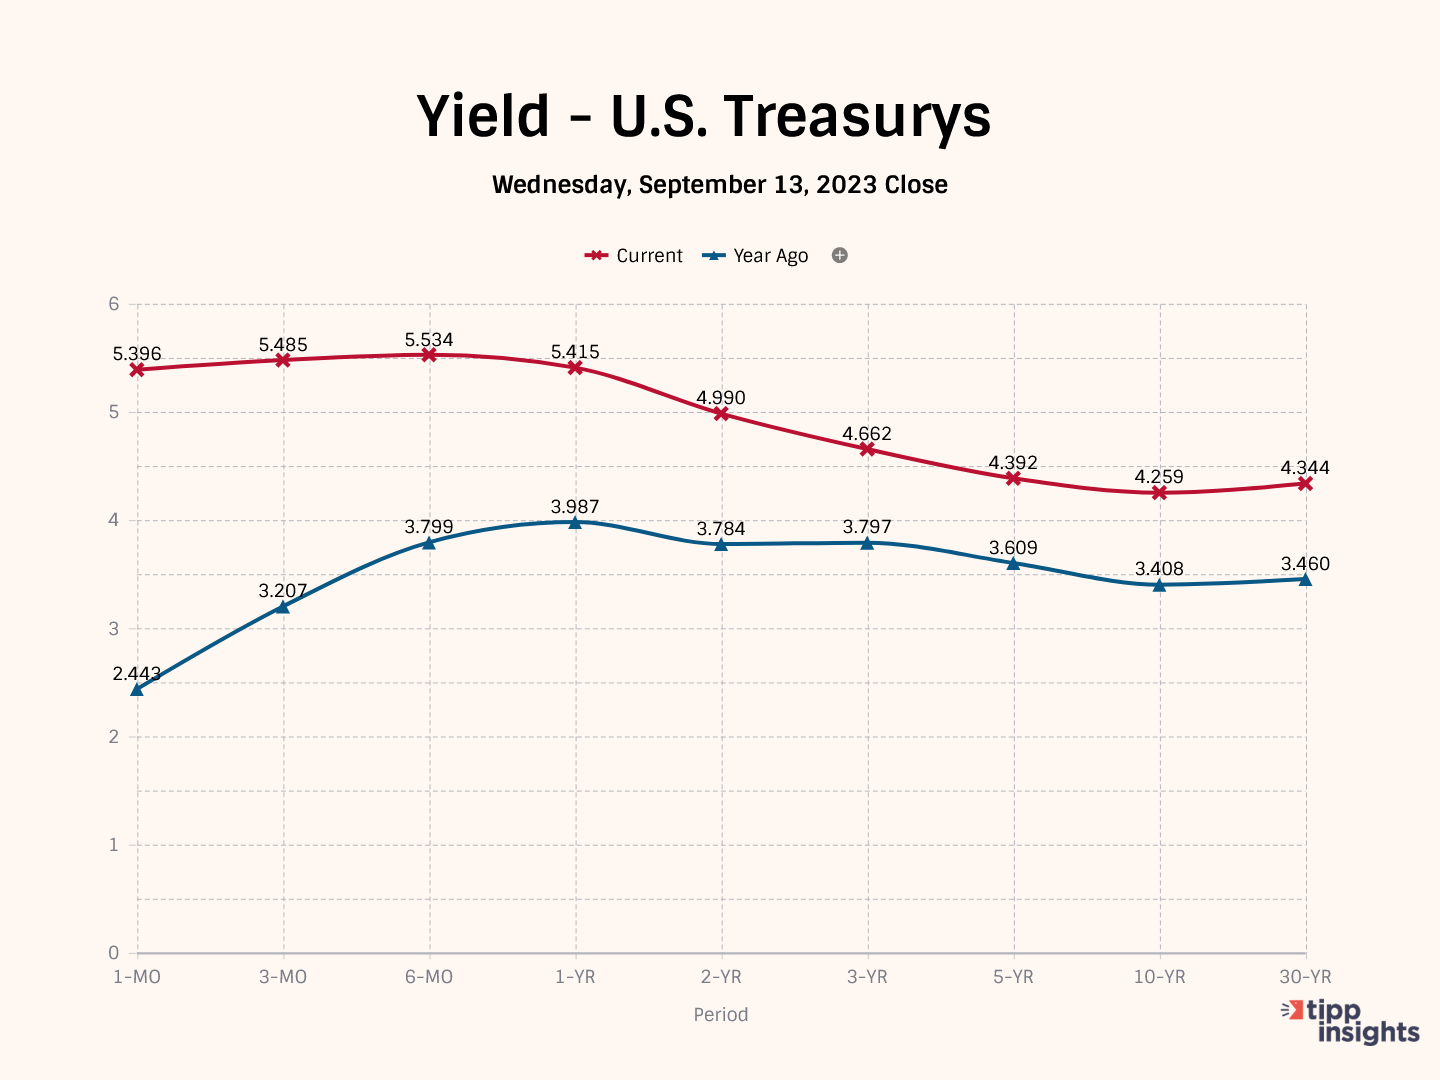
Inverted Yield Curve
In normal circumstances, longer-term investments offer higher yields than shorter-term investments due to the higher risk associated with longer durations. However, an inverted yield curve can occur during periods of economic turbulence, such as the current times. This happens because investors expect higher yields in the short term to compensate for the potential short-term uncertainties in the economy. As a result, the yields on shorter-term bonds become higher than those on longer-term bonds of the same credit quality.
The presence of an inverted yield curve is an indication that investors anticipate economic instability or a possible economic downturn. The inverted yield curve is a leading indicator of lower inflation and recession. It has a strong track record of accurately predicting the last ten recessions since 1955, with only one incorrect signal in the mid-1960s.
The closing yields on Wednesday were:
- 5.396% for the 1-month Treasury bill
- 5.485% for the 3-month Treasury bill
- 5.534% for the 6-month Treasury bill
- 5.415% for the 1-year Treasury bill
- 4.990% for the 2-year Treasury note
- 4.662% for the 3-year Treasury note
- 4.259% for the 10-year Treasury note
- 4.344% for the 30-year Treasury bond
Stagflation
Most Americans struggle, challenged by the high core inflation rate of 4.3%. Stagflation refers to a combination of stagnant economic growth and high inflation.
Since March 2022, the Fed has raised interest rates by 5.25 percentage points. High interest rates are likely to slow down the economy further.
Each time the Federal Reserve increases interest rates to contain inflation, the U.S. government must pay higher interest rates to service its ballooning debt. A rising debt-to-GDP ratio limits the ability to fund essential government services.
In a recent Reuters survey of 97 economists, more than 95% (94 of 97) predicted the Fed would hold the federal funds rate in the current 5.25%-5.50% range next week. However, 20% predicted another increase in 2023.
The September IBD/TIPP Poll revealed that most Americans view the economy negatively. Nearly half (49%) believe we are in a recession, and six in ten (59%) feel that the economy is not improving.
Considering these factors and the numbers, we predict that the U.S. economy will face an extended period of stagflation characterized by a slowdown and inflation.
To access the TIPP CPI readings each month, you can visit tippinsights.com. We'll publish the TIPP CPI and our analysis in the days following the Bureau of Labor Statistics (BLS) report. The upcoming release of TIPP CPI is on October 13, 2023. We'll also post a spreadsheet in our store for download.
Hey, want to dig deeper? Download data from our store for a small fee!
Want to understand better? We recently wrote an explainer that sixth graders could understand. Everyone can benefit from it. Milton Friedman's Priceless Lessons On Inflation.
We could use your help. Support our independent journalism with your paid subscription to keep our mission going.


