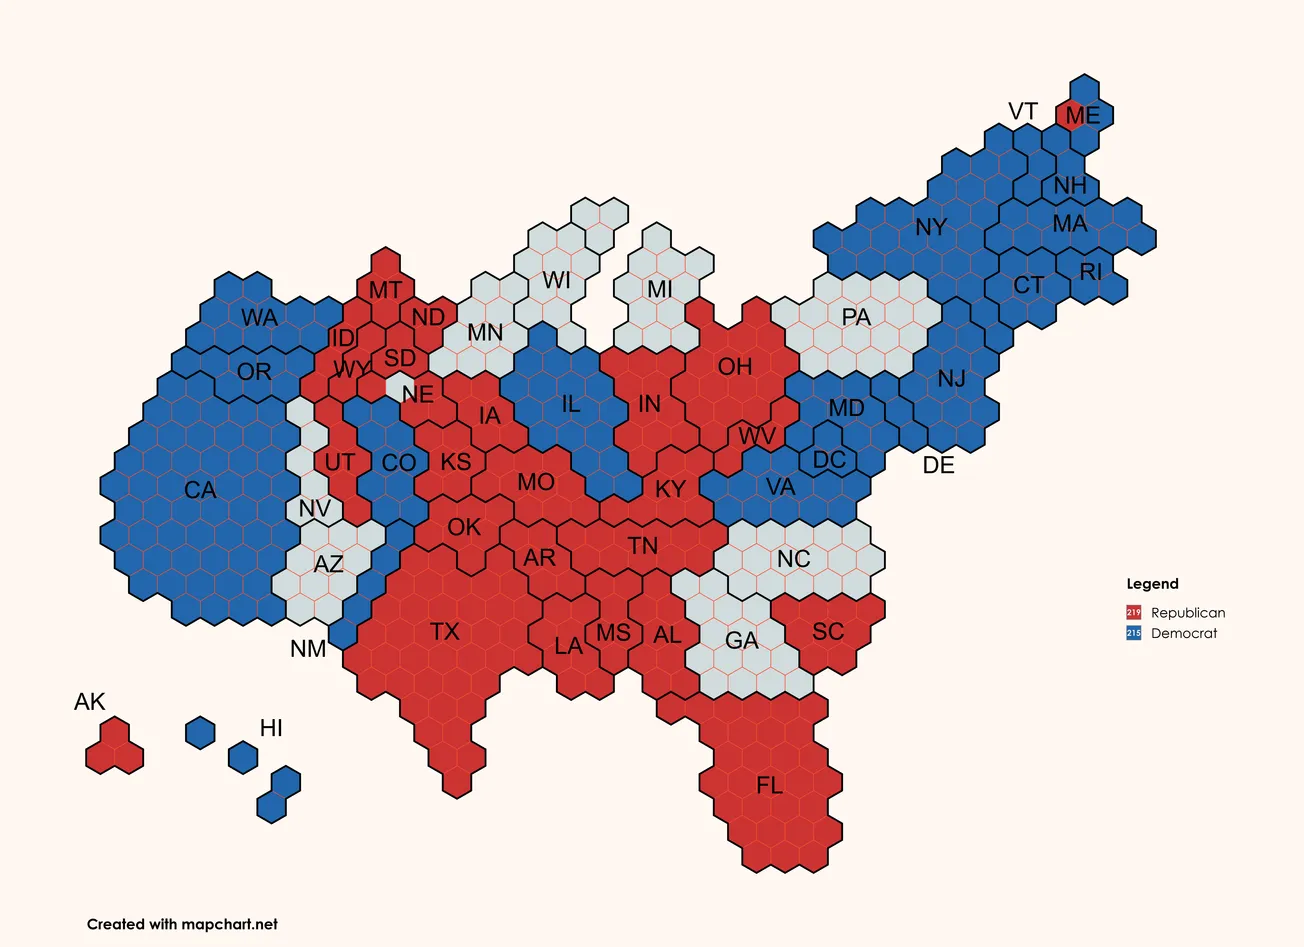
This electoral simulation report assesses the likelihood of victory for Donald Trump and Kamala Harris based on three models: polling data, betting markets, and a combination of both information. The results are derived from 1,000,000 simulations conducted across battleground states, using RealClearPolitics polling averages and Polymarket betting odds as inputs.
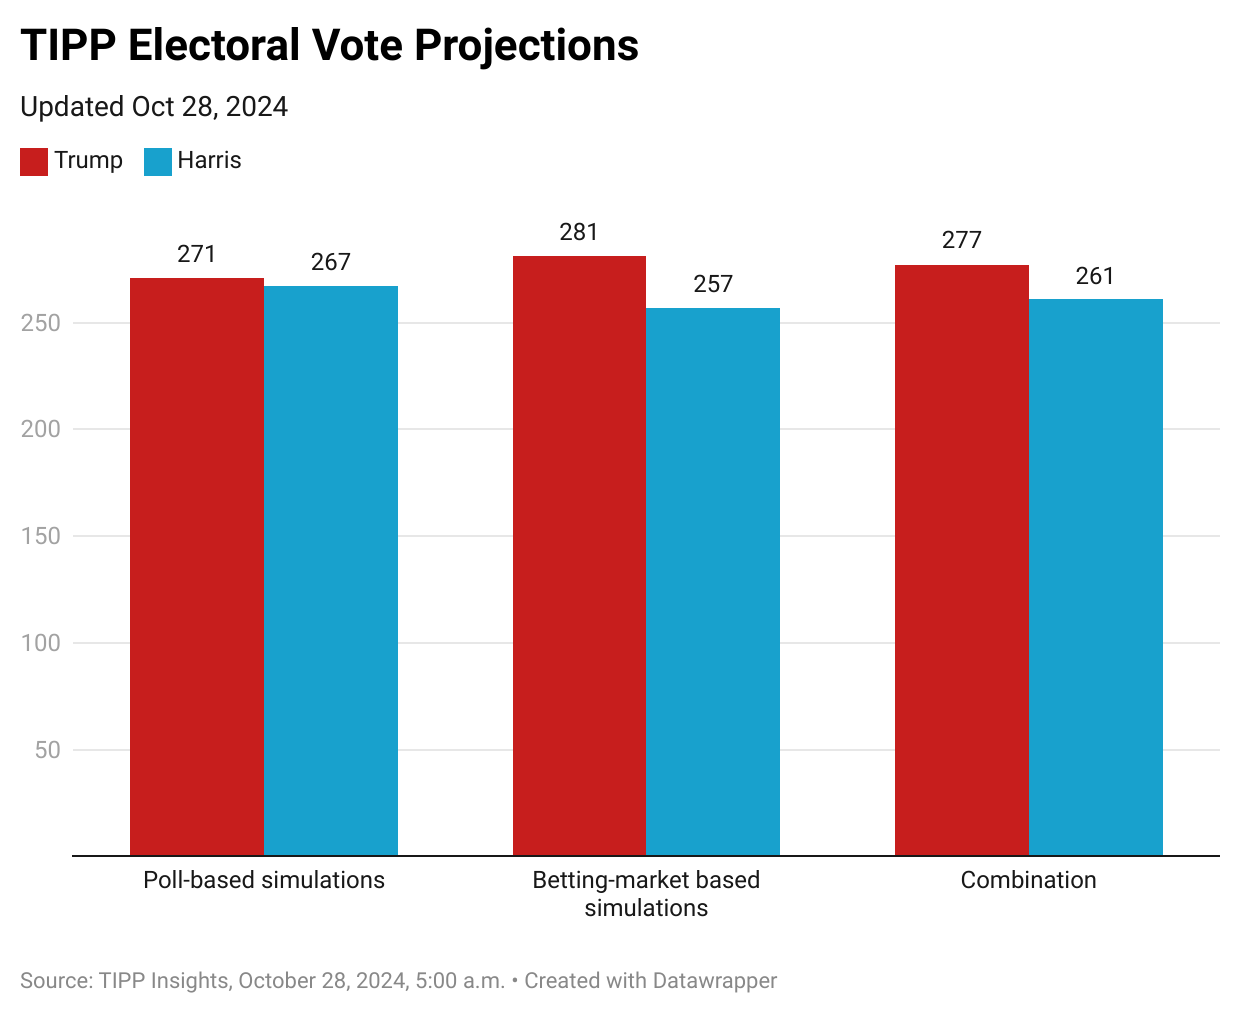
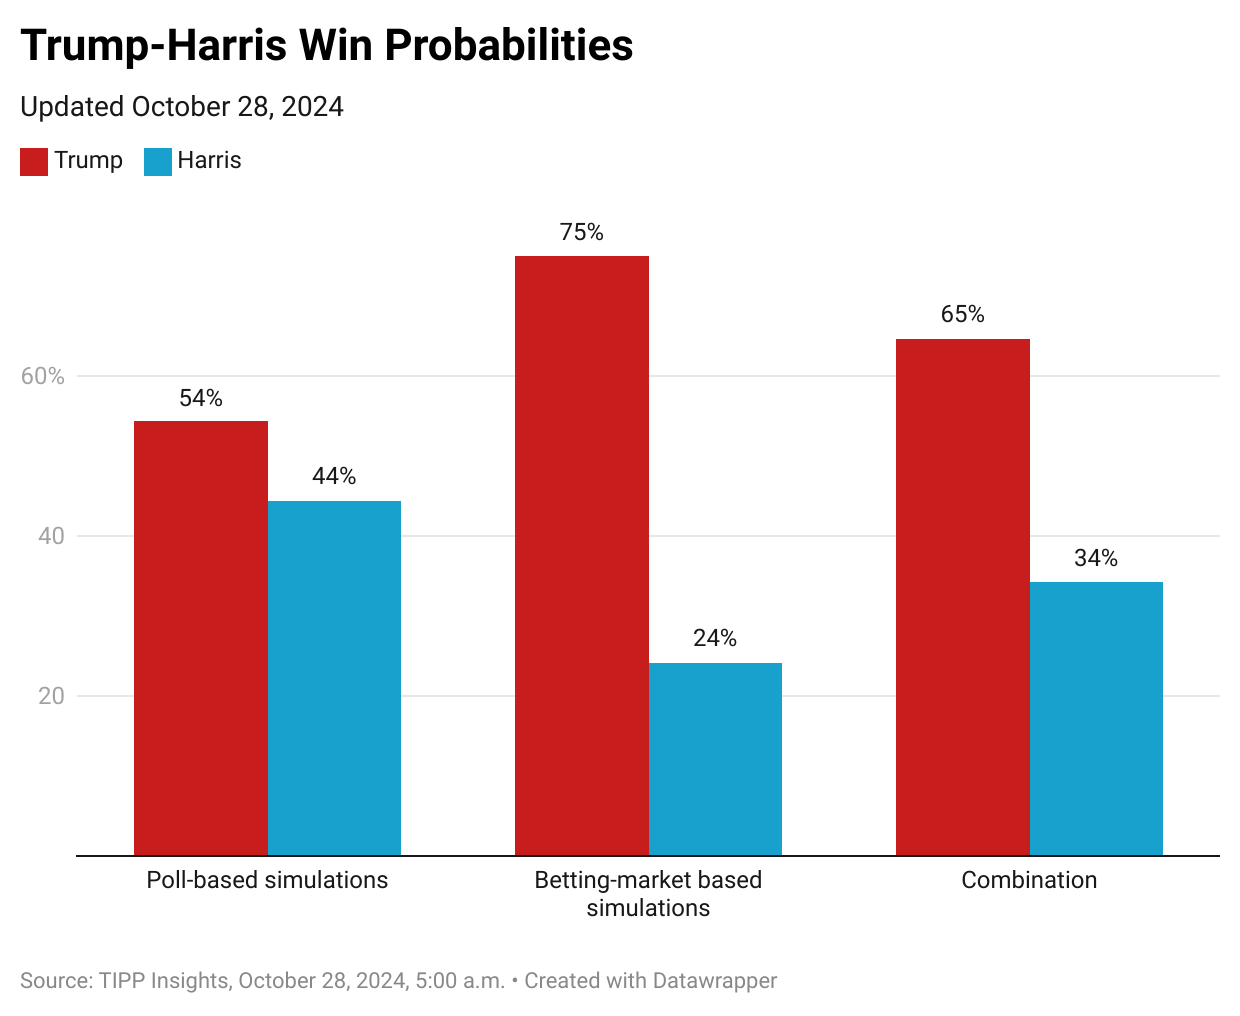
Polling-Based Results
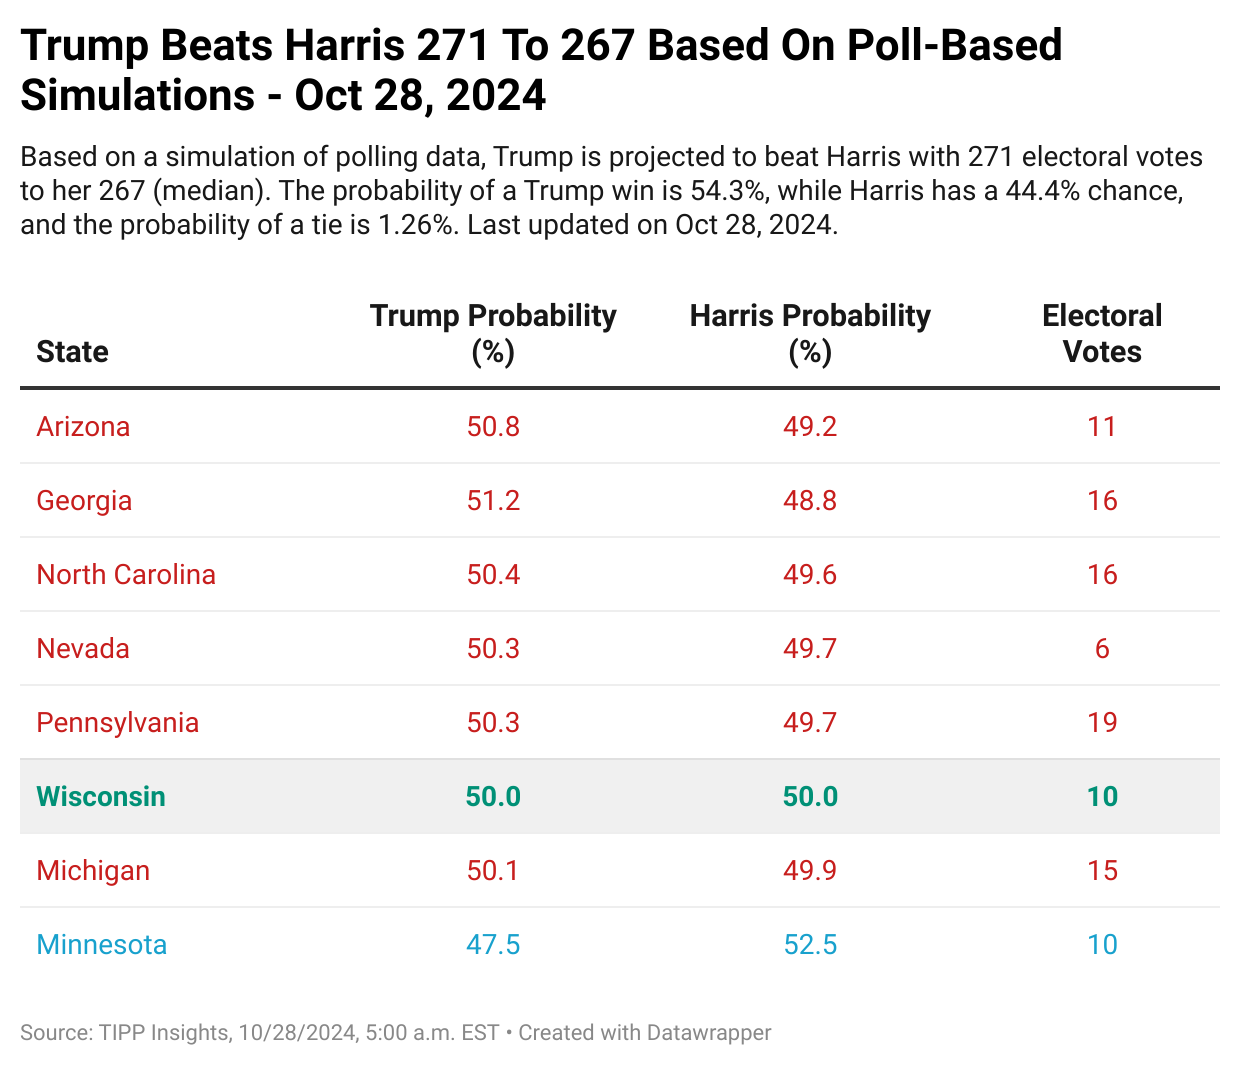
This section details Trump’s and Harris’s probabilities of victory based on polling data across battleground states. The simulation model ran 1,000,000 trials using polling averages for each state.
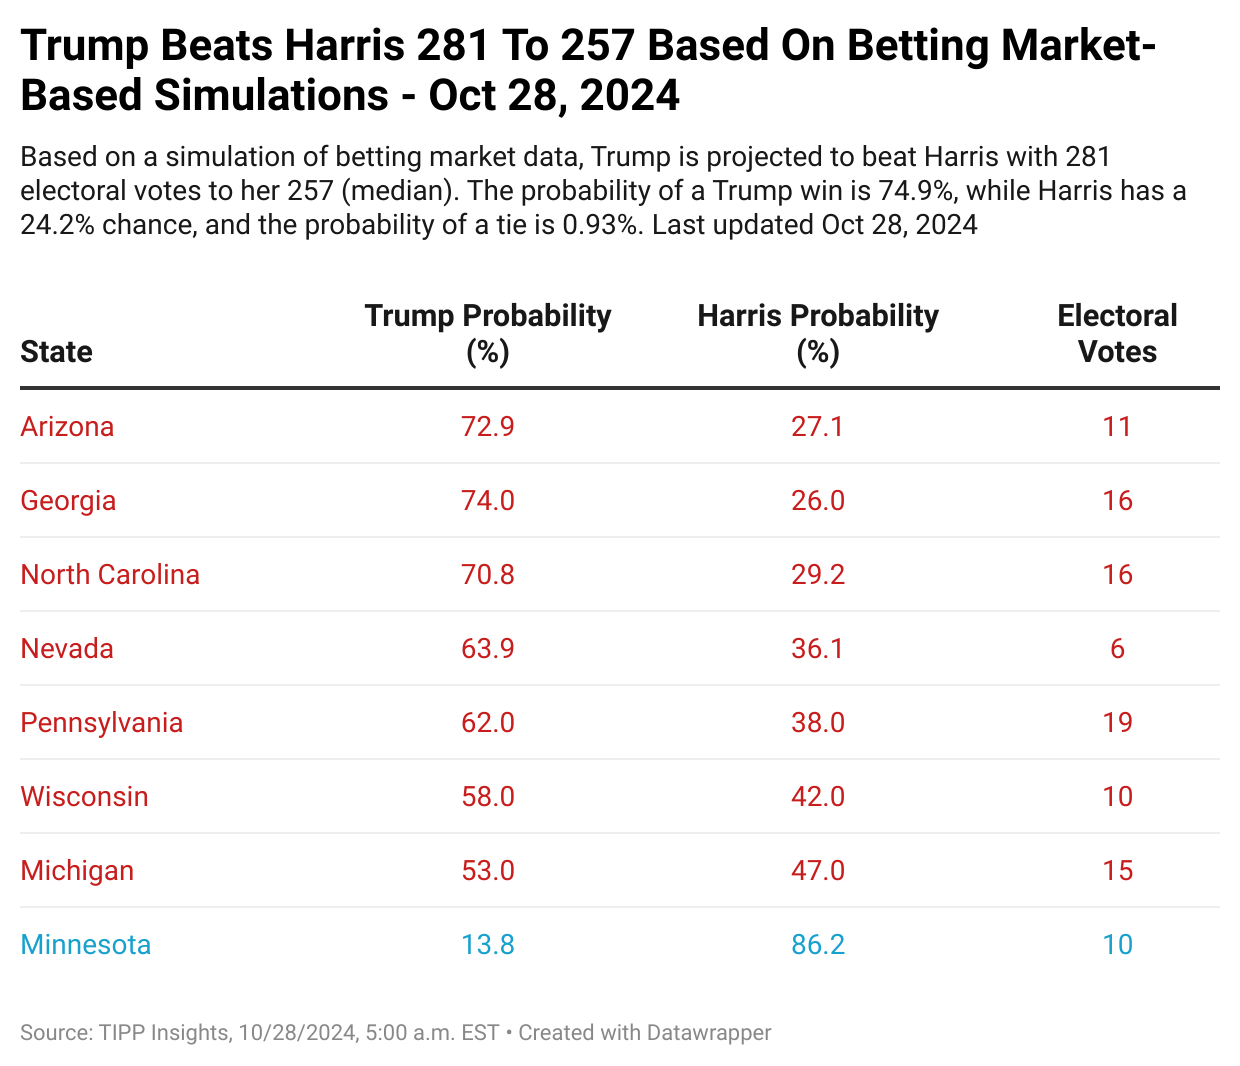
Betting Market-Based Results
This section presents the probabilities of victory based on the betting market odds. These results reflect market sentiment and expectations rather than polling data.
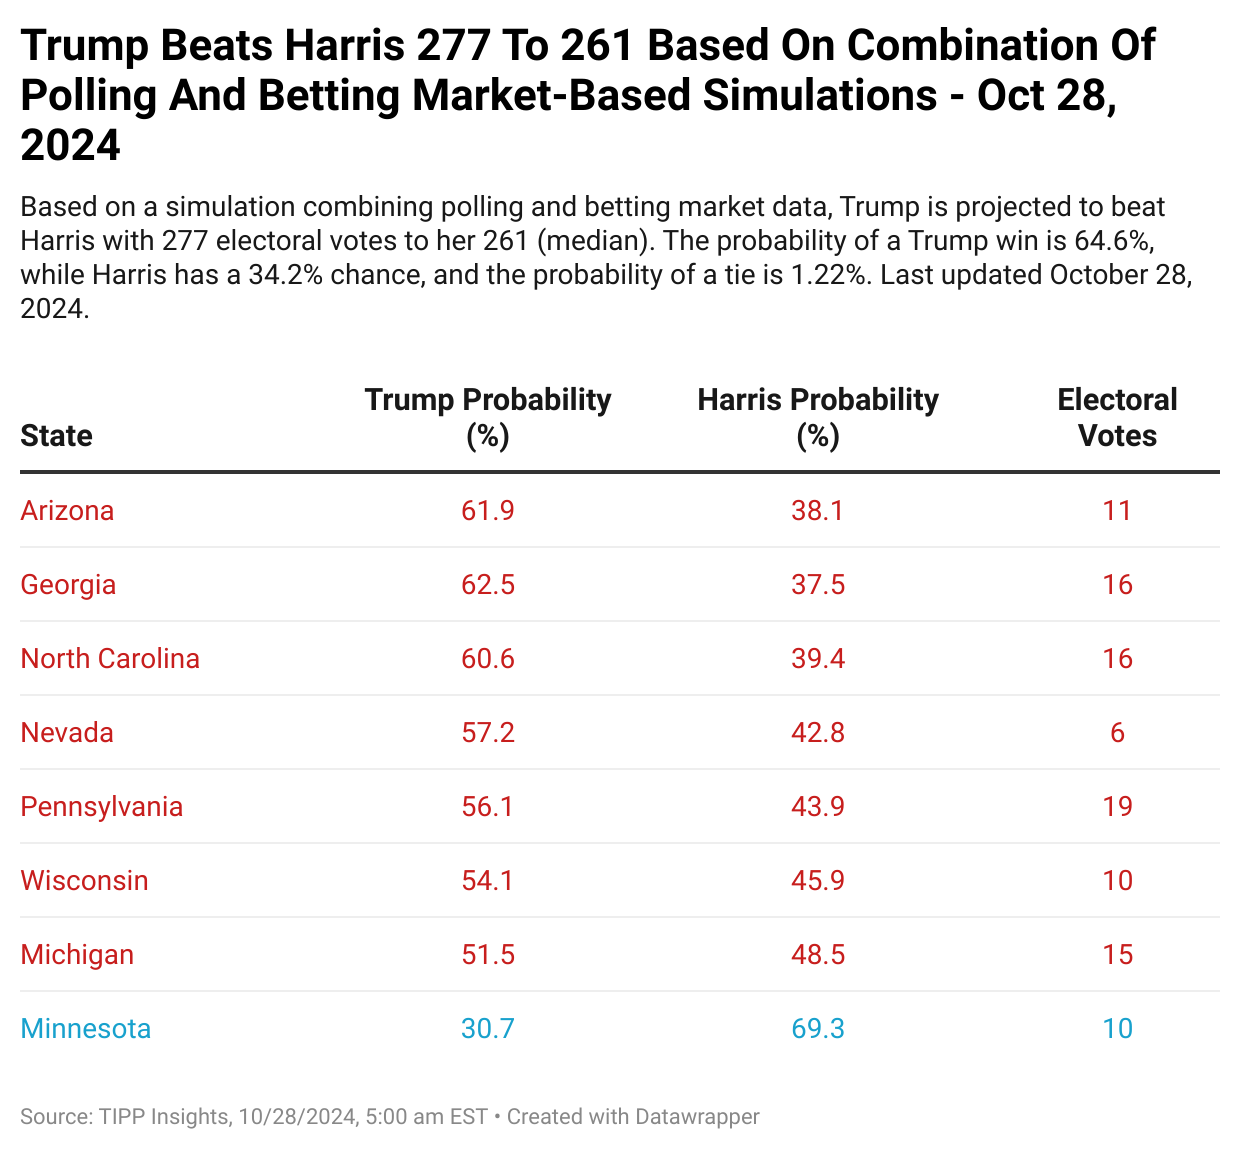
Combined Polling & Betting Market Results
This section combines polling data and betting market odds to generate a composite probability of victory for each candidate. The two data sources are weighted equally.
The 2024 race is much tighter than in 2016 and 2020. Trump has an advantage right now since he has a history of underperformance in polls due to silent voters in many battleground states. In the coming days, we will share with you what-if analysis, such as whether Trump overperforms by 1% or 2% in battleground states, etc., along with a daily tracking poll, the first release of which is tomorrow.


