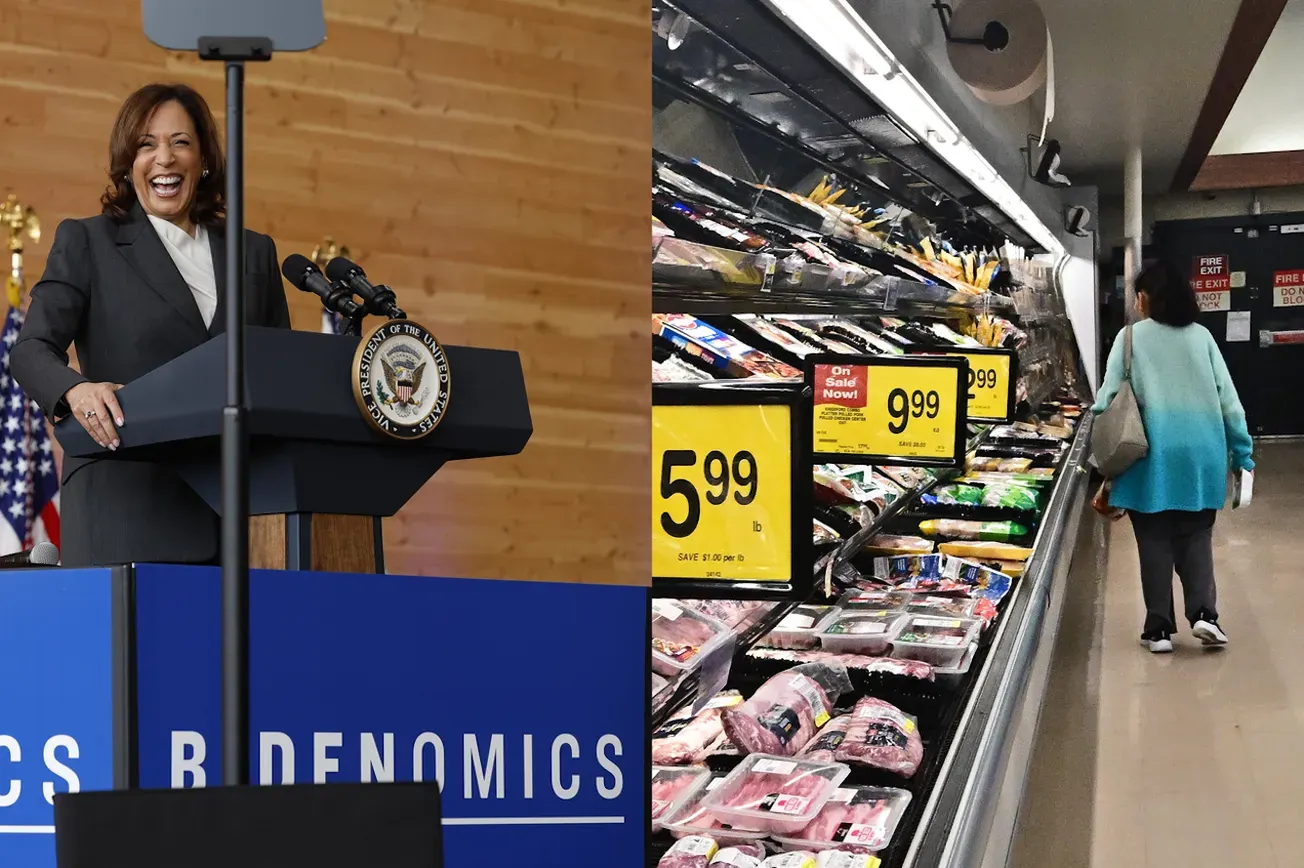
- Kamalaflation at 19.6% squeezes Americans’ wallet
- Core inflation remains stubborn at 3.2%
- Inflation improvement is an illusion due to the base effect
- Media jumps the shark, calling inflation no longer a problem
- Michelle Bowman, a Fed member, suggests that a September rate cut may be too optimistic
- RELATED: American Households Struggle Under Intense Financial Strain
We are retiring 'Bidenomics' for ‘Kamalanomics’ since Vice President Kamala Harris is the incumbent running for election. She is just as responsible for the current economic conditions as Biden and cannot distance herself from them. Through her tie-breaking votes in the Senate, Harris passed key inflationary legislation, including the Inflation Reduction Act and the American Rescue Plan Act, which added trillions to the national debt.
The dark reality of Kamalanomics is the alarming 19.6% inflation under the President’s watch, which is 5.6% annually. When Biden-Harris took office, inflation was at just 1.4%. Since March 2021, inflation has consistently remained above the Federal Reserve's 2% target for 41 consecutive months.
Under Biden-Harris, the federal debt has increased by $7.4 trillion. To finance the President’s spending spree, the Federal Reserve printed money from nothing. The increased money supply, without a corresponding increase in goods and services, reduced the value of each dollar, causing prices to rise quickly and leading to high inflation, effectively acting as a hidden tax on everyone.
Prices have increased by 19.6%, while real wages have declined by 1.8%. Average hourly earnings for all employees dropped 1.8% to $11.19 in July 2024 from $11.39 in January 2021, when Biden-Harris took office.
The typical U.S. household now requires $1,095 more each month (equivalent to $13,140 annually) compared to three years ago. The amount varies by state. For example, a California household pays $1,250 more monthly to purchase the same basket of goods and services as in January 2021. The average California household has spent $31,983 more due to inflation since January 2021.
Squeezed by persistent inflation, many Americans are turning to a second gig to supplement their income. A recent Bankrate survey reveals that 36% of U.S. adults have a side hustle, down from 39% the previous year. Many rely on this additional income to cover essential living expenses like rent and groceries, with 32% believing they will always need this additional work to make ends meet. Younger adults, particularly Gen Z, are the most likely to have a side hustle, with 48% engaging in extra work. The survey highlights ongoing financial pressures, with 35% using side hustle income for living expenses and 20% for paying off debt.
American household debt has increased significantly amid challenging economic conditions. Between Q1 2021 and Q2 2024, credit card debt rose by 48.1%, reaching $1.14 trillion, while overall household debt increased by 21.6%, totaling $17.8 trillion. American consumers now carry an average of $6,329 in credit card debt. Rising debt has contributed to higher delinquency rates, with 9.1% of credit card balances and 8% of auto loans becoming delinquent, the highest since 2011 and 2010, respectively. The debt increase is largely due to persistent inflation and high interest rates, which have strained household finances.
Housing affordability has also collapsed under the weight of Kamalanomics due to skyrocketing home prices and high mortgage rates. It is likely to become a significant issue in the 2024 election.
The median home price when Biden-Harris took office was $331,000; it was $439,000 in July 2024, an increase of 33%. The home price-to-income ratio has reached a record high of nearly 6-to-1. The monthly mortgage payment on a median-priced home has increased 115% under Harris. According to a recent analysis by the real estate site Redfin, prospective homebuyers need an annual income of $113,520 to afford a typical house in the U.S., which is 35% higher than the average household income of $84,072.
Nearly half of all renters spend more than 30% of their income on rent, with a quarter spending over 50%, making it difficult to save for a down payment.
Inflation is hitting wallets hard. The LendingTree survey found that 78% of consumers view fast food as a luxury purchase because of rising costs, with 62% eating it less frequently. Americans adopt various strategies in their struggle to adjust to higher food costs. Some concerning trends include 31% eating less (reducing portion sizes) and 24% skipping meals.
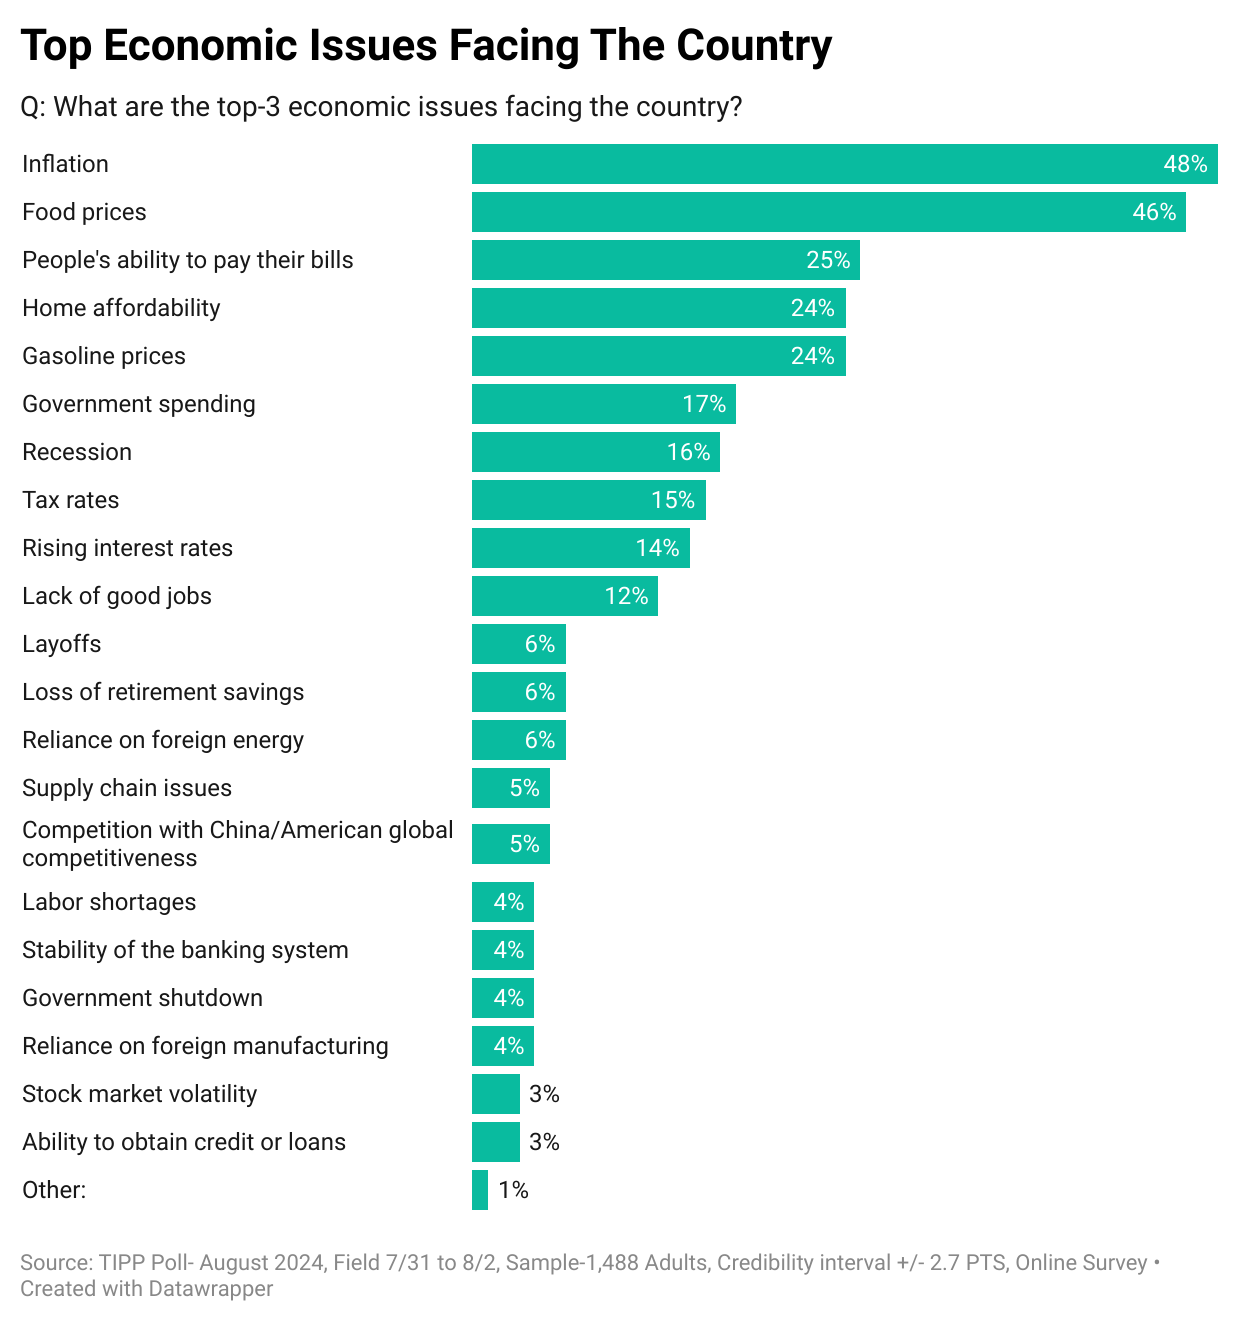
Therefore, it is unsurprising that inflation and food prices emerged as the top economic issues among Americans in a recent nationwide TIPP Poll.
CPI Report
The government's Consumer Price Index (CPI), released on Wednesday, showed a 2.9% year-over-year price increase from July 2023 to July 2024.
The CPI rate declined steadily for 12 consecutive months, from a 40-year high of 9.1% in June 2022 to 3.0% in June 2023. An increase to 3.2% in July 2023 interrupted this trend. Since then, the CPI rate has fluctuated, with the lowest reading of 2.9% in July 2024.
After adjusting for seasonality, the Consumer Price Index (CPI) increased by 0.2% between June 2024 and July 2024, following a decline in June - the first time in more than four years. During the same period, food prices increased by 0.2%, energy prices stayed steady with no change, and core prices (all items except food and energy) increased by 0.2%.
Here's a sampling of headlines when the CPI report came on Wednesday:
Battle to kill inflation appears all but over, CPI report confirms - Axios
Inflation Is Flat & The Consumer Is Strong: Is This A ‘Goldilocks’ Economy? - Forbes
Wow! All but over? As we explain in this article, the irony is that the cooling down is driven by the 'Base Effect.' Furthermore, our trend analysis later in this article shows that July was not a good month. As the saying goes, 'There are three kinds of lies: lies, damned lies, and statistics.' Readers should be aware that we are in an election season, and the media may be trying to paint a rosy picture of the economy to help Harris get elected.
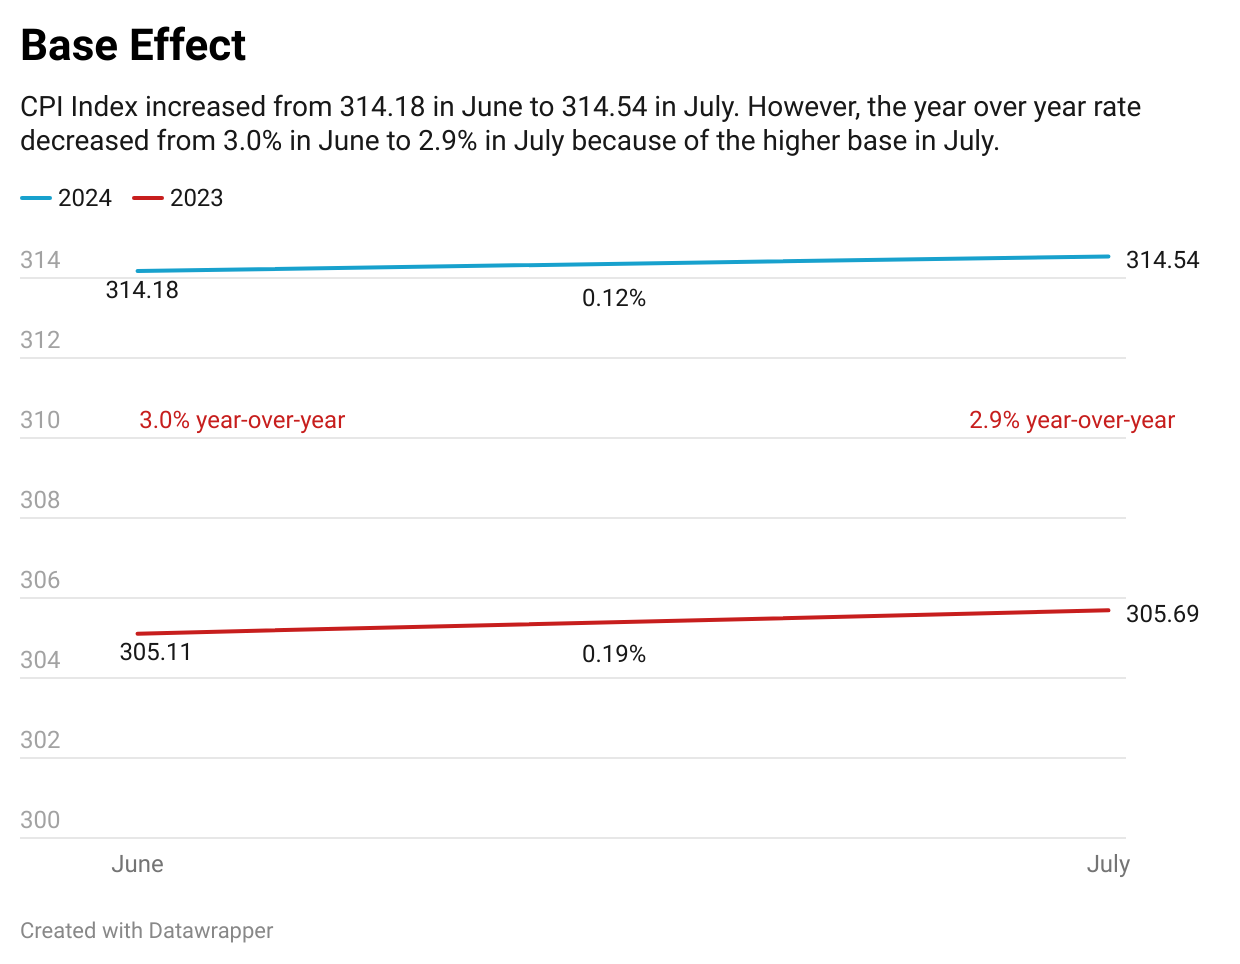
If you dig deeper, you will notice that the apparent improvement in the inflation situation is an illusion due to the Base Effect. The CPI Index increased from 314.18 in June to 314.54 in July this year, a 0.12% increase. However, during the same period last year, it had increased at a sharper rate of 0.19%, from 305.11 in June to 305.69 in July. The "base effect" creates the illusion of improvement, making it seem that the decrease in the inflation rate from 3.0% in June to 2.9% in July is an improvement, even though inflation persists at a slightly worse level on the CPI Index. The media has not yet widely acknowledged this observation.
TIPP CPI
We developed the TIPP CPI, a metric that measures the rate of change using February 2021, the month after President Biden's inauguration, as the base. All TIPP CPI measures are anchored to this month, making them exclusive to the economy under Biden-Harris.
What is the motivation behind the TIPP CPI?
The official BLS CPI year-over-year calculations compare prices to already inflated bases, and these statistics could mask the full impact. Further, the media and some economists frequently use the low CPI rate to present a rosy economic outlook supporting Biden-Harris policies.
In contrast, the TIPP CPI rate offers a clearer understanding of Americans’ economic challenges under Biden-Harris. We use the relevant data from the Bureau of Labor Statistics (BLS) to calculate the TIPP CPI, but we adjust the period to Biden-Harris tenure. When discussing the TIPP CPI and the BLS CPI, we convert the index numbers into percentage changes to better understand and compare them. CPIs are like index numbers that show how prices affect people's lives, similar to how the Dow Jones Industrial Average reflects the stock market.
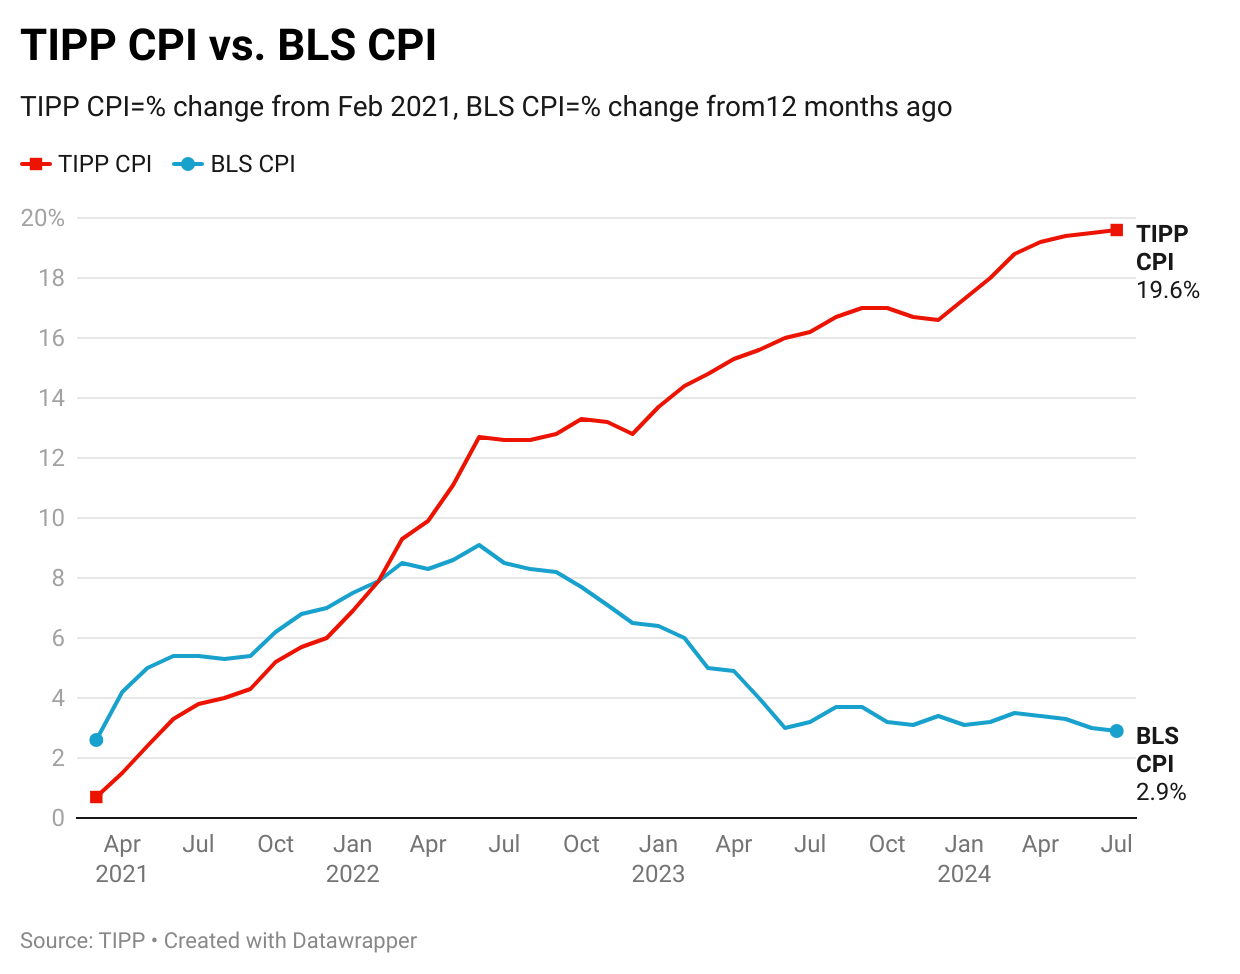
Kamalaflation, measured by the TIPP CPI using the same underlying data, increased to 19.6% in July. It was 19.5% in June, 19.4% in May, 19.2% in April, 18.8% in March, 18.0% in February, 17.3% in January, and 16.6% in December.
TIPP CPI vs. BLS CPI
The following two charts present details about the new metric.
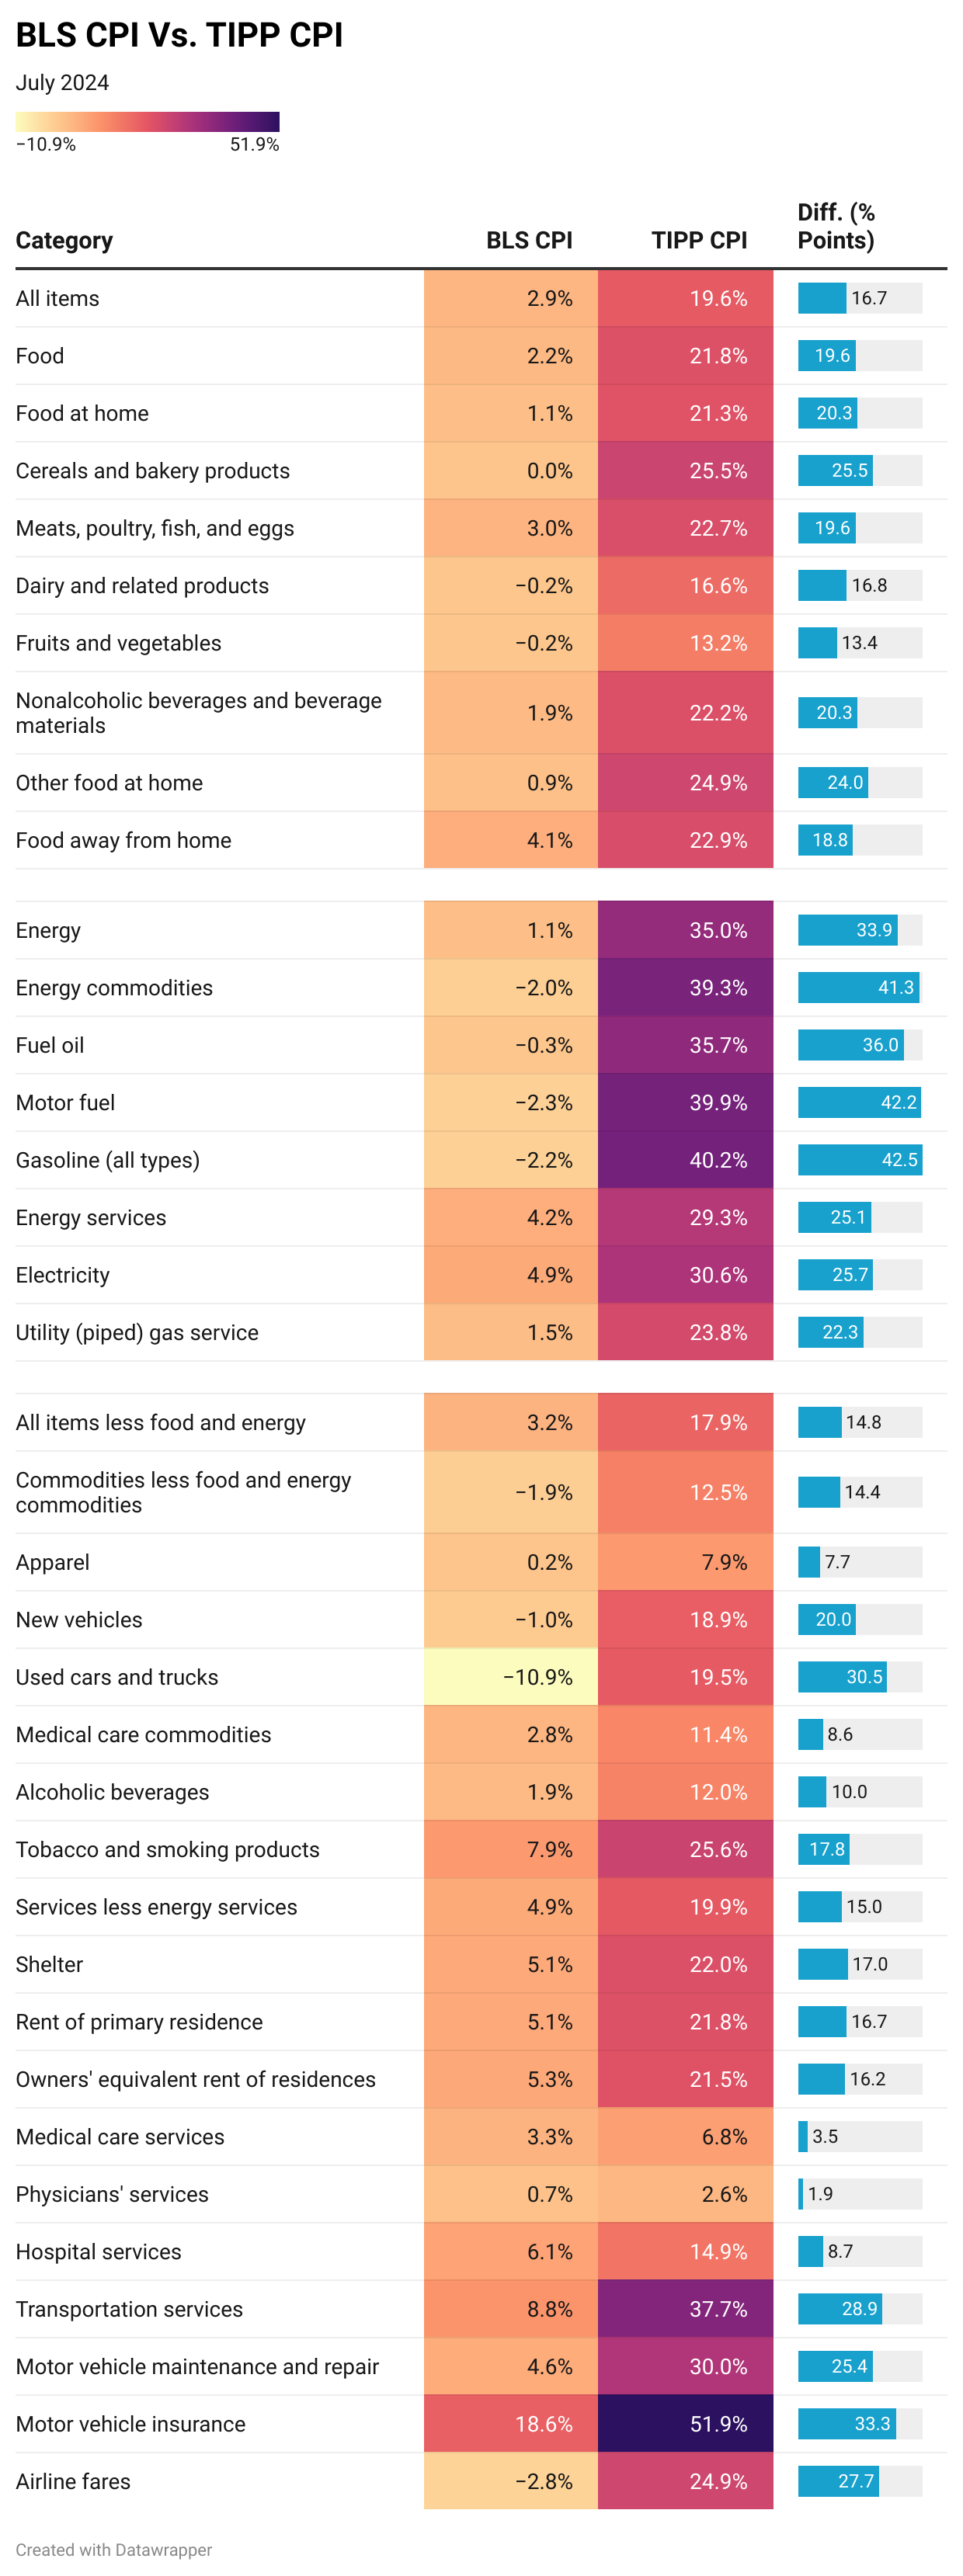
For July 2024, the BLS reported a 2.9% annual CPI increase. Compare this to the TIPP CPI of 19.6% - a 16.7-point difference. Prices have increased by 19.6% since Biden-Harris took office. On an annual basis, the TIPP CPI rate is 5.6%.
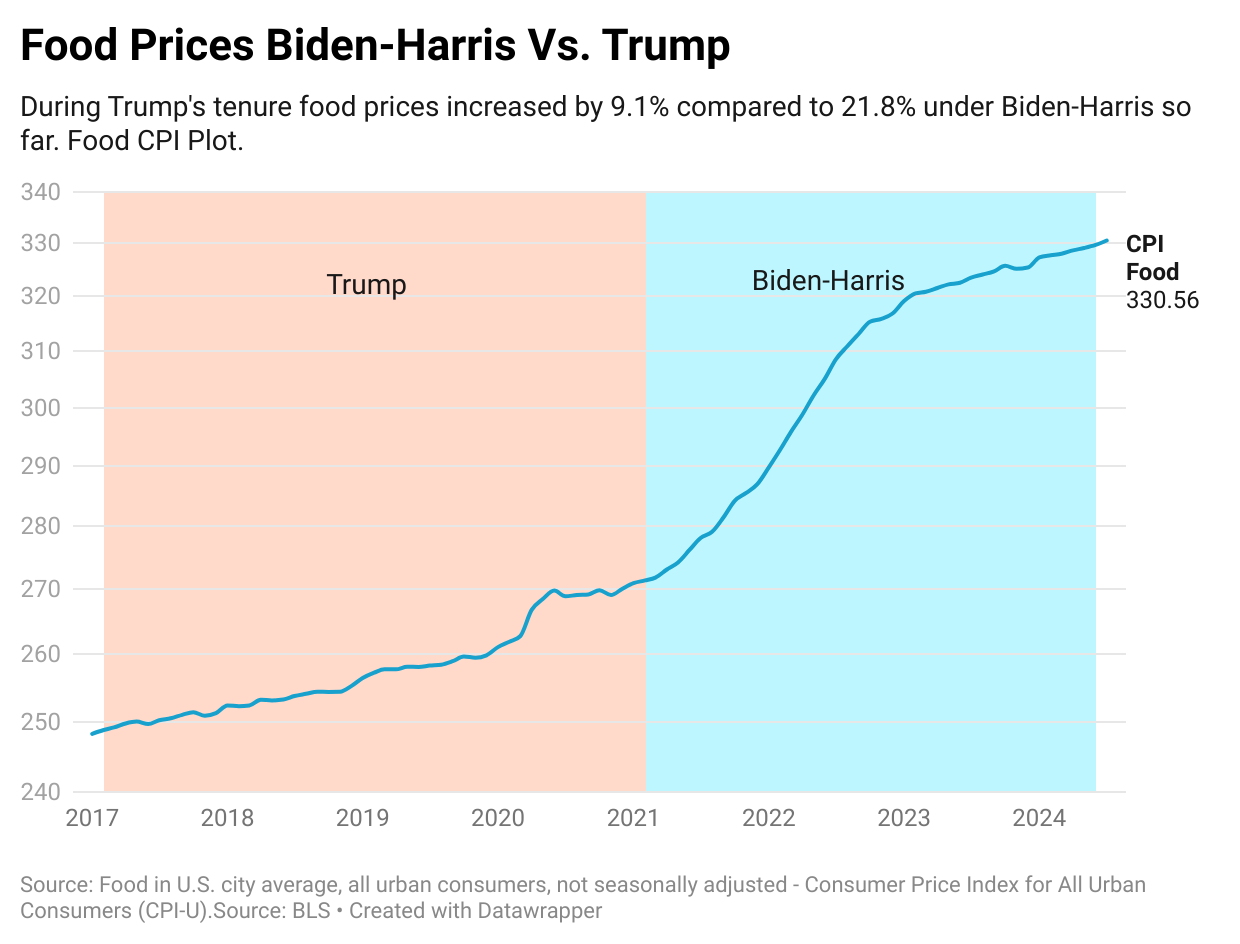
Food prices increased by 21.8% under Biden per TIPP CPI, compared to only 2.2% as per BLS CPI, a difference of 19.6 points.
TIPP CPI data show that Energy prices increased by 35.0%. But, according to the BLS CPI, energy prices rose by 1.1%. The difference between the two is a whopping 33.9 points.
The Core CPI measures the price increase for all items, excluding food and energy. The Core TIPP CPI is 17.9% compared to 3.2% BLS CPI, a 14.8-point difference.
Further, gasoline prices have increased by 40.2% since Biden-Harris took office, whereas the BLS CPI shows that they have declined by 2.2%, a difference of 42.5 points.
Shelter costs rose by 22.0% under Biden-Harris’s watch, compared to the BLS reading of 5.1%, a difference of 17.0 points.
TIPP CPI finds that Used car prices have risen by 19.5% during the current administration. Meanwhile, the BLS CPI reports that the prices have dropped 10.9%, a difference of 30.5 points.
Air ticket inflation is 24.9% compared to the BLS CPI’s finding of an improvement of 2.8%, a difference of 27.7 points.
Motor vehicle insurance increased 51.9% compared to the BLS CPI’s increase of 18.6%, a difference of 33.3 points.
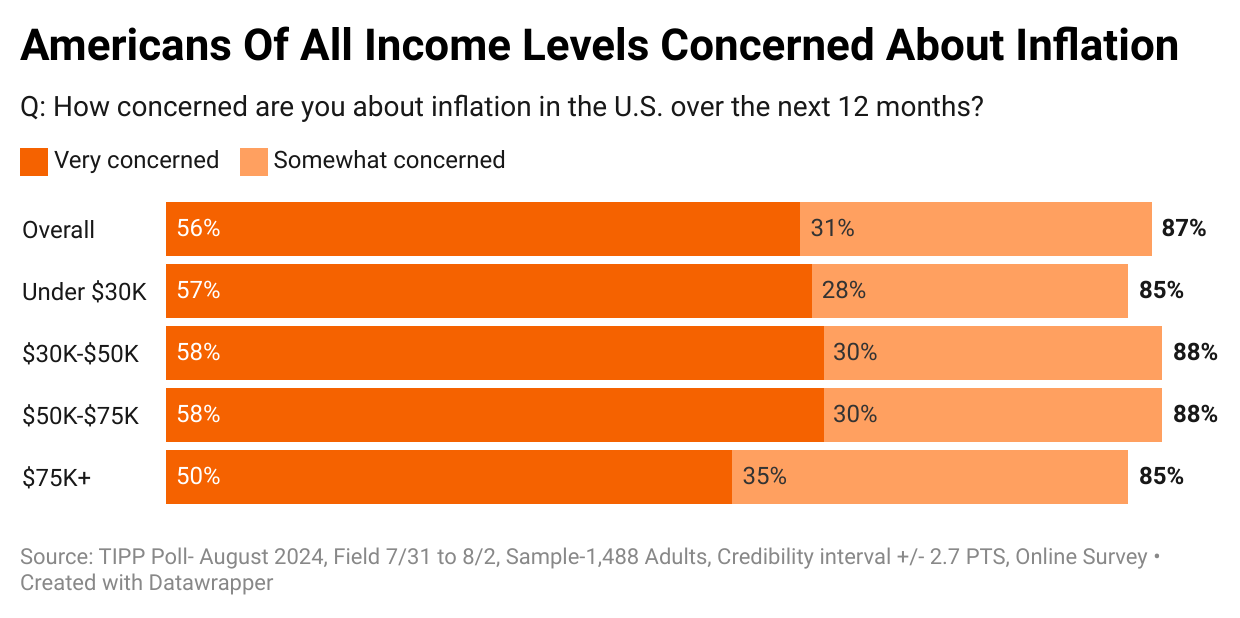
The latest TIPP Poll, completed in early August, shows that nearly nine in ten (87%) survey respondents are concerned about inflation. As the chart below shows, the concern is shared by all income levels. Also, at least 50% of all income levels are “very concerned.”
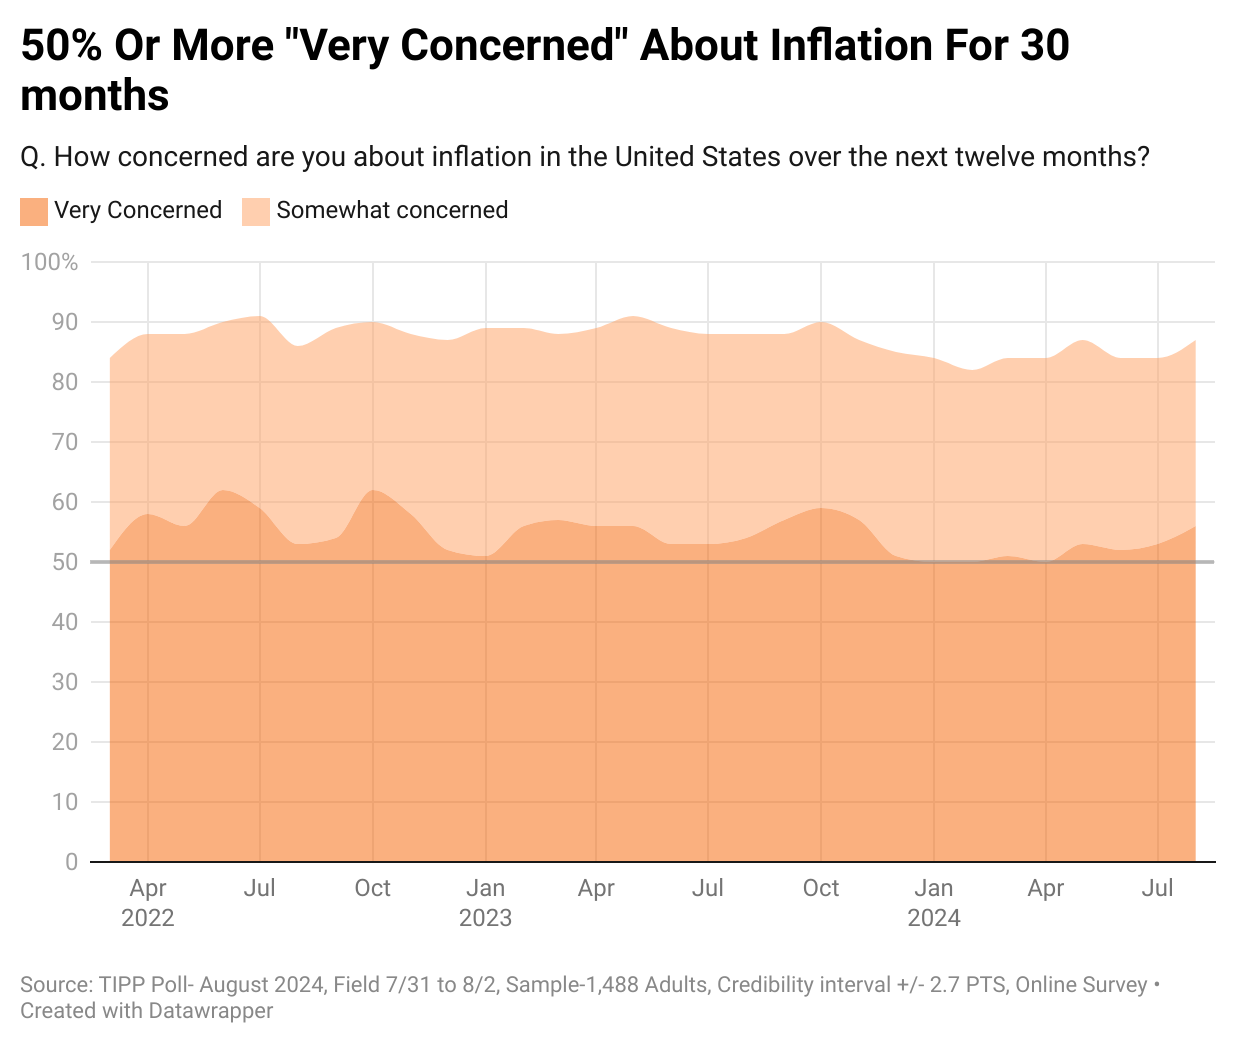
Moreover, since January 2022, inflation concerns have stayed above 80%. The "very concerned" share has been at least 50% since March 2022, i.e., for thirty months.
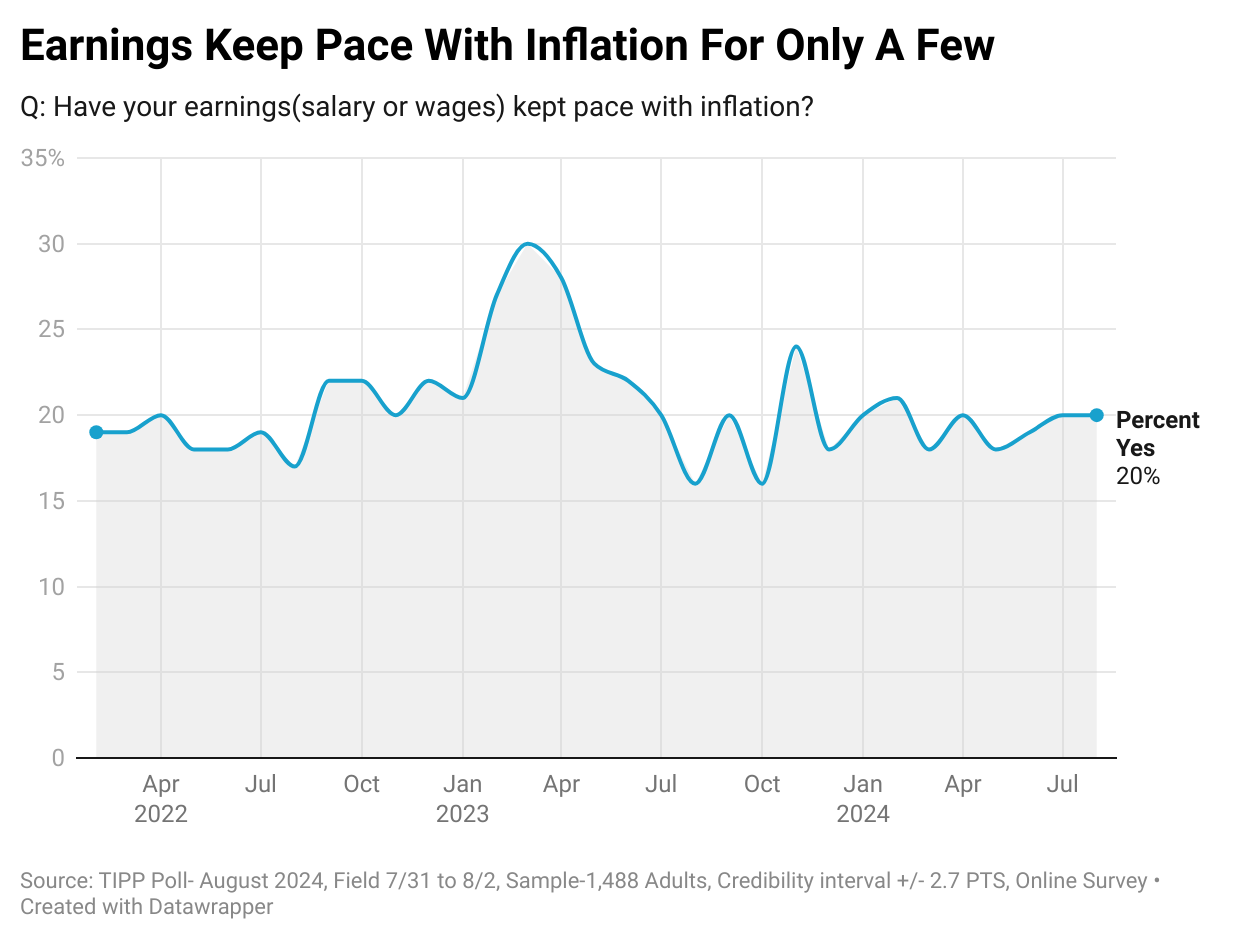
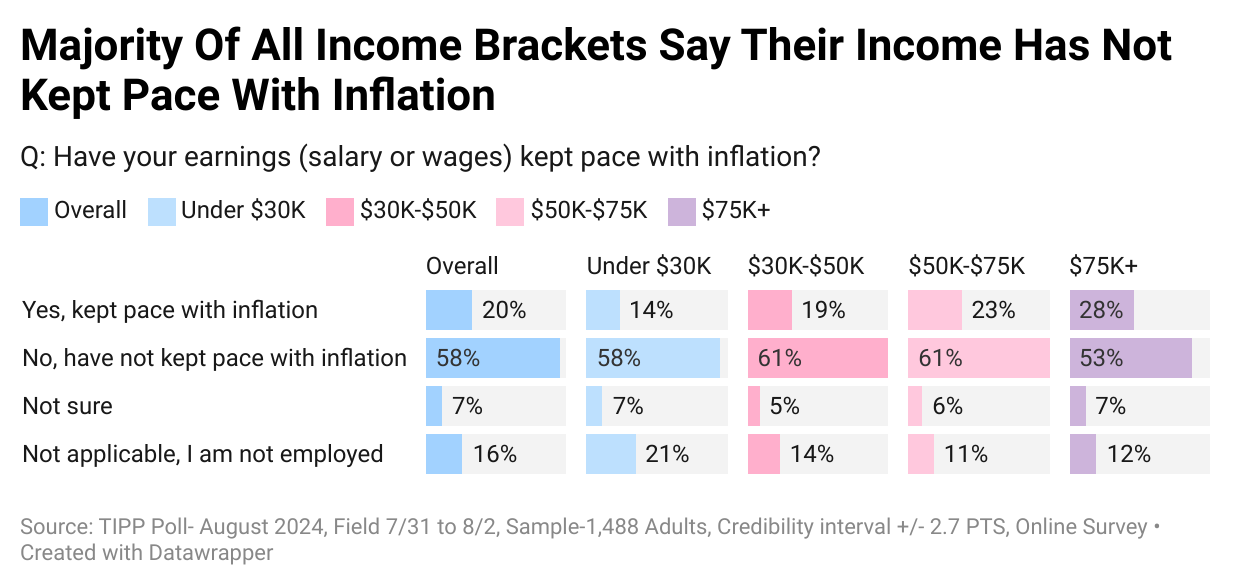
Over half (58%) say their wages have not kept up with inflation, while only one in five (20%) say their income has. Since December 2023, this statistic has moved in a tight 18% to 21% range.
Our data shows that the majority of households in all income brackets are likely to say that their earnings have not kept pace with inflation: 58% for households under $30K, 61% for households $30K to $50K, 61% for households $50K to $75K, and 53% for households $75K+.
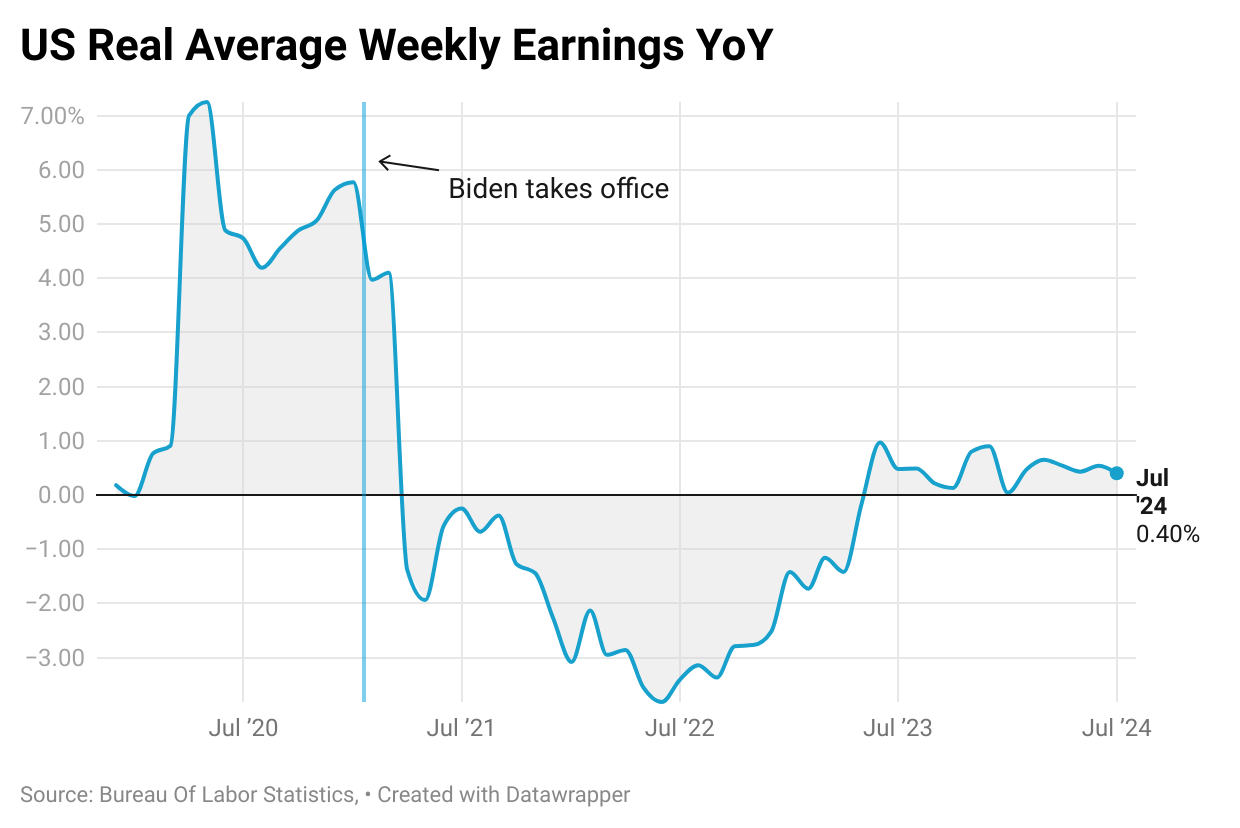
Nominal wages represent the amount of money one earns without considering changes in the cost of living. On the other hand, real wages consider inflation and measure the purchasing power of wages. Real wages provide a more accurate reflection of what is affordable with the income earned by factoring in the changes in the cost of living.
Real weekly wages, measured year-over-year, showed negative readings for 26 out of the 42 months during the Biden presidency from February 2021 to June 2024. The 26-month negative streak was broken in June 2023. Since then, the measure has posted positive readings.
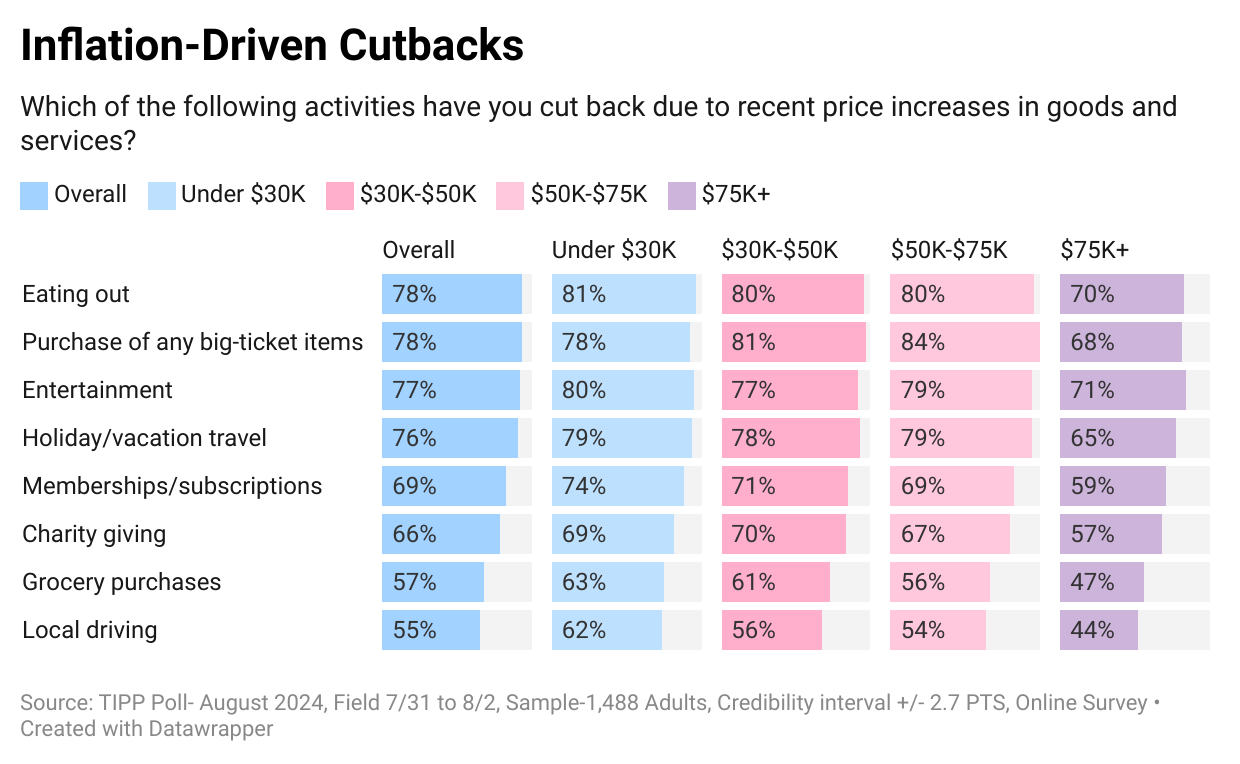
As a result of inflation, Americans are cutting back on household spending.
They are cutting back on eating out (78%), purchasing big-ticket items (78%), entertainment (77%), holiday/vacation travel (76%), and memberships/subscriptions (69%).
Nearly two-thirds (66%) are cutting back on charity giving. Over half (57%) of households spend less on groceries, and the high gasoline prices forced 55% to cut back on local driving.
The cutbacks are more prevalent among lower-income households than their higher-income counterparts.
Inflation Direction
The chart below compares the 12-month average of monthly changes against the 6-month and the 3-month averages. We also show the reading for July 2024.
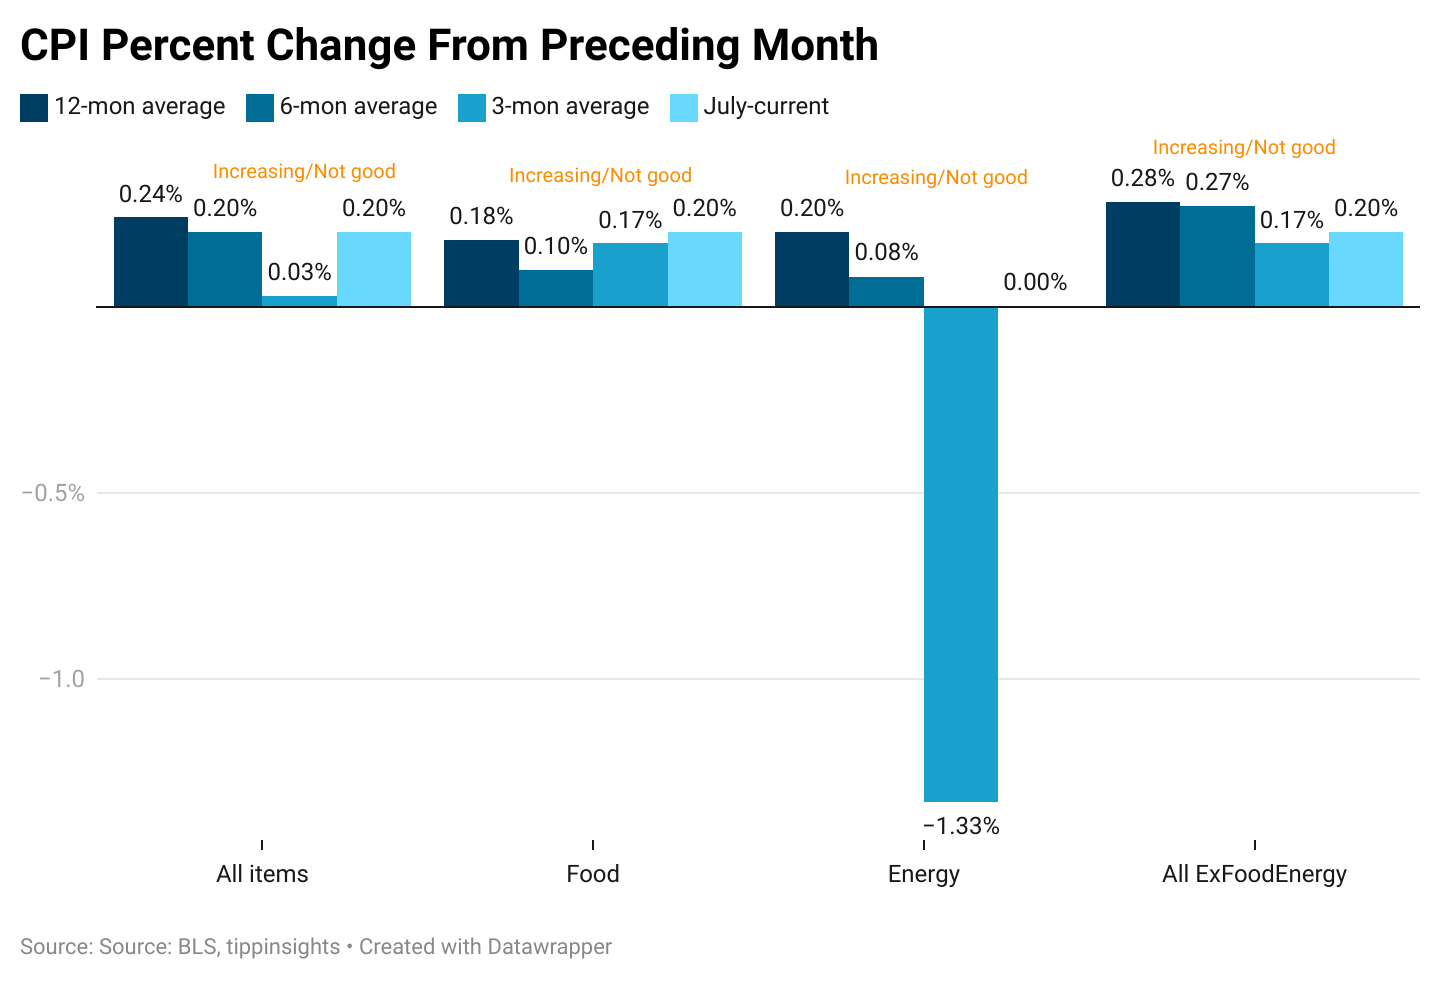
The 12-month average considers 12 data points and presents a long-term reference, while the six-month and three-month averages consider recent data points.
Typically, we compare the July 2024 data to the three-month average to gain a clearer perspective. In July 2024, the all-items category increased by 0.20%, greater than the three-month average of 0.03%. This indicates a worsening in July.
Meanwhile, the three-month average of 0.03% is smaller than the six-month average of 0.20%, indicating a recent slowdown over the last three months. Furthermore, the six-month average of 0.20% is smaller than the twelve-month average of 0.24%. Therefore, the data presents a mixed picture, with a weakening in July.
In July, Food prices increased by 0.2%, higher than the three-month average of 0.17%. Further, the three-month average is bigger than the six-month average of 0.10%, so the July increase is concerning.
Meanwhile, Energy prices stayed steady with no decline (0%) compared to the three-month average of 0.33%, indicating prices stopped dropping. The three-month average is lower than the six-month average of 0.08% and the twelve-month average of 0.20%. In summary, the data presents a mixed trend.
All items less food and energy, known as "core inflation," was 0.20%, higher than the three-month average of 0.17%. However, the three-month average of 0.17% was lower than the six-month average of 0.27%. The data here again shows a mixed trend with a weakening in July.
In summary, the prices of food, energy, core, and all items weakened in July. Thus, based on our trend analysis, July was not a good month.
Monetary Policy
The Federal Reserve's ongoing efforts to control inflation by maintaining high interest rates contribute to the financial strain.
Since March 2022, the Fed has raised interest rates 11 consecutive times, bringing its benchmark interest rate to 5.25%, the highest level in 22 years.
With the core CPI entrenched at 3.2% and geopolitical tensions that could lead to volatility in the energy markets, we are unsure of what lies ahead. We believe it won't be easy to bring CPI inflation down to the Fed's target of 2.0%.
Michelle Bowman, a member of the Federal Reserve, expressed caution about a potential rate cut in September 2024. She feels inflation is “uncomfortably above” the 2% target. While inflation has been decreasing, Bowman believes the Fed should be patient and data-driven and wait until the end of the year for a possible rate cut. Key factors influencing this decision include slowing economic growth, mixed consumer spending, and a loosening labor market. Further, Bowman highlighted risks from geopolitical tensions and housing inflation, suggesting that a rate cut in September may be too optimistic.
Fiscal Policy
The national debt recently crossed $35 trillion, according to the Debt to the Penny dataset, which the Treasury updates daily. For the current fiscal year, which began in October 2023, the U.S. is expected to pay over $1 trillion in interest, more than the U.S. defense budget.
Most Americans are concerned about the sustainability of this trajectory. The high interest rates are also hurting Americans and sapping their confidence.
Monetary policy alone can’t fix inflation without fiscal austerity.
Inflation is here to stay. Coupled with a slowing economy, “the stag,” expect Kamalaflation to transform into stagflation.
Your feedback is incredibly valuable to us. Could you please take a moment to grade the article here?
To access the TIPP CPI readings each month, you can visit tippinsights.com. We'll publish the TIPP CPI and our analysis in the days following the Bureau of Labor Statistics (BLS) report. The upcoming release of TIPP CPI is on September 14, 2024. We'll also post a spreadsheet in our store for download.
Hey, want to dig deeper? Download data from our store for a small fee!


