
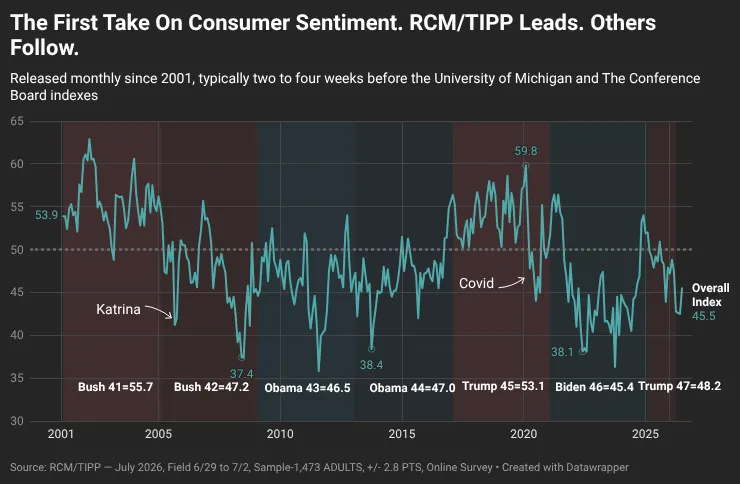
The RealClearMarkets/TIPP Economic Optimism Index is the earliest take on consumer confidence each month and predicts with high reliability monthly changes in sentiment in well-known polls by The Conference Board and the University of Michigan.
Began in February 2001, the Indices were developed by TIPP for its media partners Investor's Business Daily and The Christian Science Monitor and are updated on a monthly basis.
RealClearMarkets (RCM) is the current sponsor of the TIPP Economic Optimism Index from November 2023. Investor's Business Daily sponsored from February 2001 to October 2023.
The RCM/TIPP Economic Optimism Index is based on a survey of 1,300-plus adults nationwide using an online survey. The poll is generally conducted in the first week of the month. Between February 2001-February 2020, the survey was conducted by telephone with live interviewers.
TIPP has been recognized as the country's most accurate pollster during the 2004, 2008, 2012, and 2016 U.S. presidential elections. In 2016, the IBD/TIPP Poll was one of only two national polls to correctly call the outcome of the presidential election.
The TIPP Indices (the Economic Optimism Index, the Presidential Leadership Index, and the National Outlook Index) track Americans' opinions and outlooks in three different areas: the economy, the President and the nation.
Index Calculation
Each index represents an average based on telephone interviews conducted with approximately 900 adults nationwide each month. The index can range from 0 to 100, and is derived by comparing the positive and negative responses while disregarding non-responses (such as "not sure" or "no answer").
If the question assumes either one positive or one negative response (better or worse, approve or disapprove), the following formula is used to calculate this question index component:
K= 50 +0.5*(p(+) - p(-))
where p(+) is the percent that answered positively, p(-) is the percent that answered negatively.
If the question allows a choice from two positive or two negative responses (very satisfied, somewhat satisfied, not very satisfied, or not at all satisfied), the following formula is used to calculate this question index component:
K= 50 + 0.5*(p1(+) - p1(-)) + 0.25*(p2(+) - p2(-))
where p1(+) is the percent which answered strongly positive, p1(-) is the percent which answered strongly negative, p2(+) is the percent answered moderate positively, and p2(-) is the percent answered moderately negative.
The question components are averaged to calculate the index. When an index level is more than 50, the number giving a positive response is more than the number giving a negative response. When all answers are strongly positive, the index is 100. When all answers are strongly negative, the index is 0.
The RCM/TIPP Economic Optimism Index
The index measures Americans' sentiment towards the nation's economy using the following three questions:
- In the next six months, do you think that economic conditions in the country will be better, worse, or about the same as now?
- In the next six months, do you think that your personal financial situation will be better, worse, or about the same as now?
- How satisfied are you with the current federal economic policies meant to keep the economy going in the right direction: Very satisfied, somewhat satisfied, not very satisfied, or not at all satisfied?
The TIPP Presidential Leadership Index
The index tracks Americans' views on the U.S. president and is computed based on responses to the following three questions:
- Overall, is your opinion of Donald Trump generally favorable, generally unfavorable, or are you not familiar enough to say one way or another?
- In general, do you approve or disapprove of the way Donald Trump is handling his job as president, or are you not familiar enough to say one way or the other?
- How would you describe the leadership that President Trump is providing for the country? Would you say it is very strong, strong, moderate, weak, or very weak?
The TIPP National Outlook Index
The index is derived on the basis of six components: the scores for the TIPP Economic Optimism Index and the TIPP Presidential Leadership Index, in addition to responses to the following four questions:
- In general, how satisfied are you with the direction that the country is going in at this time? Would you say you are very satisfied, somewhat satisfied, not very satisfied, or not at all satisfied?
- Generally speaking, how satisfied are you with the direction that the country is going in at this time in terms of morals and ethics? Would you say you are very satisfied, somewhat satisfied, not very satisfied, or not at all satisfied?
- Generally speaking, over the next six months, do you think that the position of the United States as a world leader will be better, worse, or about the same as now?
- In the next six months, do you think that your quality of life will be better, worse, or about the same as now?
To derive the final score for the National Outlook Index, we combine the responses to the above questions with the scores for the TIPP Economic Optimism Index and the TIPP Presidential Leadership Index.
The TIPP Indices (the Economic Optimism Index, the Presidential Leadership Index, and the National Outlook Index) track Americans' opinions and outlooks in three different areas: the economy, the President, and the nation.


