
- Inflationary pressures continue to challenge Americans
- Hardship is shared by Americans of all parties and ideologies
- President Biden's economic rhetoric seems disconnected from reality
- RELATED: Bidenflation Soars To 18.8%, Squeezing Americans
The big picture: inflation is a nightmare for Americans. With stagnant wages that have failed to keep pace with price increases, Americans have not been able to adjust to the higher cost of living. Average hourly earnings for all employees dropped 2.5% to $11.11 in March 2024 from $11.39 in January 2021 when Biden assumed office.
Since January 2021, prices have increased by 18.8%, while real wages have declined by 2.5%. According to some estimates, Americans need an extra $12,828 a year to make ends meet.
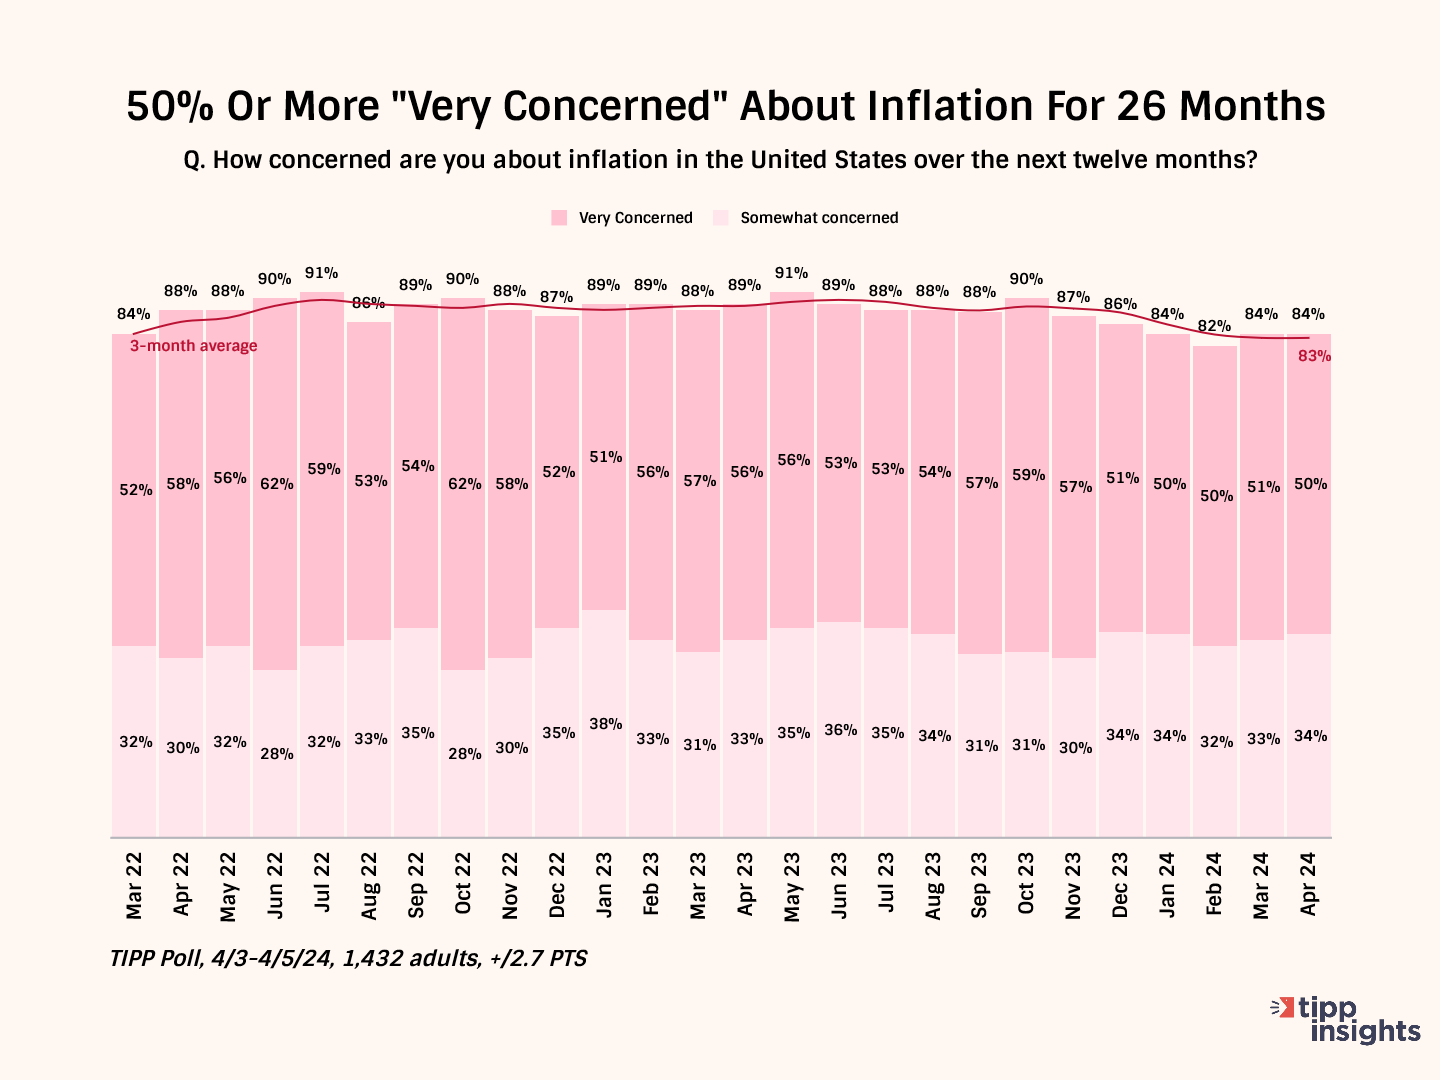
The share of those very concerned has stayed above 50% for 26 months.
Next, we examine inflation’s impact on eight different aspects.
Living Standards
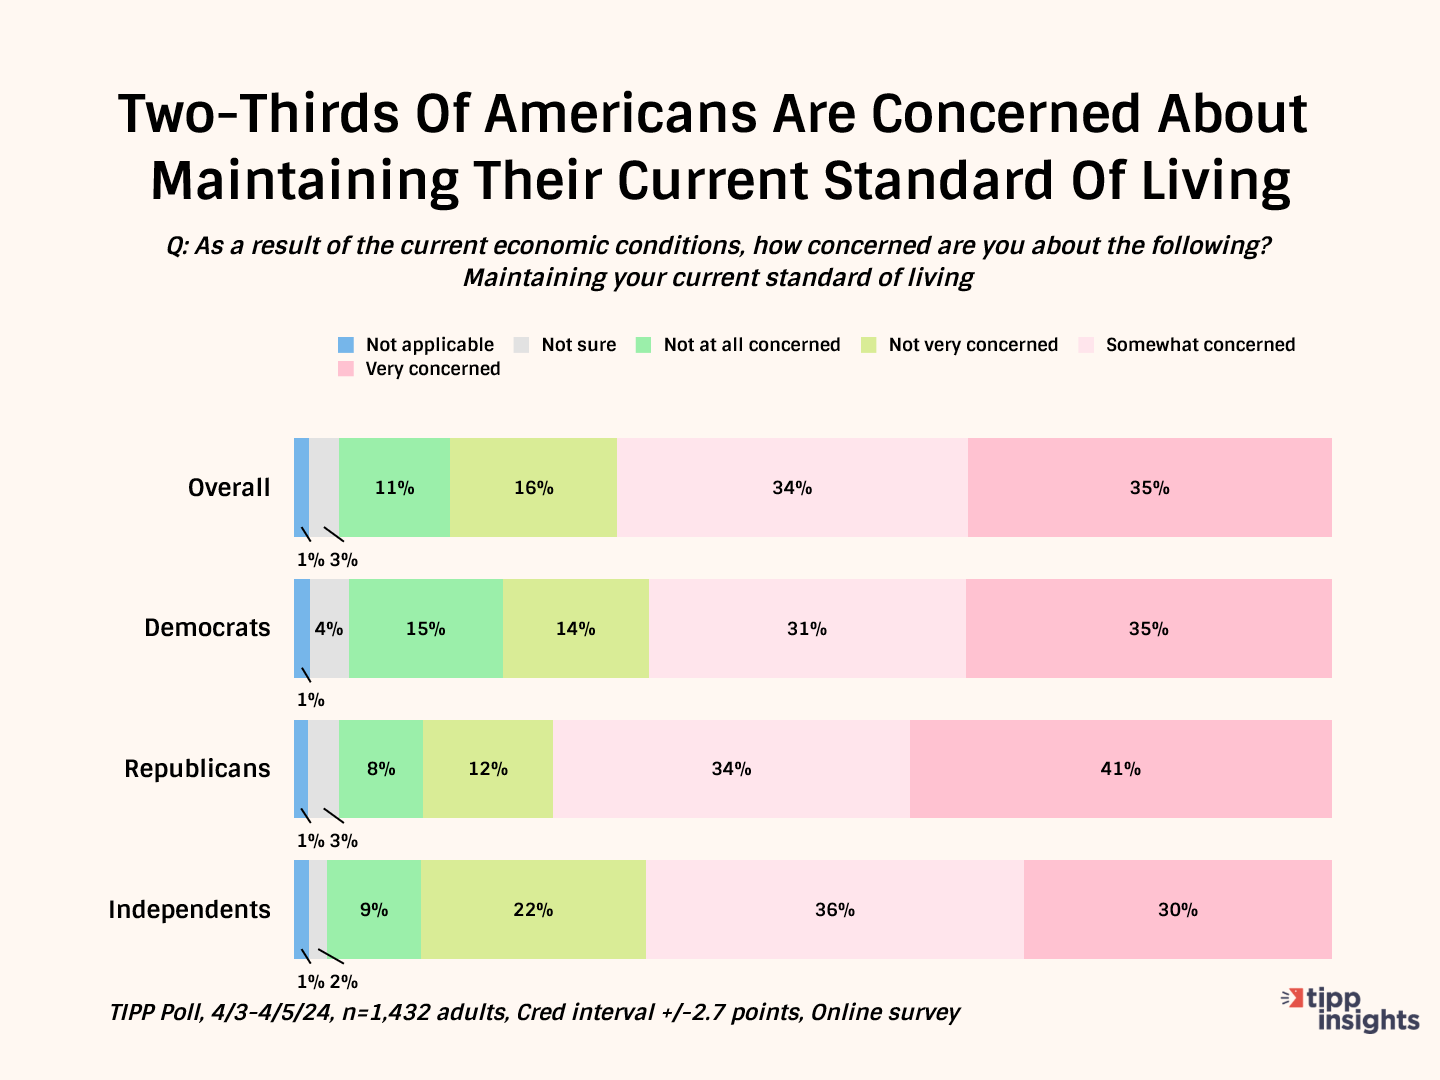
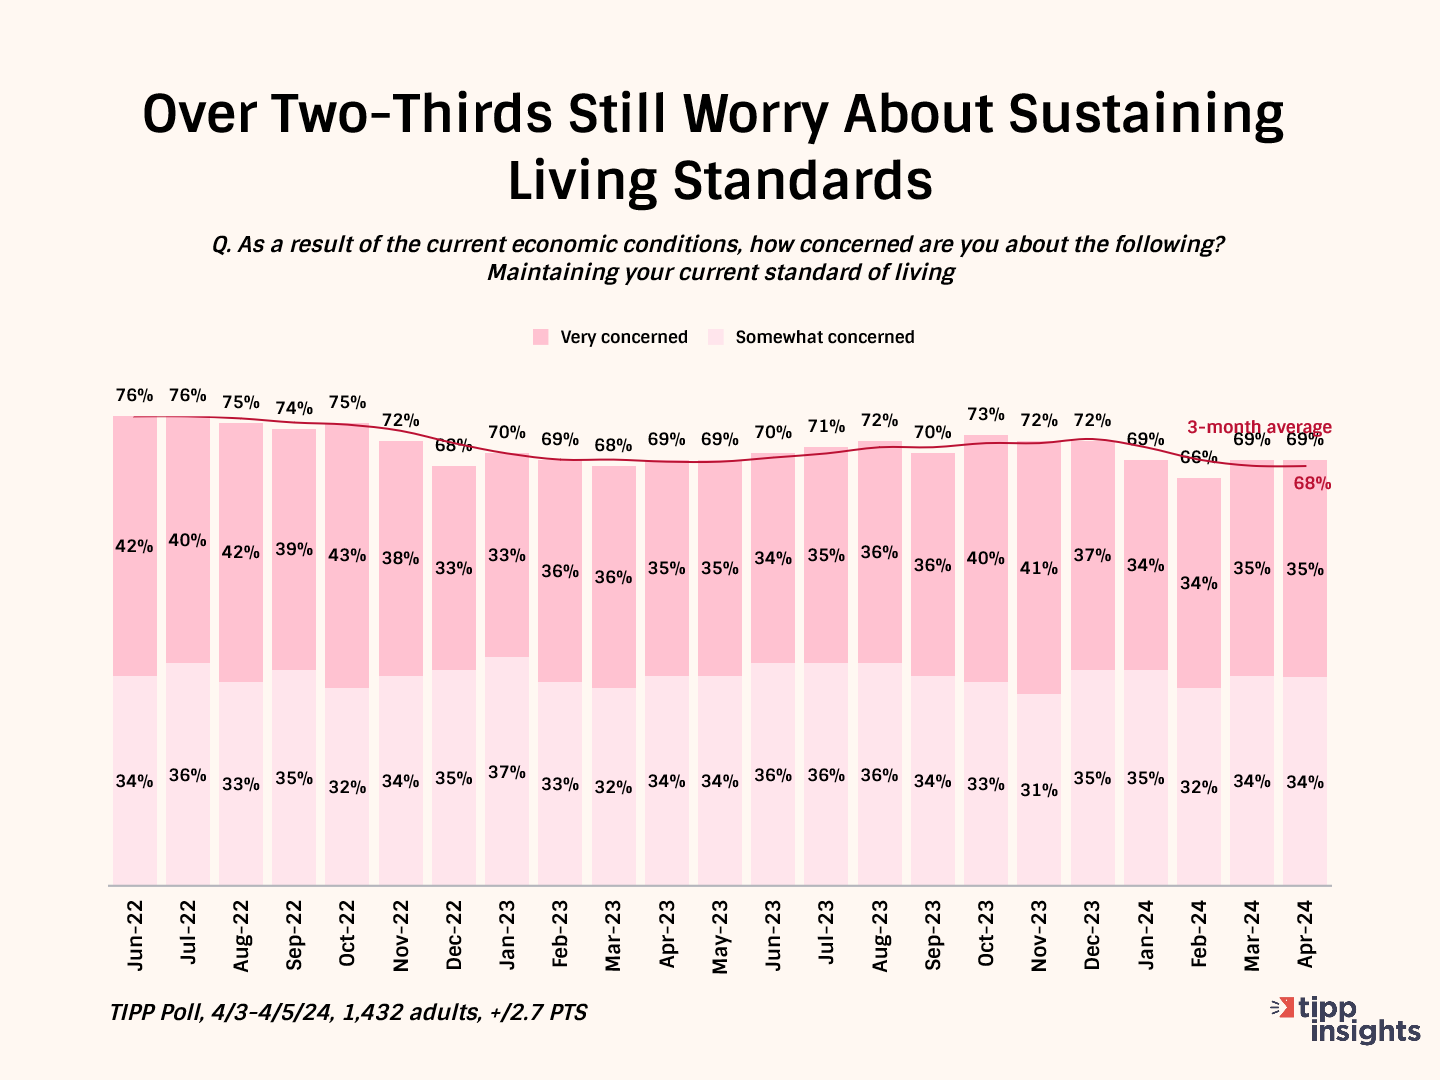
Even though the year-on-year inflation rate has come down from its peak of 9.1% in June 2022 to 3.5% in March 2024, 69% are still concerned about maintaining their living standards.
Note that the concern is across the board: 66% of Democrats, 75% of Republicans, and 66% of independents.
The chart below tracks concerns from June 2022. Notably, the share of those concerned persists in the 66% to 76% range, although the inflation rate has dropped considerably, showing that a significant share of Americans are still struggling.
Utility Bills
The latest TIPP Poll found that a majority of Americans (58%) are concerned about paying their utility bills. Again, this concern is not driven by party affiliation. Fifty-six percent of Democrats, 60% of Republicans, and 56% of independents share the concern.
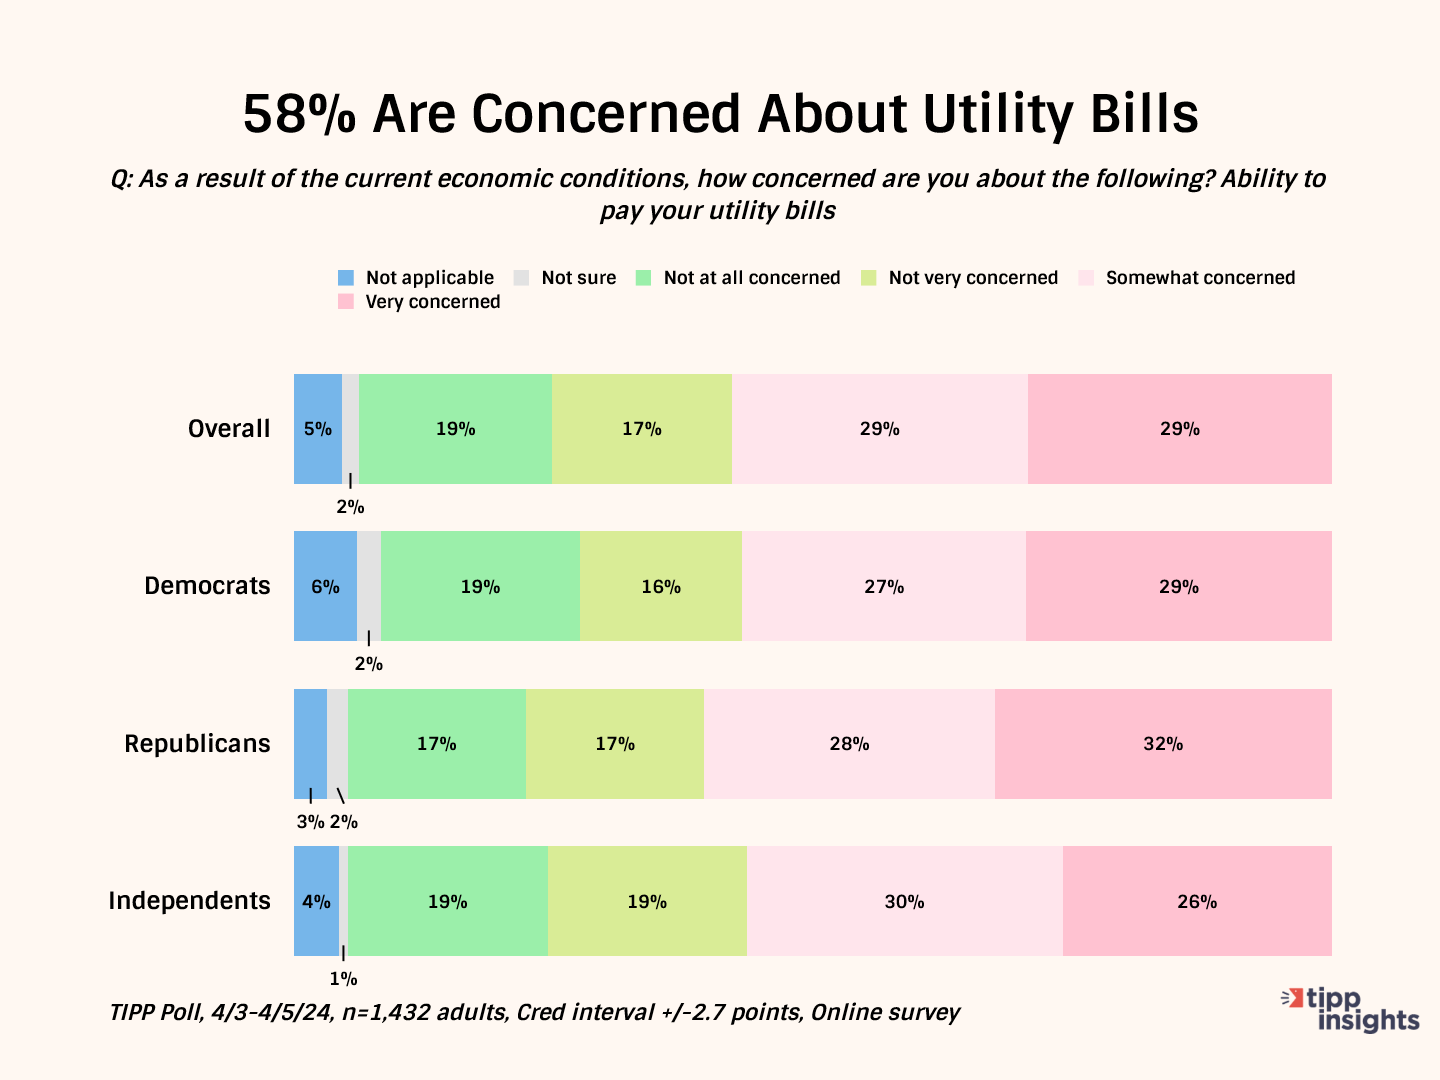
Contrary to the notion of a good economy, the concerns persist in the 53% to 65% range, with the three-month average at 56%.
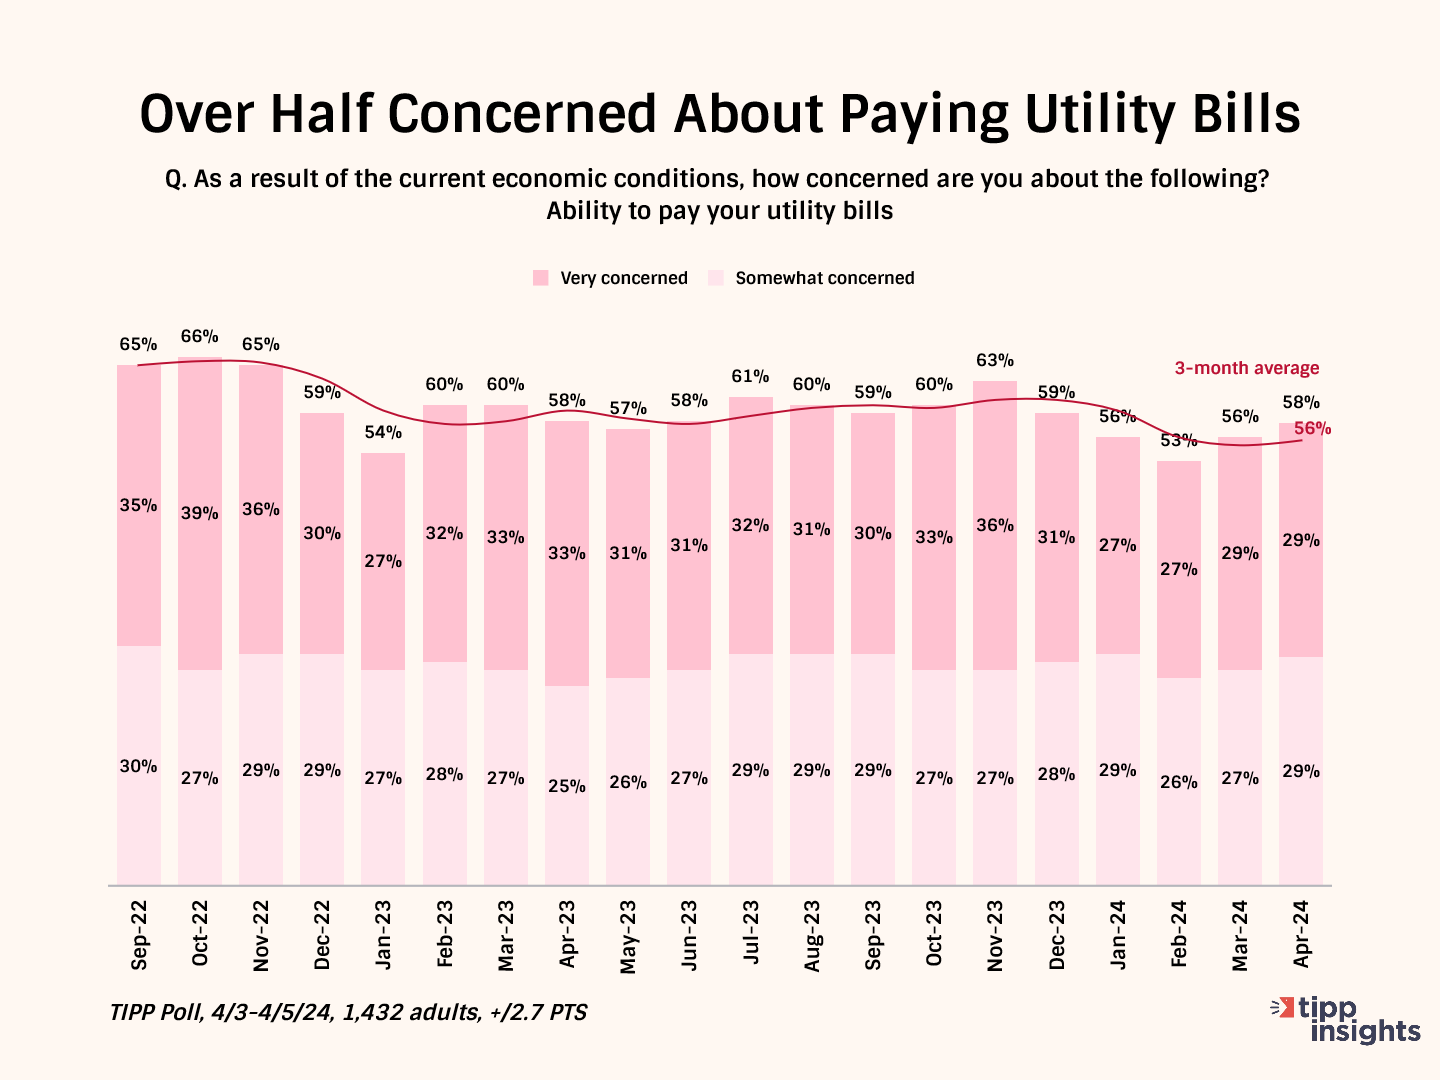
Another recent survey by HOP Energy highlighted Americans' struggles with paying their utility bills. The survey revealed that one in five Americans faces difficulty paying their utility bills on time. Additionally, nearly one in eight (12%) have experienced a utility shut-off due to non-payment.
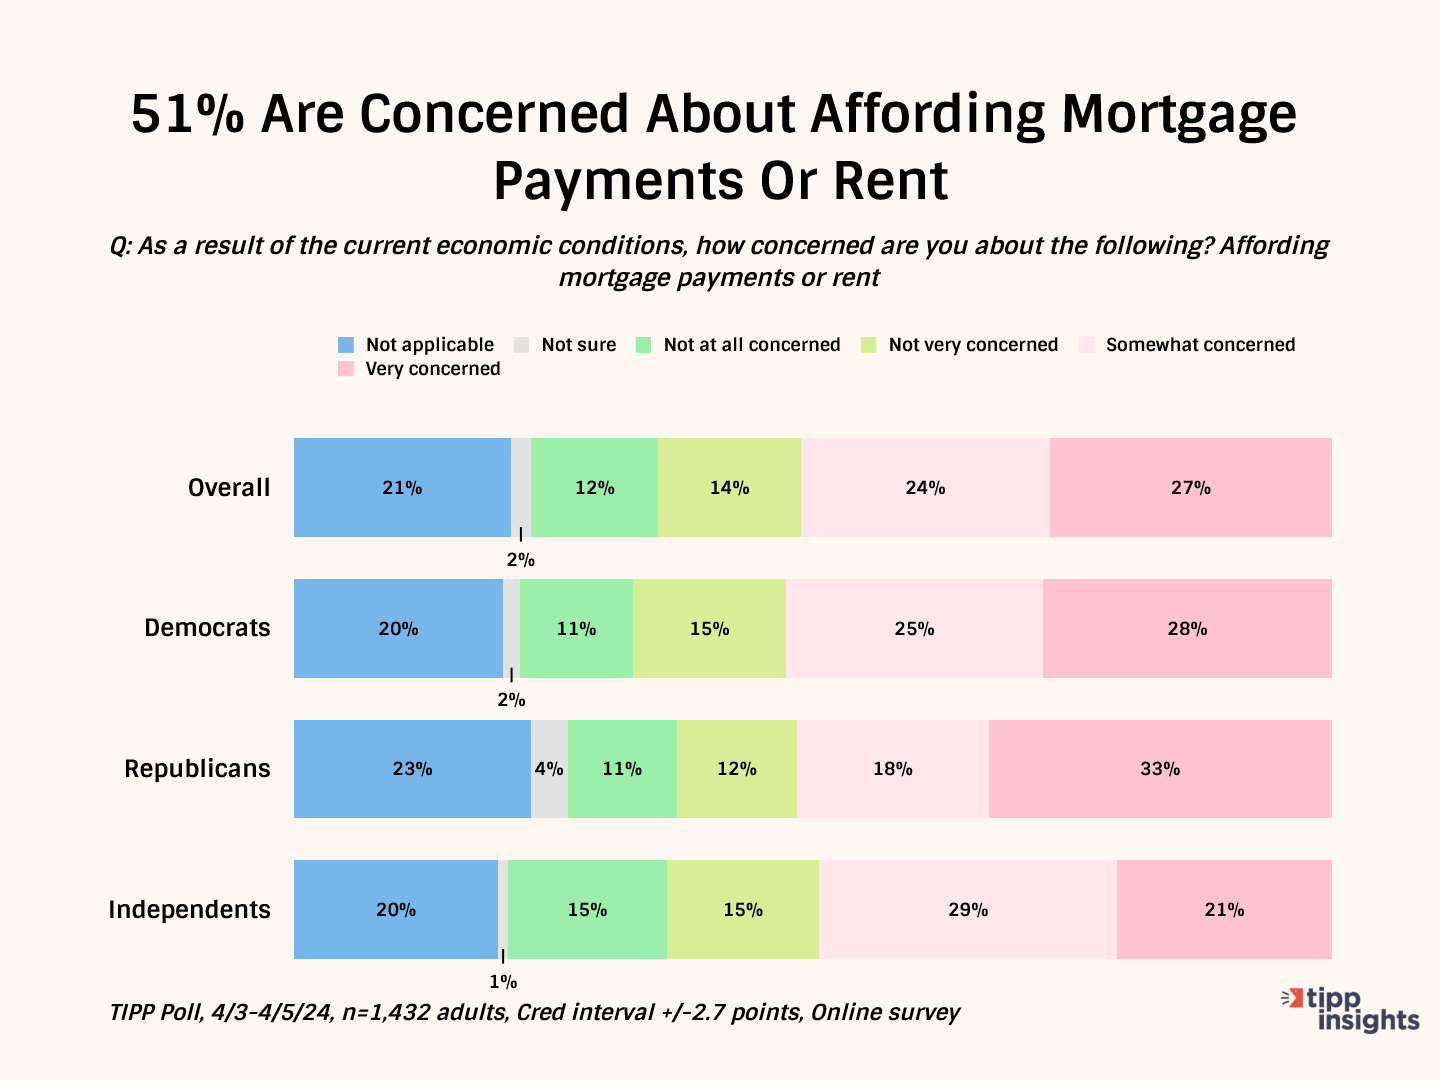
Mortgage/Rent Payments
According to the latest TIPP Poll conducted early this month, over half (51%) are concerned about making mortgage or rent payments. Again, note that this concern is shared across party affiliations—53% of Democrats, 51% of Republicans, and 50% of independents.
The chart below tracks the concern since June 2022. Notice that there has been no significant decrease, and the share concerned hovers in the 48% -55% range, which is inconsistent with the idea of a good economy.
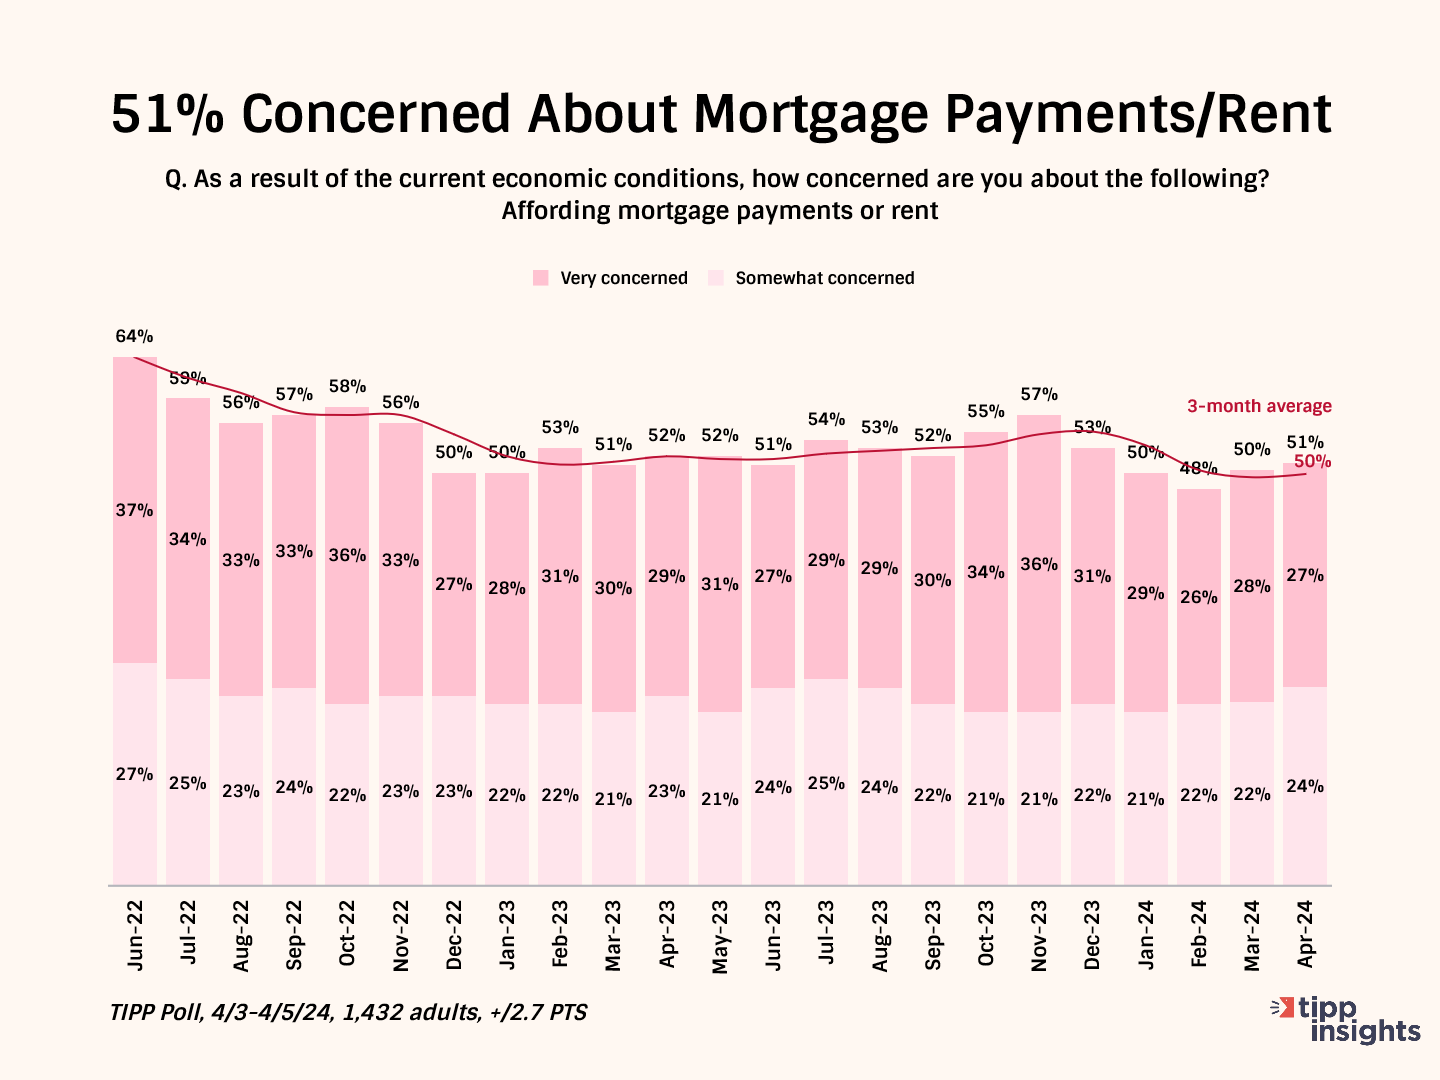
Other surveys support our findings. According to a recent Redfin survey, many homeowners and renters have had difficulty affording housing payments this year, resorting to selling belongings, working extra shifts, and even skipping meals.
Chen Zhao, economics research lead at Redfin, said:
The cost of housing in today's market means some families can no longer afford other essentials, including food and medical care, and have been forced to make major sacrifices.
According to the Mortgage Bankers Association, the national median mortgage payment reached $2,184 in February, up from $2,061 a year prior and $1,750 in February 2022.
According to Rent.com data, median rents also increased to $1,981 from $1,937 a year ago and $1,684 in February 2022.
Recent data from the Transunion credit reporting agency reveals that 1.3% of mortgages are currently 60 days past due, with approximately 1,092,000 Americans falling into this category. This marks a 16% increase from the previous year.
Rising rents hit people in the $45,000 and $74,999 per year income bracket the hardest. According to a recent Harvard study, 41% of their paychecks, on average, went toward rent and utilities.
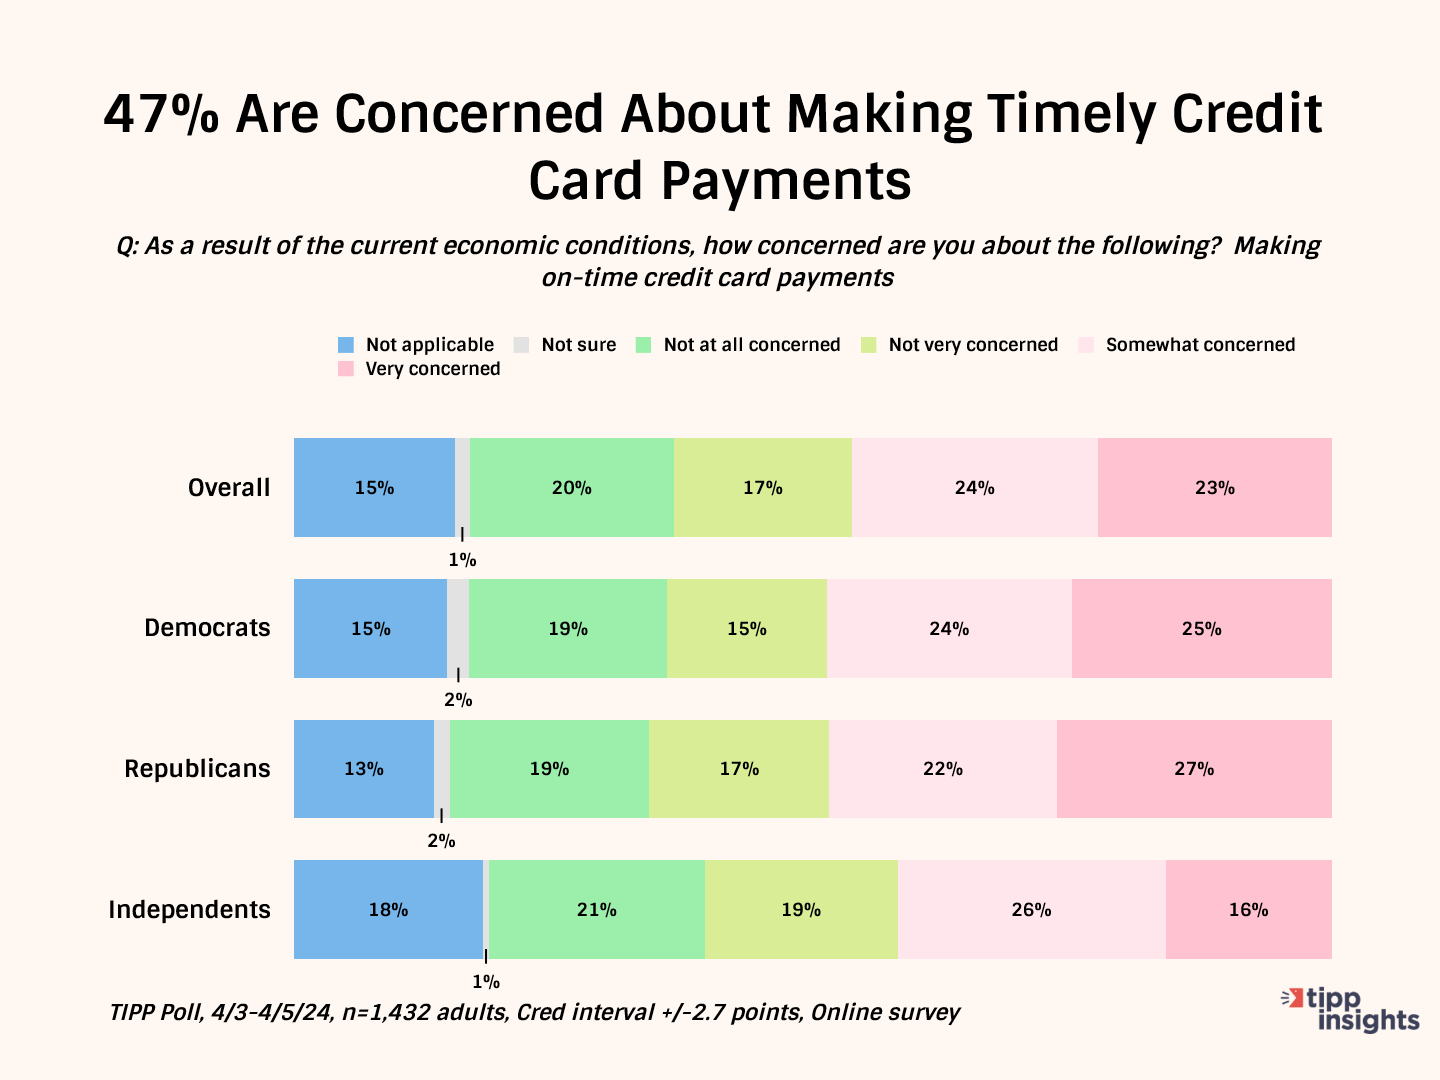
Credit Card Debt
Nearly one-half (47%) of respondents in the latest TIPP Poll are concerned about making timely credit card payments. One in five (23%) is very concerned, and another quarter (24%) is somewhat concerned.
Again, the sentiment is shared across the board by 49% of Democrats, 49% of Republicans, and 42% of independents.
The chart below shows our monthly tracking across the previous years. Notably, 40% to 50% of Americans have shared the concern over the past year.
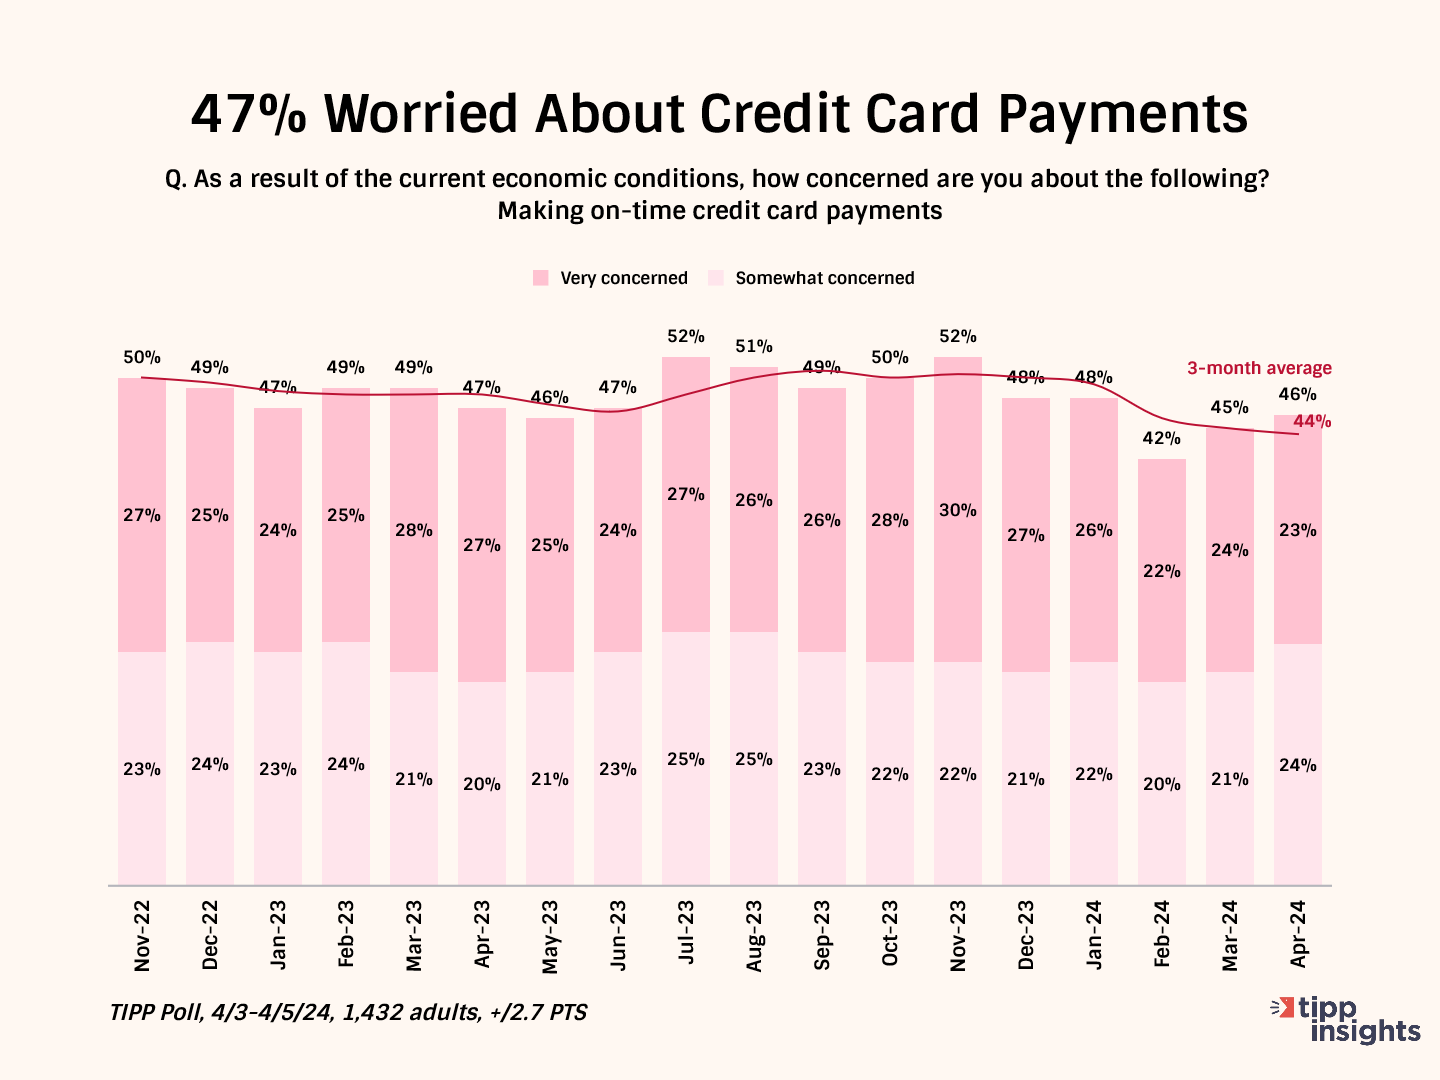
According to a recent survey by Debt.com, one in five (22%) have at least $10,000 to $20,000 credit card debt. Of those, just over 5% have more than $30,000. Further, one in three (35%) say they have “maxed out their credit cards in recent years while inflation and interest rates have increased.”
The Federal Reserve Bank of New York’s latest Household Debt and Credit Report showed Americans held $1.13 trillion in credit card debt as of December. That’s a historic high.
Auto Loan Payments
Many Americans struggle to make timely auto loan/lease payments.
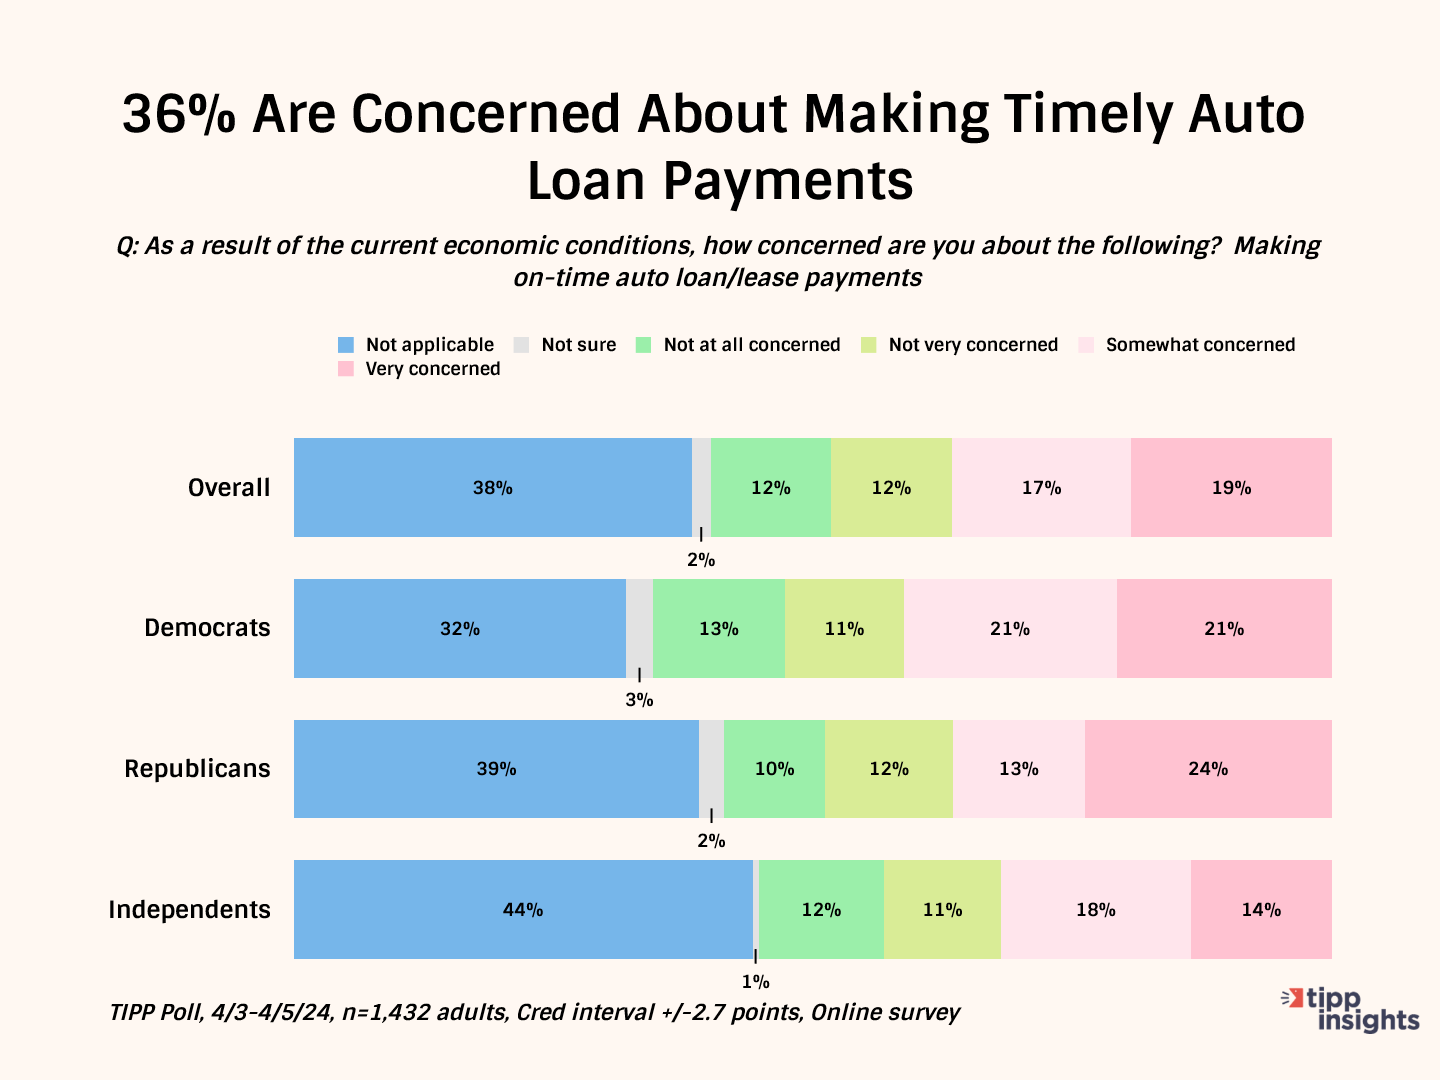
One-third (36%) of TIPP Poll respondents are concerned about making timely auto loan or lease payments. One in five (19%) are very concerned, and another 17% are somewhat concerned. The share of worried among Democrats is 42%, Republicans 37%, and independents 32%.
The chart below tracks the share of concerned Americans since March 2023. The share has remained steady in the 33% to 43% range.
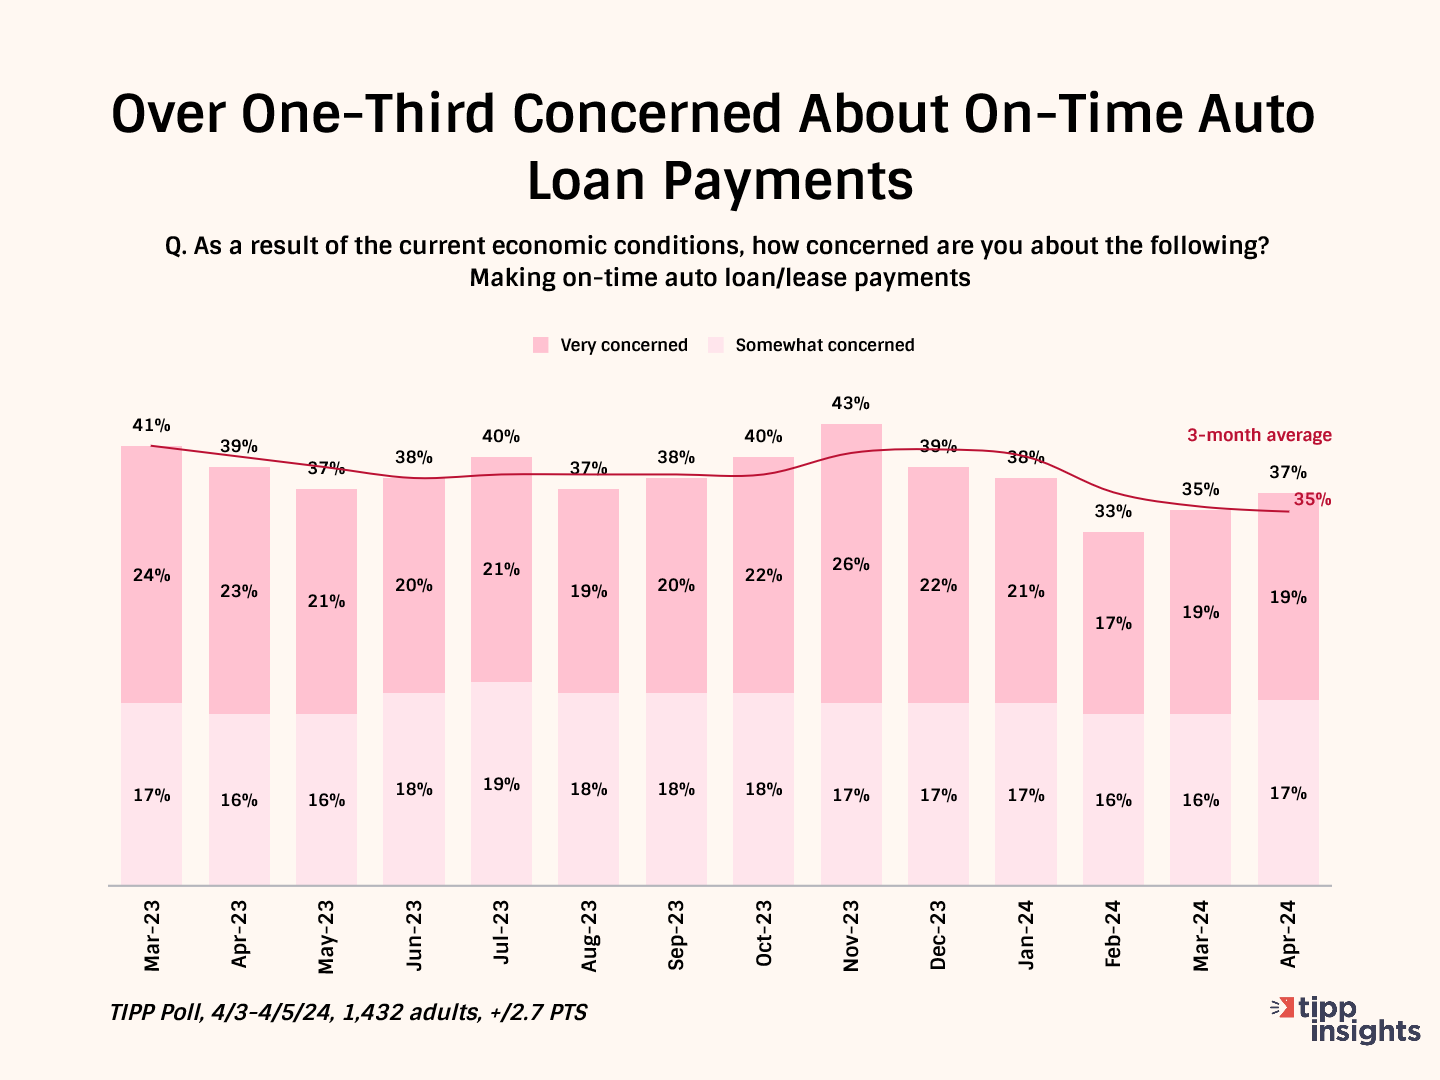
According to recent news stories, car loan delinquency rates have climbed to 7.69%, the highest level since 2010.
The increase in delinquency rate is due to multiple reasons. First, the average cost of a new car now is $48,759. Second, the average interest rate for a new car loan is 7.8%, whereas for a used car, it is 8.6%. With high car prices and interest rates, one in six (17.1%) make car payments of over $1,000 a month.
Medical Costs
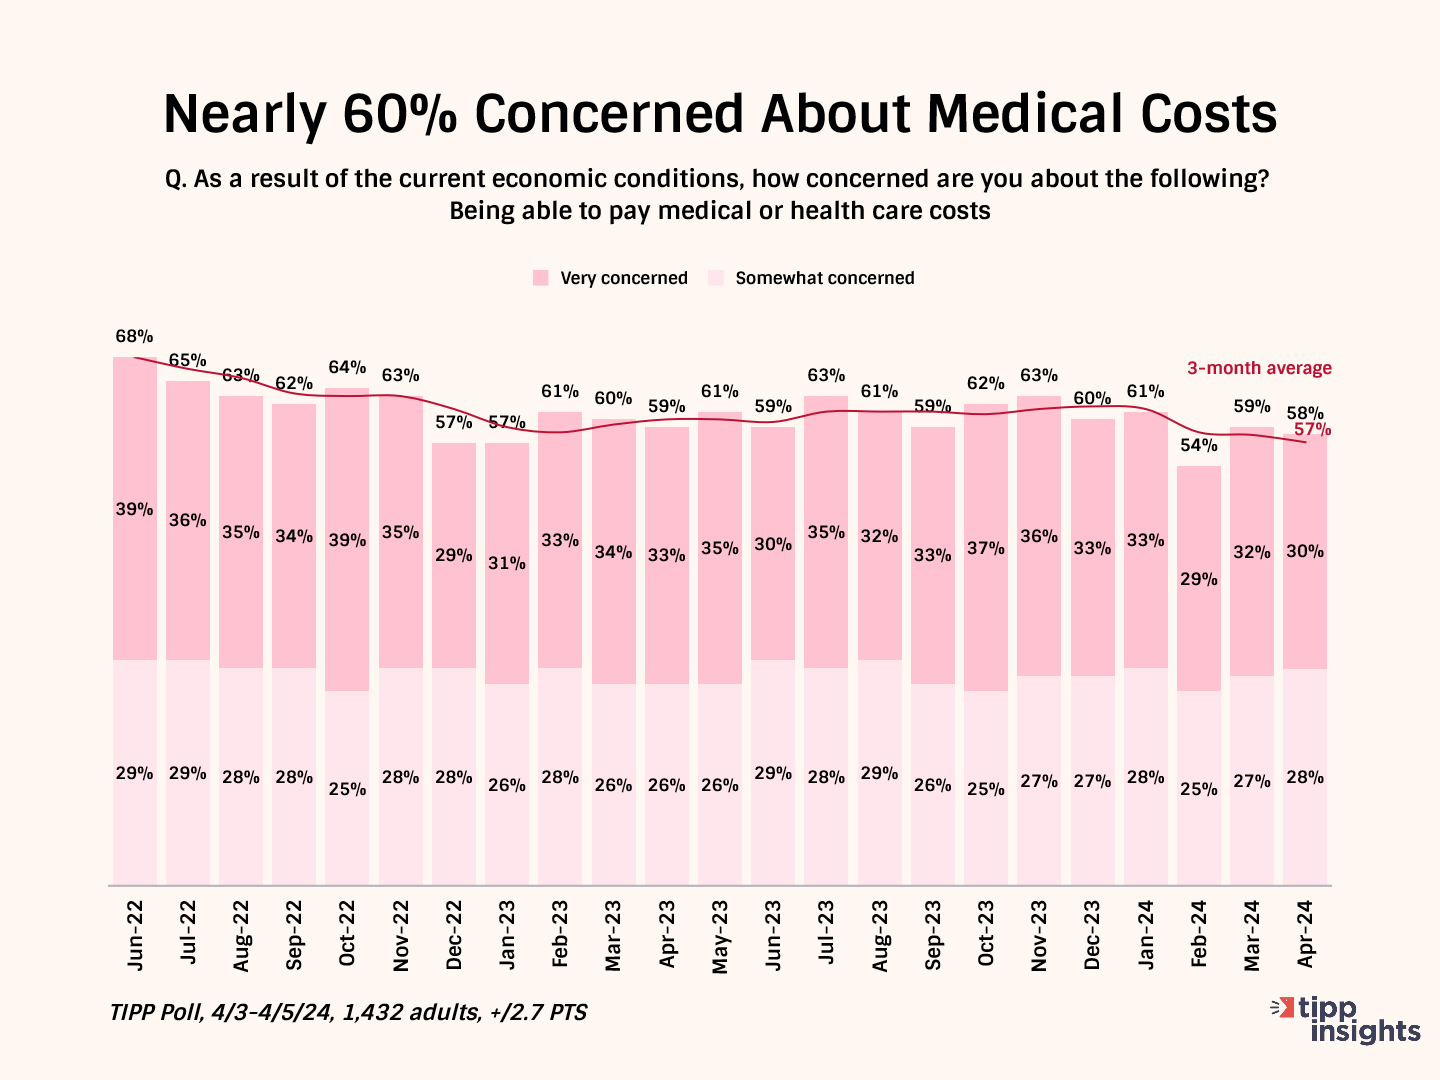
Most (58%) are concerned about paying for medical or health care costs, with 30% very concerned and another 28% somewhat concerned. 59% of Democrats, 60% of Republicans, and 56% of independents share the concern.
Counterintuitively, the concern decreases with age:
- 63% for the 18-24 age group
- 64% for the 25-44 age group
- 58% for the 45-64 age bracket, and
- 46% for age 65+
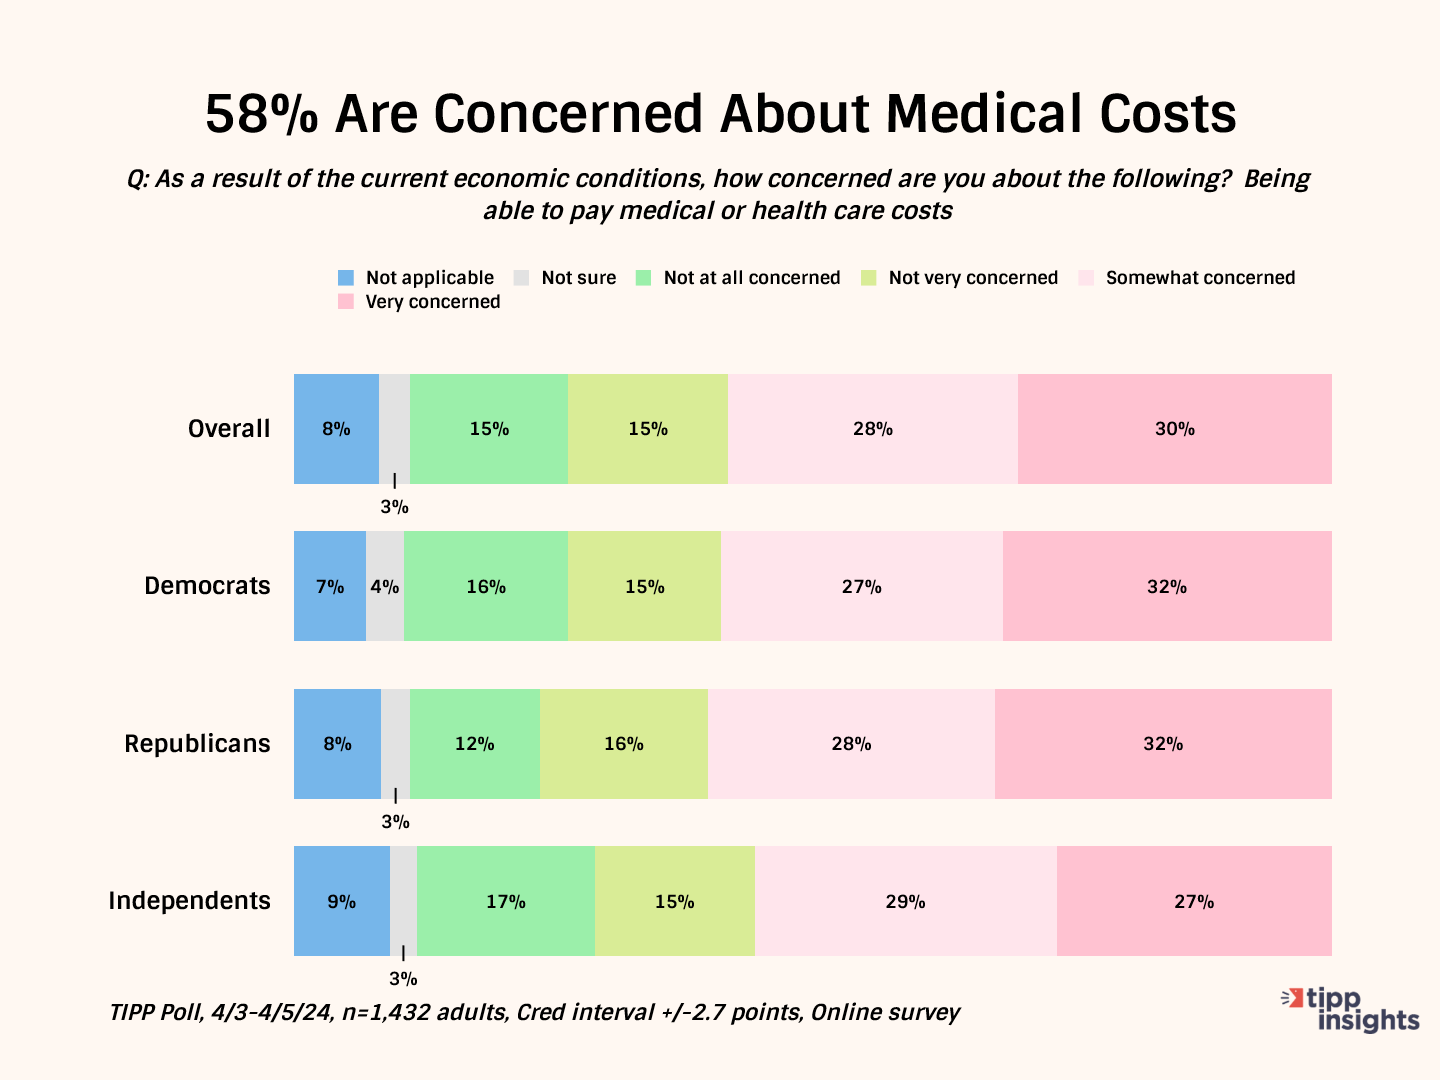
The chart below shows our monthly tracking since June 2022. Note that over the past year, the data has moved in a close range from 54% to 63%.
Children’s Education
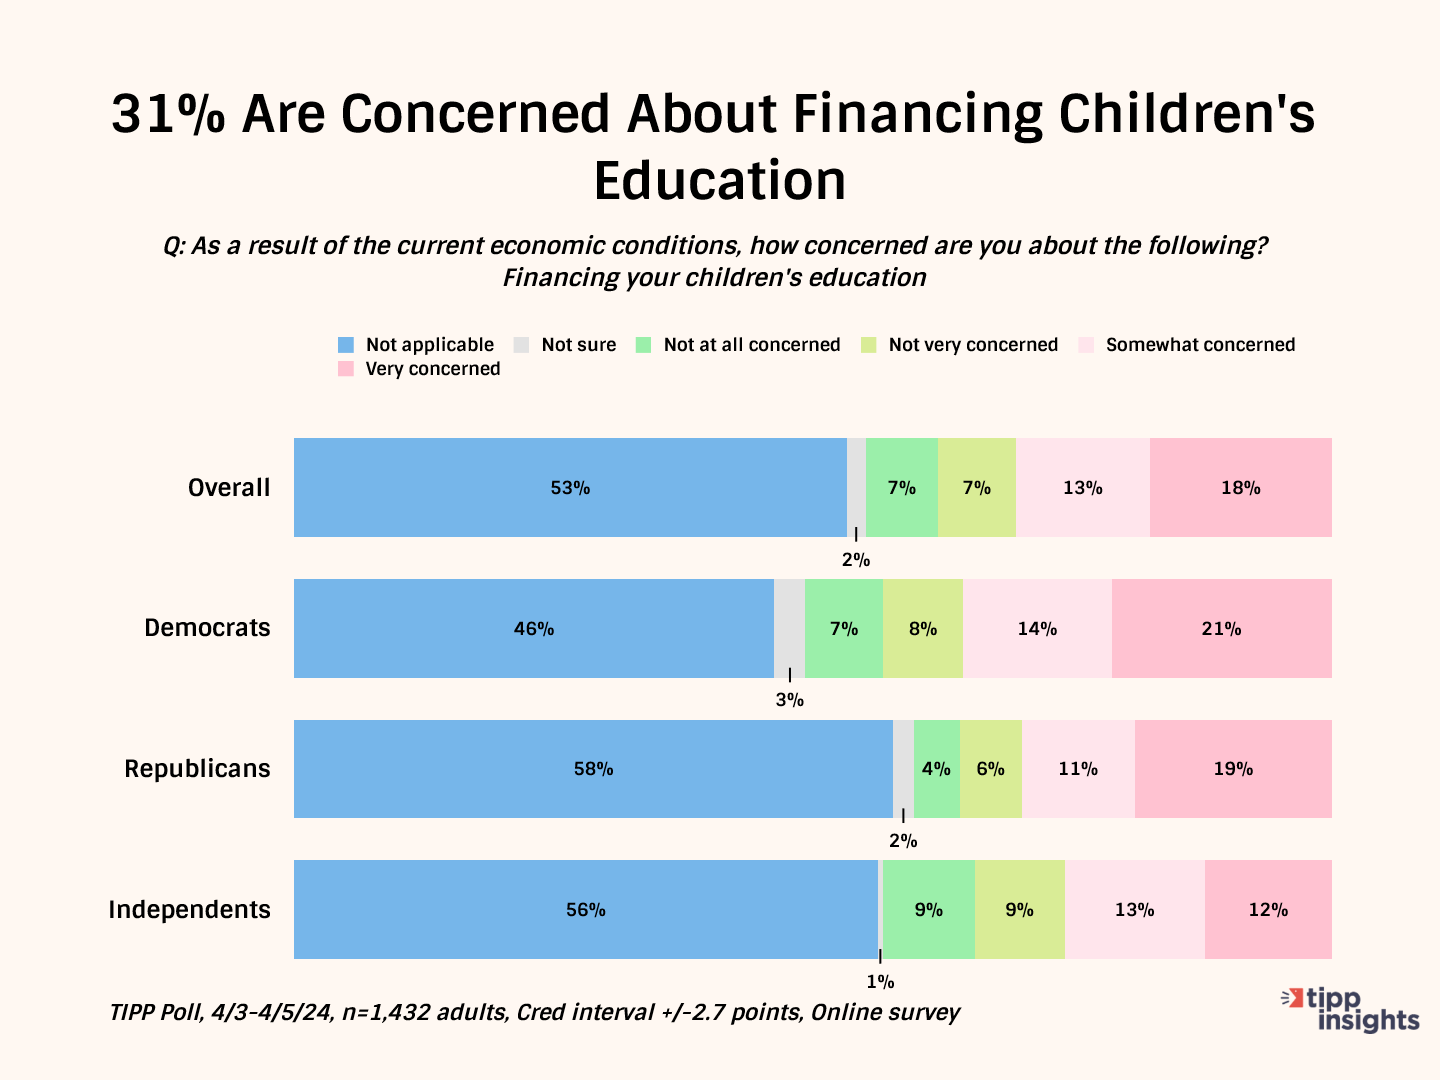
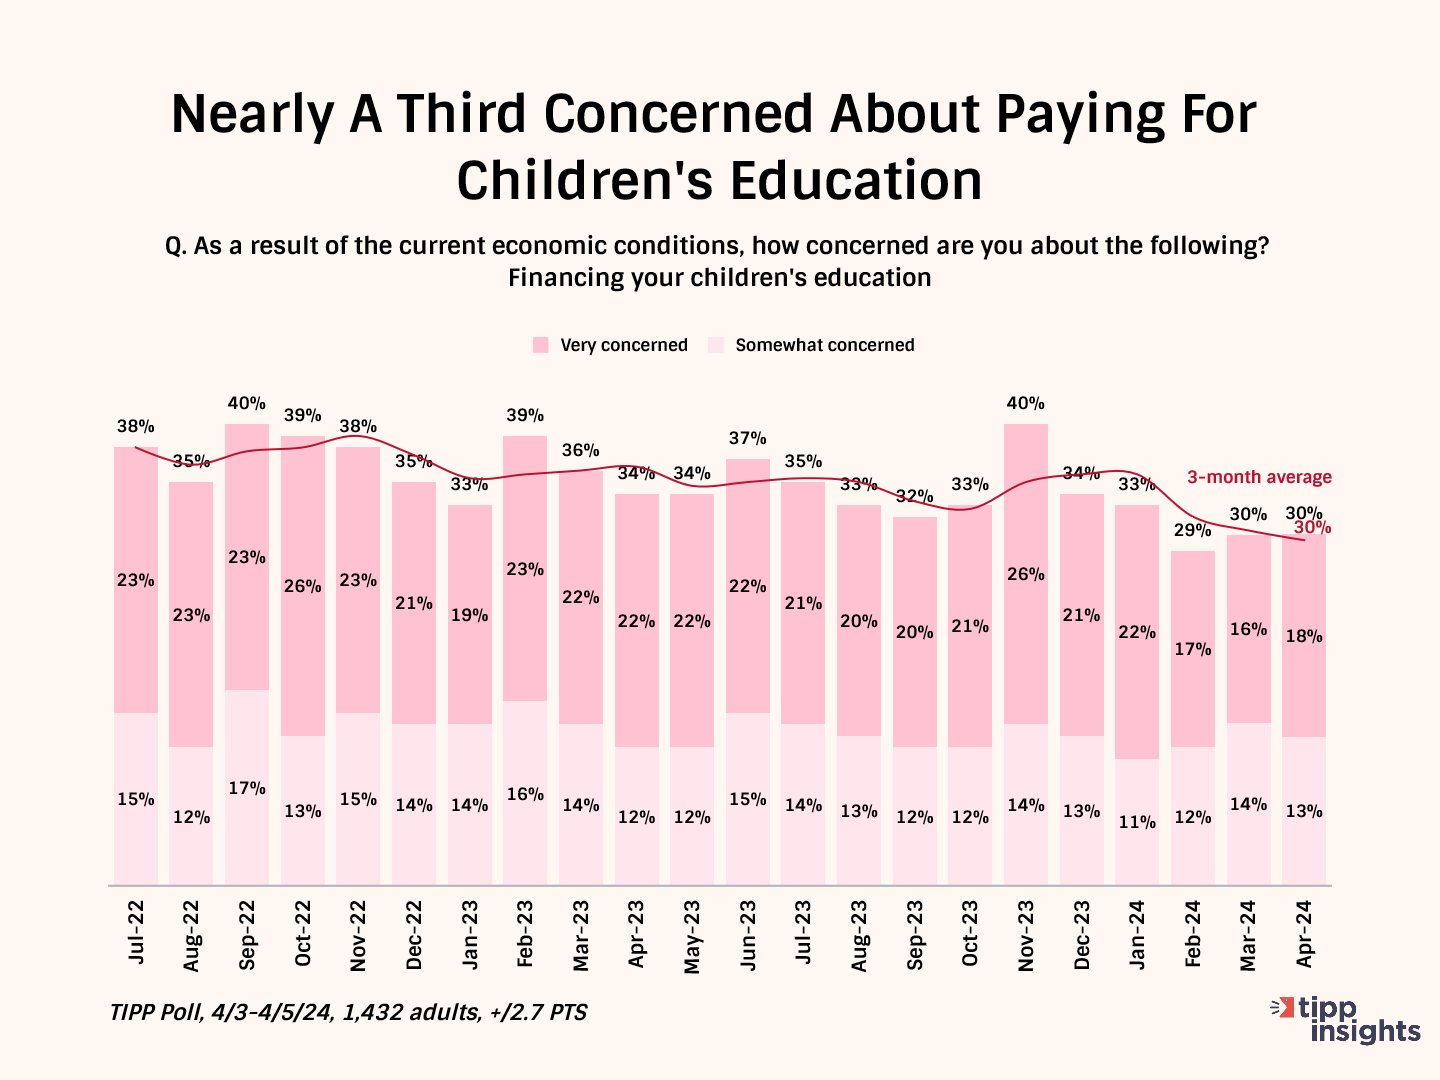
Nearly a third (31%) are concerned about financing their children’s education. One in six (18%) is very concerned, and 13% are somewhat concerned. (The item did not apply to 53% of those who participated in the survey.)
Concern levels are similar for Democrats (35%), Republicans (30%), and independents (25%).
Our tracking shows that worries related to children’s education continue, with the latest three-month average at 30%.
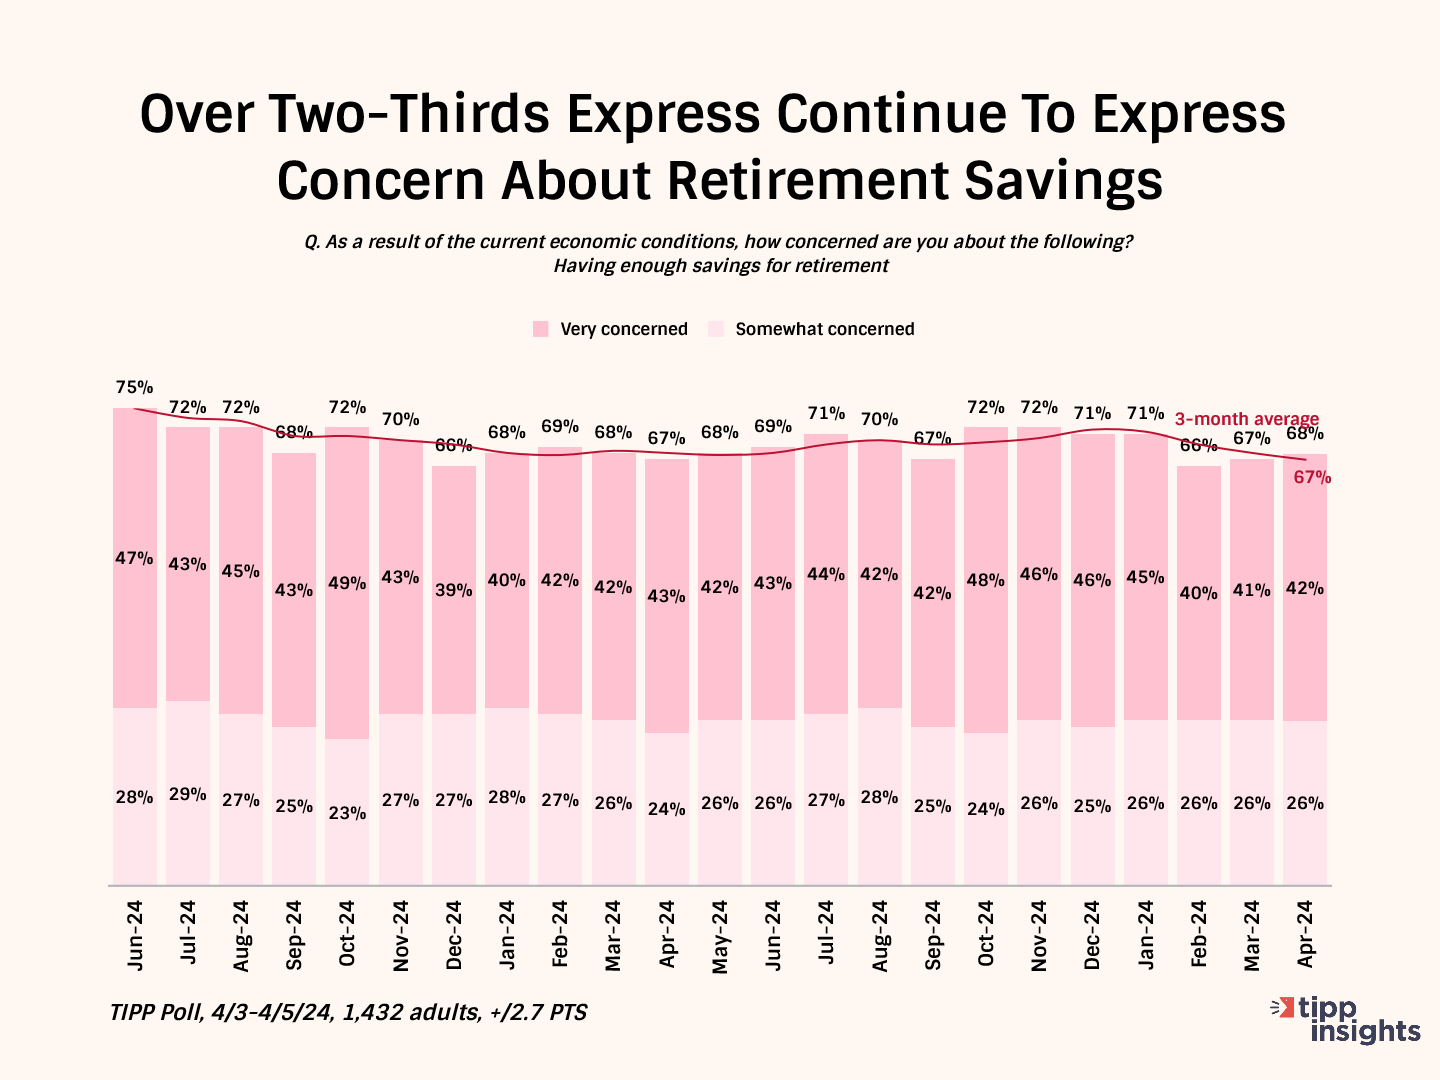
Retirement Savings
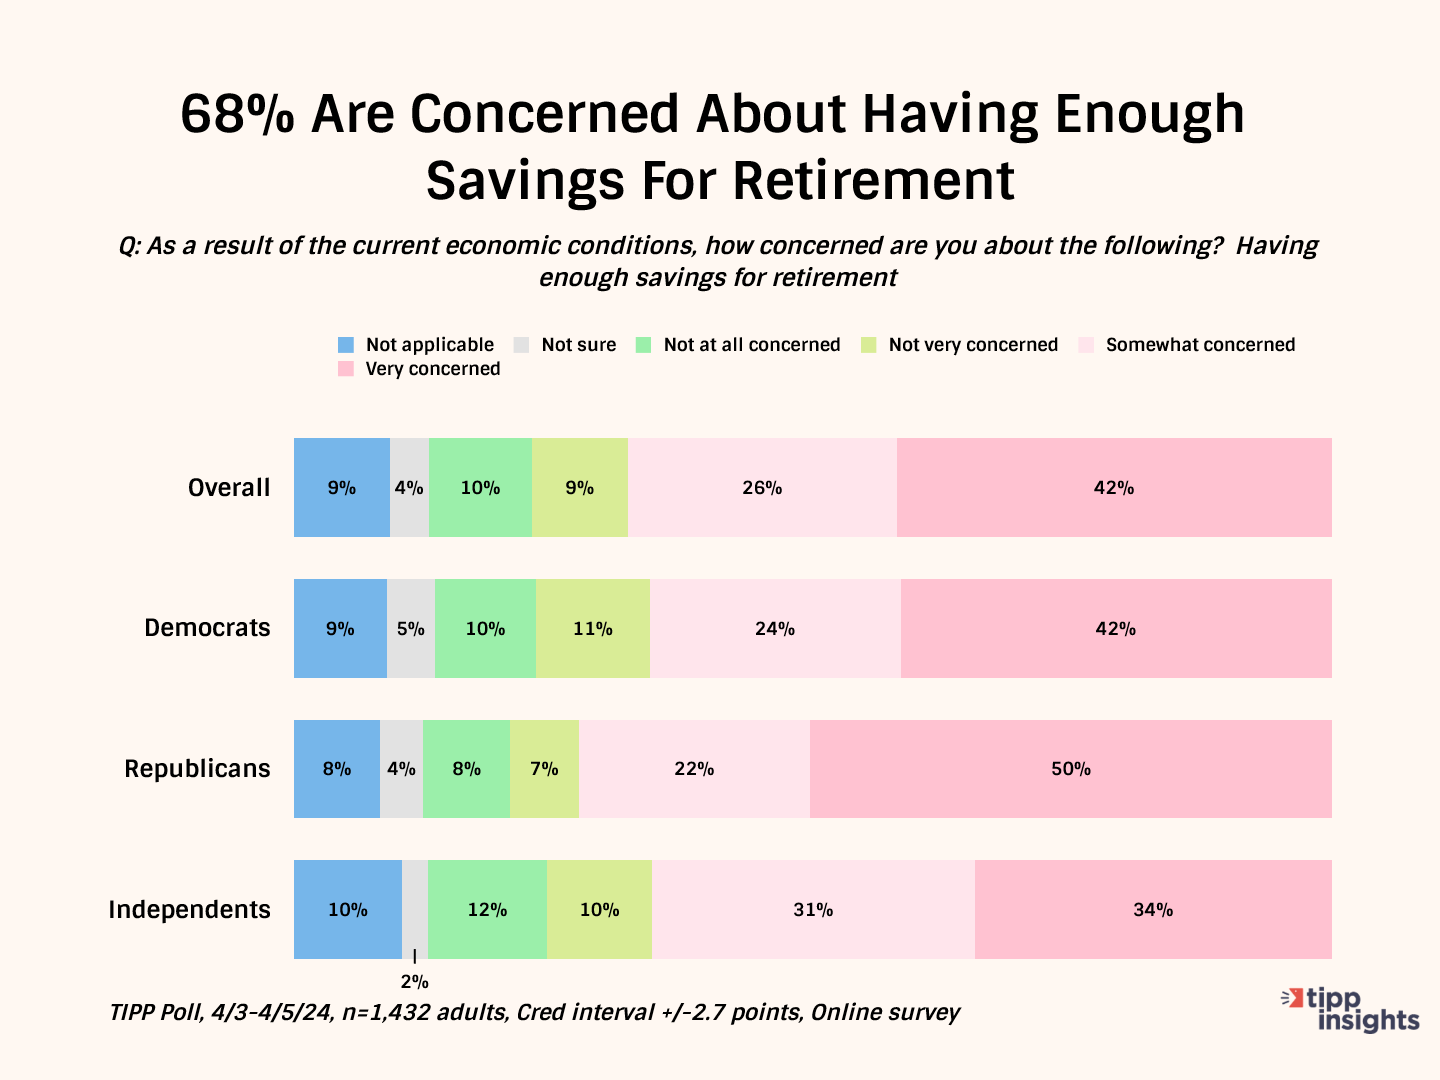
Two-thirds (68%) are concerned about having enough savings for retirement. Four in ten (42%) are very concerned; another quarter (26%) is somewhat concerned.
Interestingly, the concern among those aged 65+ is the lowest:
- 73% for the 18-24 age group
- 72% for the 25-44 group
- 73% for the 45-64 bracket, and
- 51% for age 65+
Tracking over the past two years shows the persisting concern.
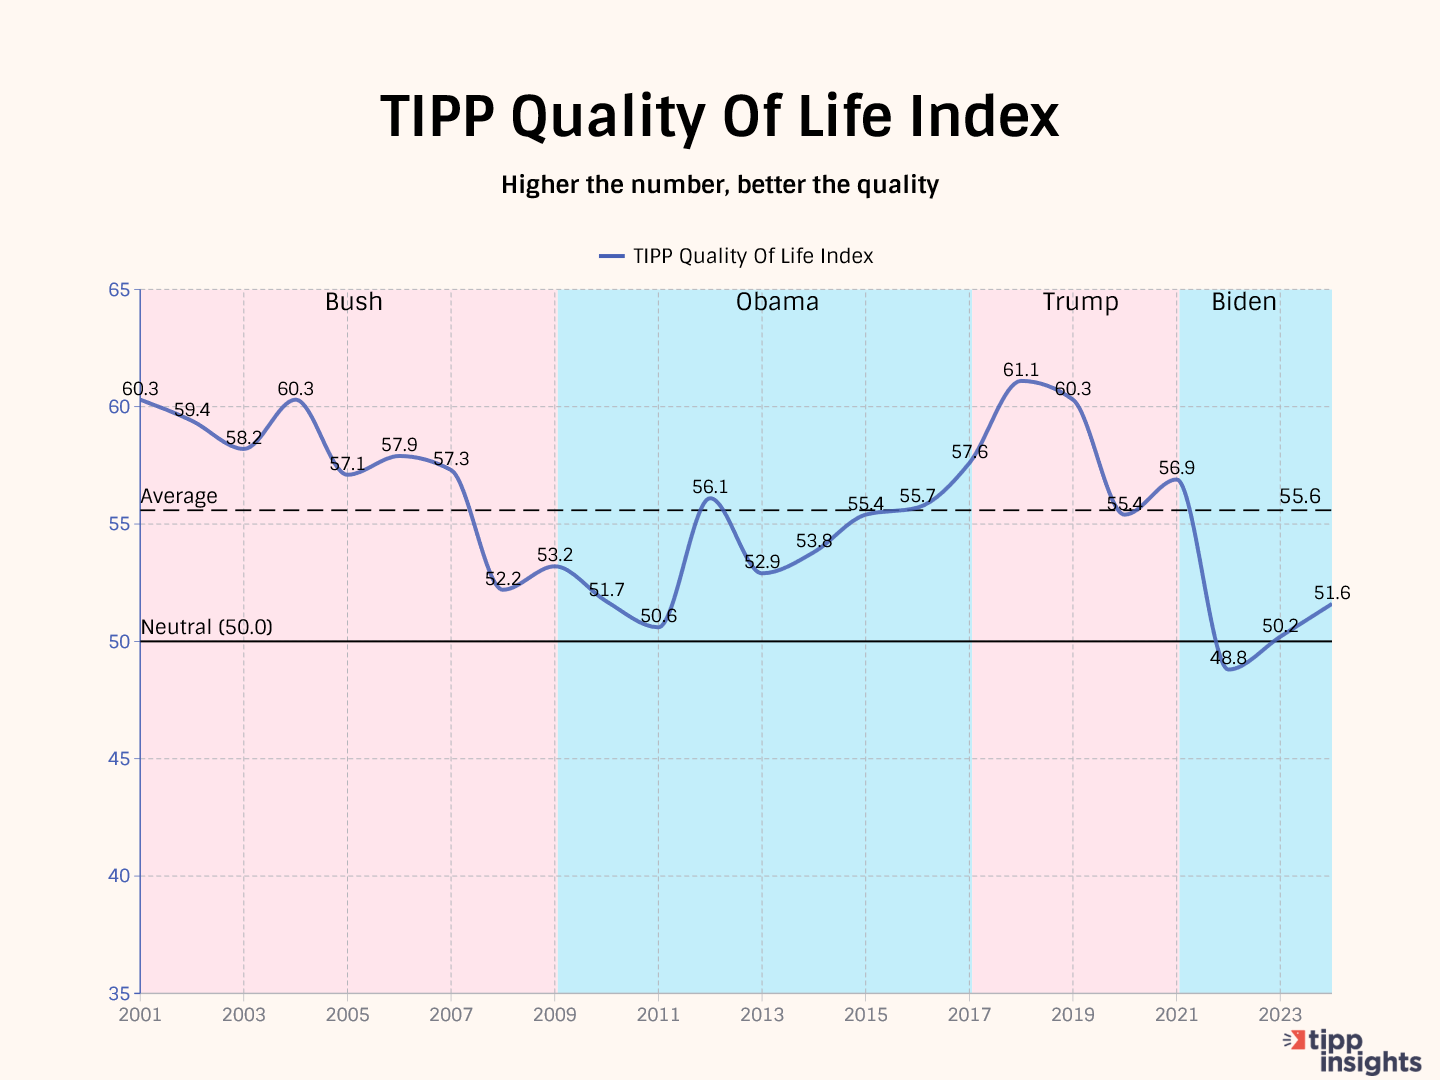
Quality Of Life Index
Each month, the TIPP Poll asks Americans the question:
In the next six months, do you think that your quality of life will be better, worse, or about the same as now?
The responses are converted to a compact index that ranges from 0 to 100. Above 50 is positive, below 50 is negative, and 50 is neutral. Higher the number, better the quality.
The chart below shows the yearly averages from 2001 to 2024. The average for the period is 55.6. Before the pandemic, the 2019 average was 60.3.
However, the quality of life index has dropped steadily. The average for 2022 was 48.8—the first time since 2001 that the annual average dipped below 50. It is still relatively weak for 2023 at 50.2.
- 60.3 for 2019
- 55.4 for 2020
- 56.9 for 2021
- 48.8 for 2022
- 50.2 for 2023
- 51.4 for 2024 (first four months)
Our broad interpretation is that the quality of life index reflects Americans’ struggles today due to inflation and economic conditions.
RCM/TIPP Financial Stress Index
RCM/TIPP Financial Stress Index is the only metric to track the financial stress felt by Americans.
We compute the stress index from responses to the question:
Thinking of your personal finances, compared to the past three months, do you feel more stressed these days, less stressed these days, or feel the same level of stress?
The index ranges from 0 to 100; the higher the number, the more stress. A reading of 50.0 is the neutral point.
Americans’ financial struggles increase financial stress. The chart below shows the yearly average of monthly readings for each year. Notice that the levels during 2022 (67.6) and 2023 (67.5) were elevated similar to 2008 (68.4).
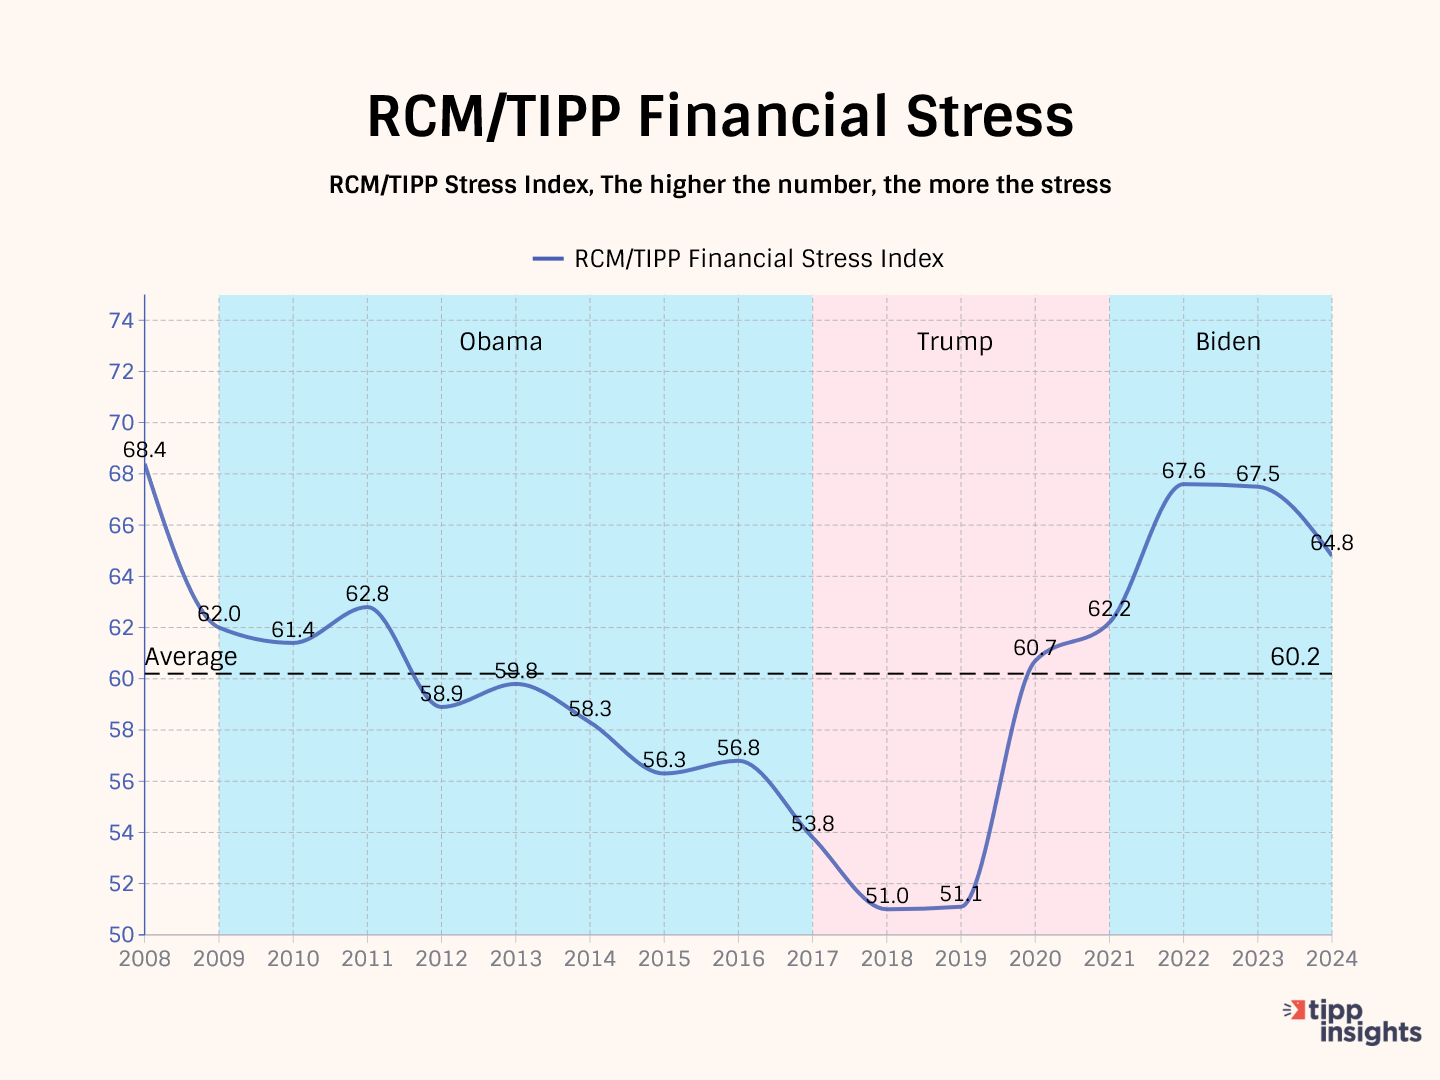
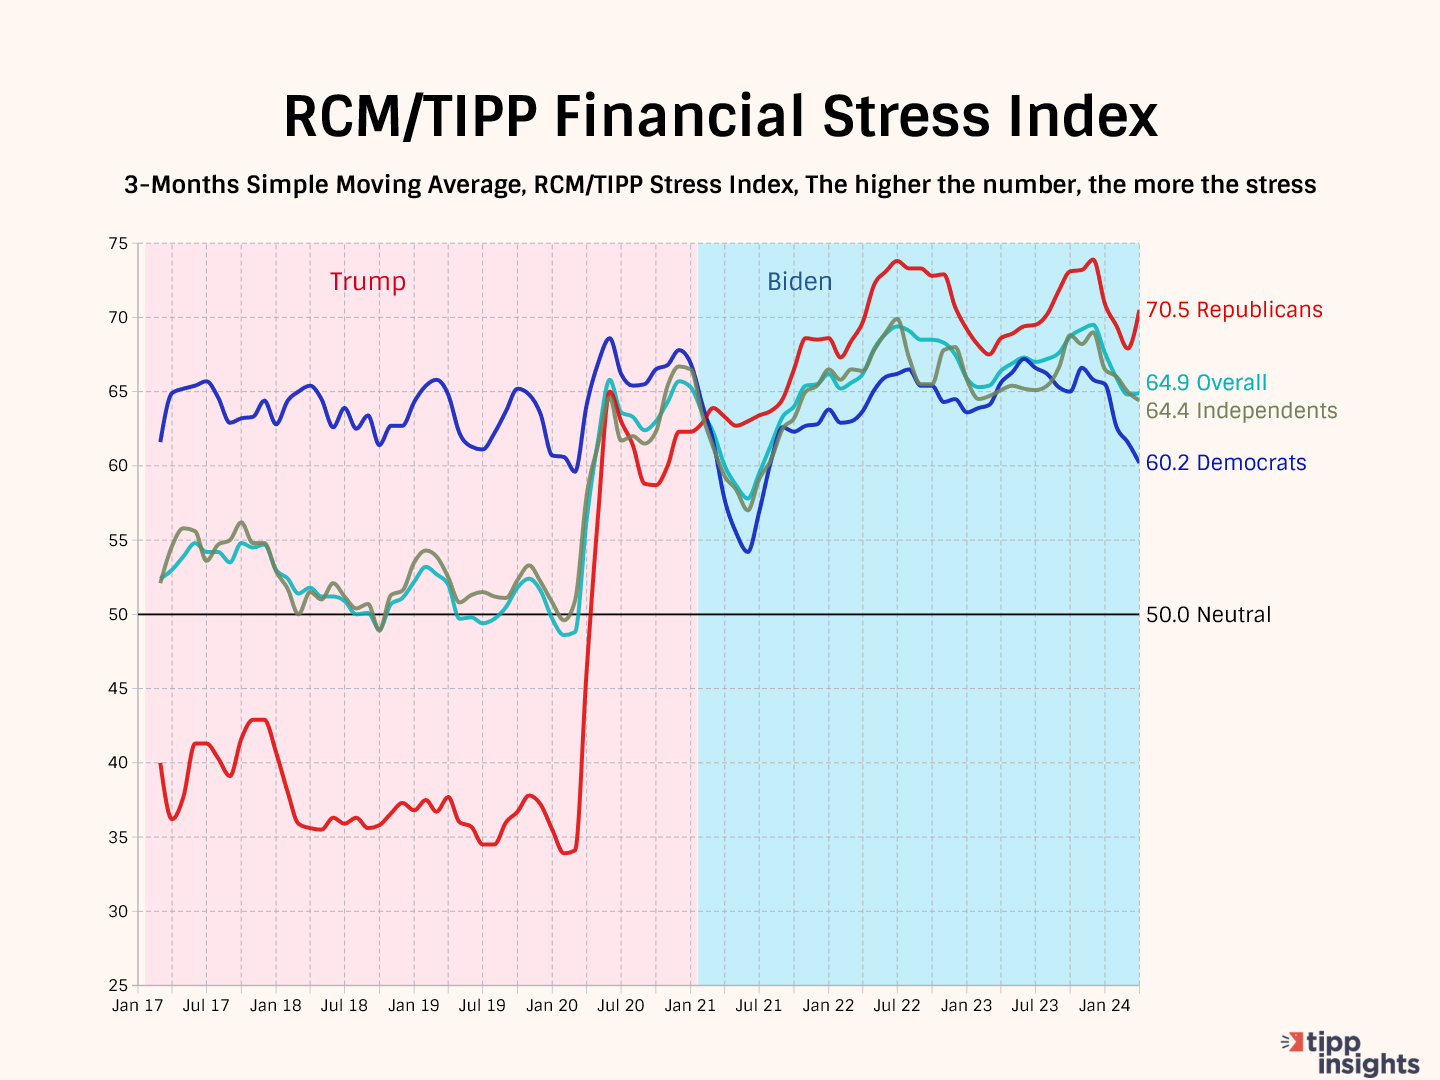
Financial stress is an equal opportunity stressor, affecting Democrats (60.2), Republicans (70.5), and independents (64.4).
The table below shows the RCN/TIPP Financial Stress Index for this month. Notice that 35 of the 36 demographic groups we track posted 60+ on the stress index.
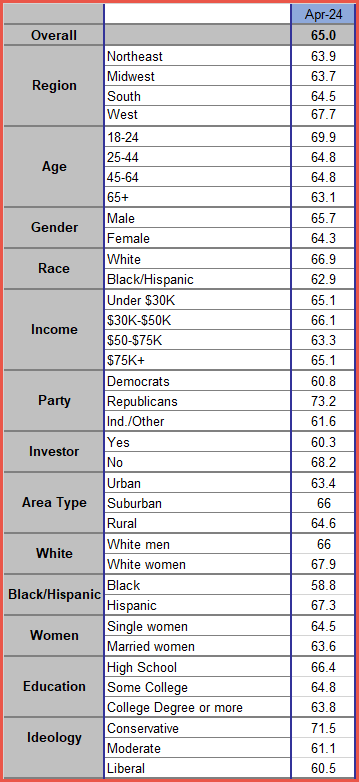
While we acknowledge that unemployment is low and the economy has not yet slipped into a recession, despite inflation decreasing from 9.1% to 3.5%, the majority of Americans continue to experience hardship even in the midst of what is purportedly a ‘strong’ economy. This prompts an intriguing question: Can we truly consider an economy strong when the majority of its citizens are suffering? Look how hollow President Biden sounds during his campaign when he touts the economy and the media talking heads repeat the nonsense to the dismay of struggling Americans.


