
- Bidenflation at 18.8% erodes Americans’ purchasing power
- The third consecutive month of increases
- Annualized Bidenflation steady at 6.0%, nearly double the CPI
- Core prices are stubborn at 3.8%
- RELATED: Americans' Economic Confidence Slips In April: RCM/TIPP
We are in an election year. President Biden, a seasoned politician, has failed miserably in tackling inflation and is now attempting to shift blame for "Bidenflation" onto Trump, a move even noted by The New York Times, which dubbed it Biden's Plan B. Commenting on the latest CPI release, President Biden said:
We’re better situated than we were when we took office where we— inflation was skyrocketing. And we have a plan to deal with it, whereas the opposition — my opposition talks about two things. They just want to cut taxes for the wealthy and raise taxes on other people.
The dark reality of Bidenomics is 18.8% inflation under the President’s watch, which is 6.0% on an annual basis. When he took office, inflation was at just 1.4%. Since March 2021, it has stayed above the Federal Reserve's 2% target (37 consecutive months.)
Inflation results from excessive Federal Reserve money printing and government spending, expanding the money supply. This leads to prices rising and effectively acts as a hidden tax on everyone.
Despite a decrease from the highs of mid-2022, many families continue to face significant inflationary pressures. Prices have increased by 18.8%, while real wages have declined by 2.5%. Average hourly earnings for all employees dropped 2.5% to $11.11 in March 2024 from $11.39 in January 2021 when Biden assumed office. According to Mark Zandi, the chief economist at Moody's Analytics, the typical U.S. household now requires $1,069 more each month (equivalent to $12,828 annually) compared to three years ago, $784 more per month compared to two years ago, and an additional $227 per month compared to last year. The Allianz Life study found 67% are more concerned about paying bills now than their financial future.
Bidenflation and the Fed's eleven rate hikes to reduce inflation have made housing unaffordable for many people and caused displacements. According to CBRE data, the average monthly payments on a new home soared to $3,322 in the third quarter of 2023. This marks a sharp 90% increase from late 2020, when it stood at just $1,746 before Biden took office. Rising rent and the end of pandemic-era protections are contributing to the homelessness crisis.
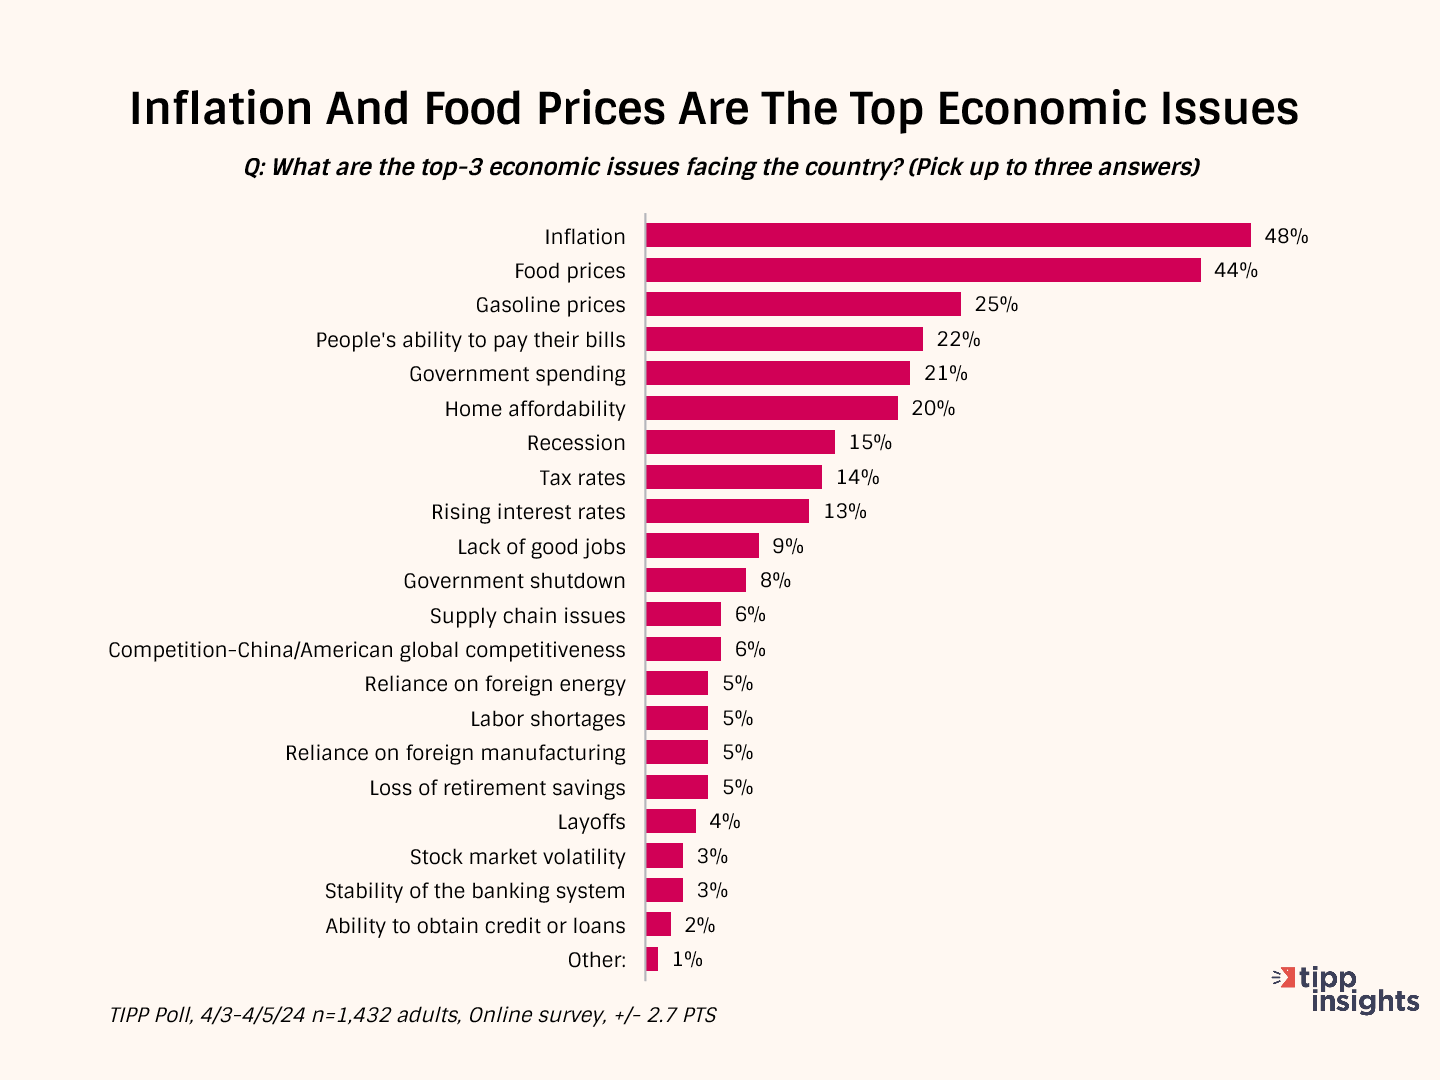
Therefore, it is unsurprising that inflation and food prices emerged as top economic issues among Americans in a recent nationwide TIPP Poll.
CPI Report
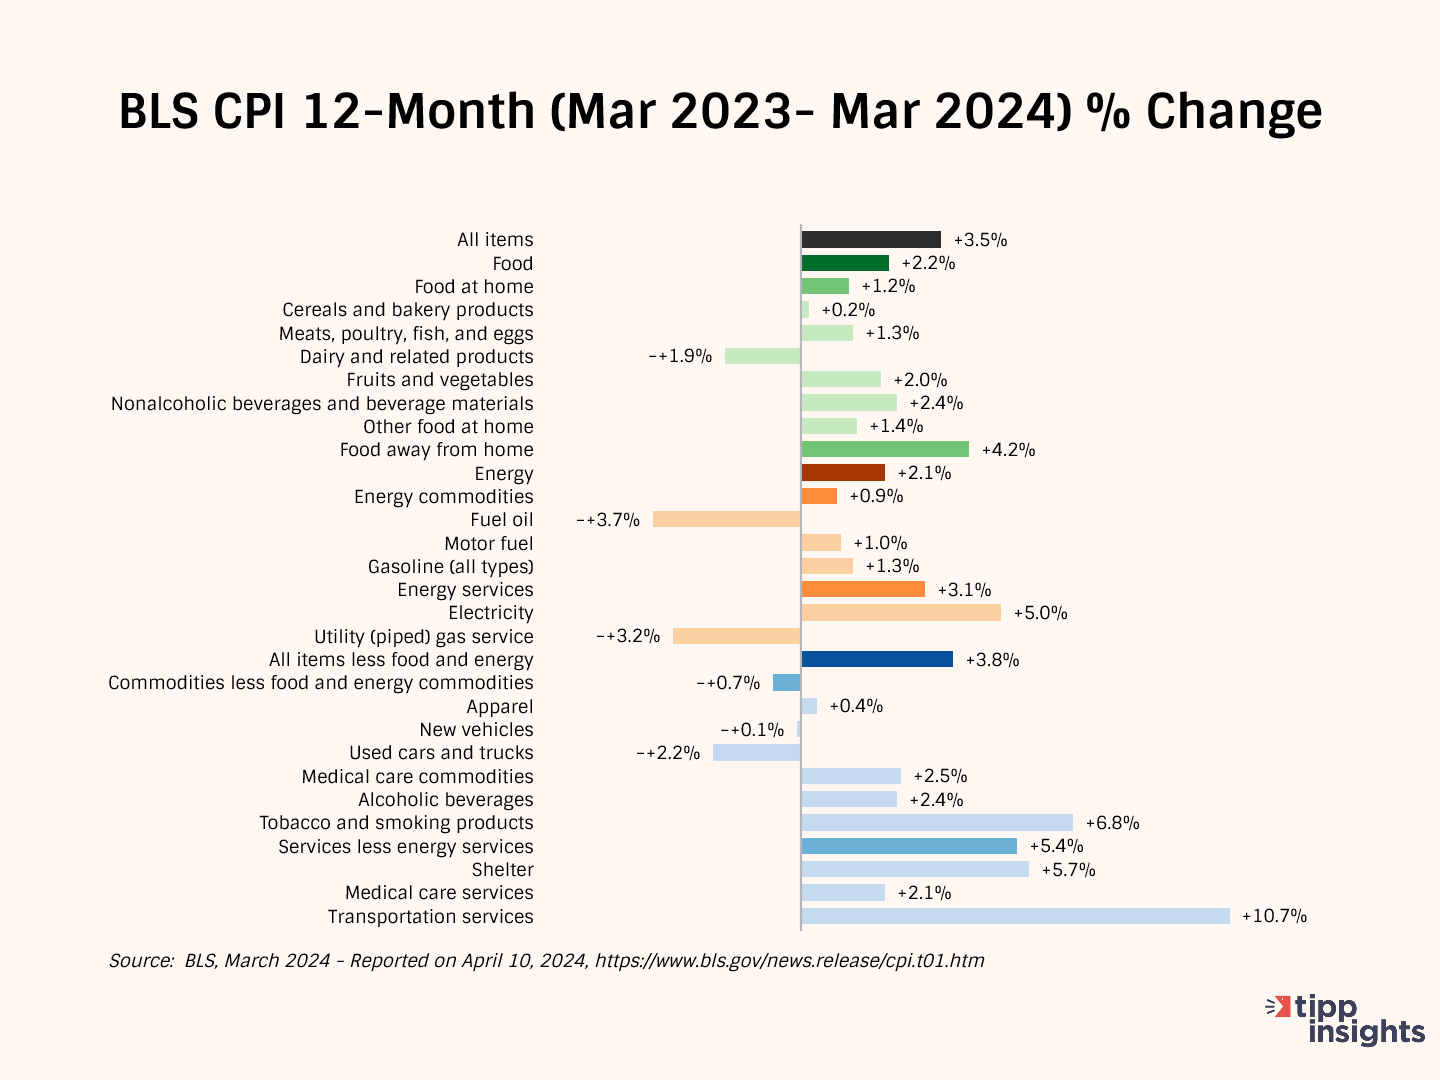
The government's Consumer Price Index (CPI), released on Wednesday, showed a 3.5% year-over-year price increase from March 2023 to March 2024.
The CPI rate had declined steadily for 12 consecutive months from a 40-year high of 9.1% in June 2022 to 3.0% in June 2023. In July, it broke that run and increased to 3.2%. Since then, it has moved sideways in the 3.1% to 3.7% range.
After adjusting for seasonality, the Consumer Price Index (CPI) increased by 0.4% between February 2024 and March 2024. During the same period, food prices rose by 0.1%, energy prices increased by 1.1%, and all items except food and energy (core) increased by 0.4%.
TIPP CPI
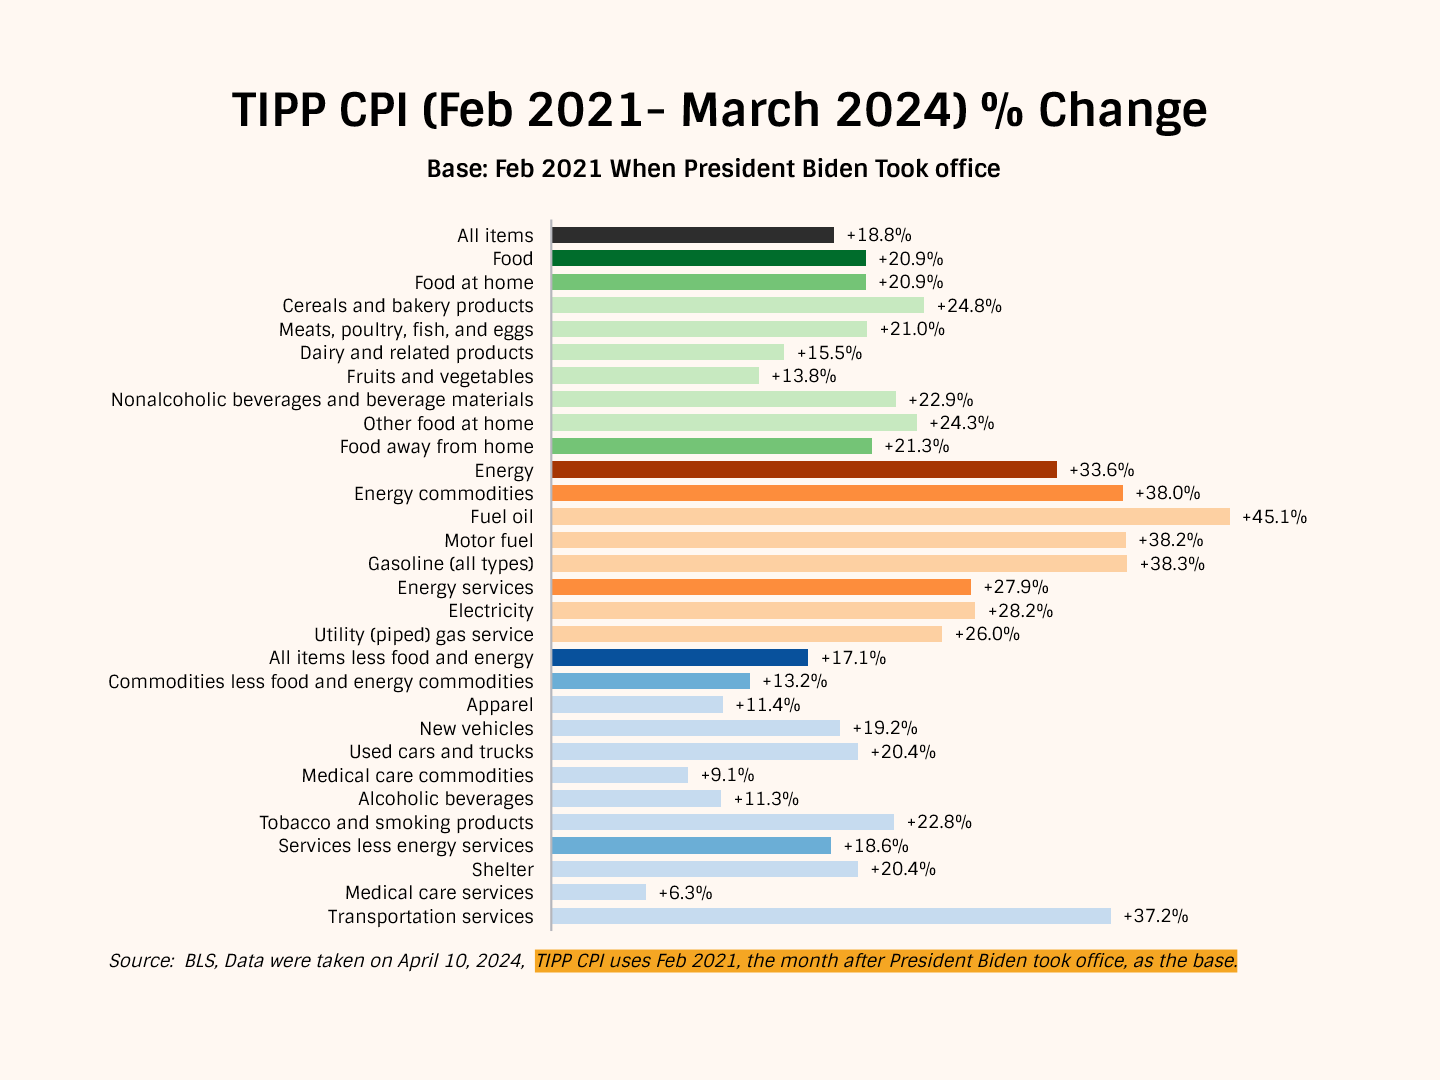
We developed the TIPP CPI, a metric that uses February 2021, the month after President Biden's inauguration, as its base to measure the rate of change. All TIPP CPI measures are anchored to the base month of February 2021, making it exclusive to the economy under President Biden's watch.
What is the motivation behind the TIPP CPI?
The BLS CPI rate doesn't accurately capture Americans’ inflation struggles. The official BLS CPI year-over-year increases will compare prices to already inflated bases in the coming months, and these statistics could mask the full impact. Further, the media and some economists frequently use the low CPI rate to present a rosy economic outlook supporting Biden’s policies.
In contrast, the TIPP CPI rate offers a clearer understanding of Americans’ economic challenges under President Biden. We use the relevant data from the Bureau of Labor Statistics (BLS) to calculate the TIPP CPI, but we adjust the period to Biden's tenure. When discussing the TIPP CPI and the BLS CPI, we convert the index numbers into percentage changes to better understand and compare them. CPIs are like index numbers that show how prices affect people's lives, similar to how the Dow Jones Industrial Average reflects the stock market.
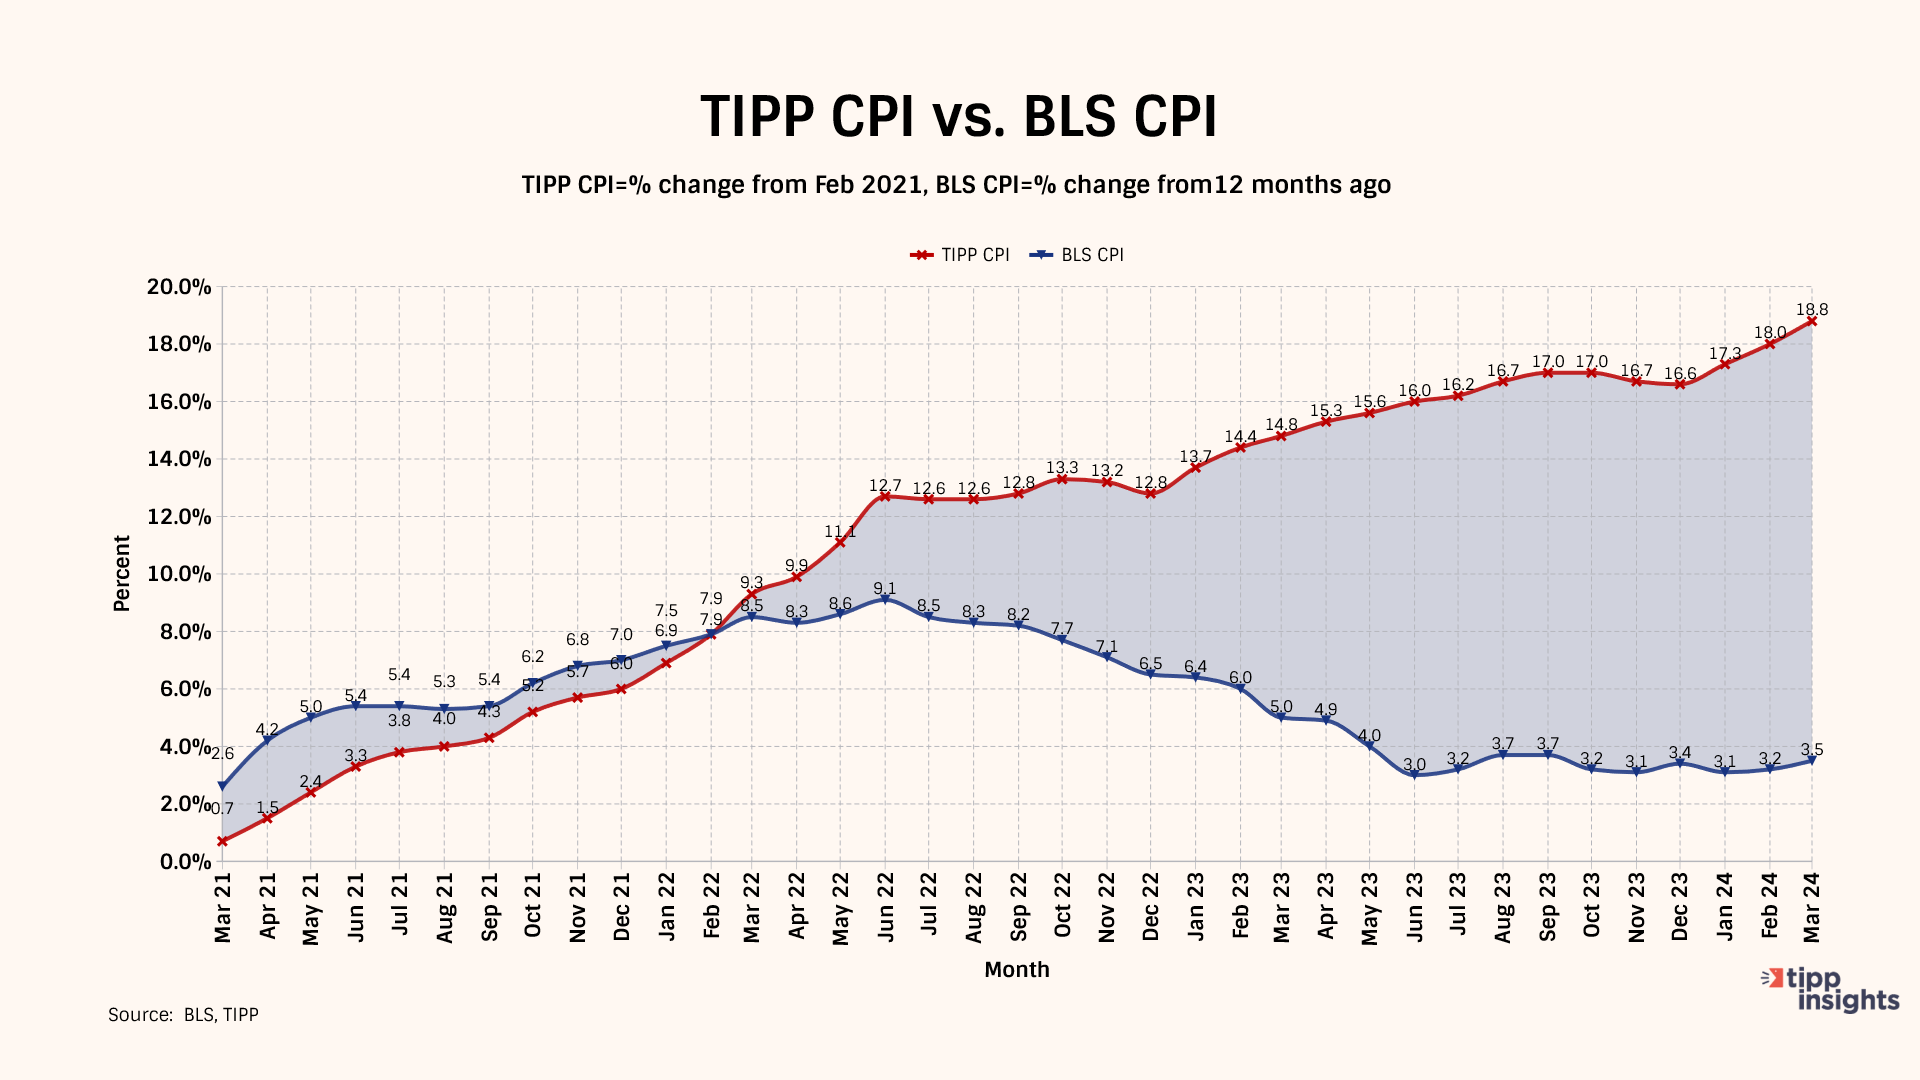
Bidenflation, measured by the TIPP CPI using the same underlying data, increased to 18.8% in March. It was 18.0% in February, 17.3% in January, and 16.6% in December.
TIPP CPI vs. BLS CPI
The following four charts present details about the new metric.
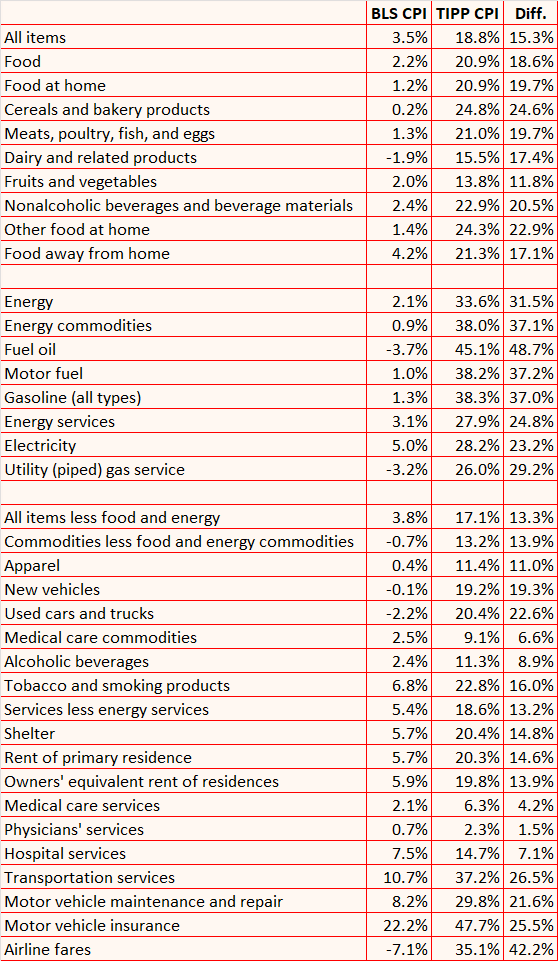
For March 2024, the BLS reported a 3.5% annual CPI increase. Compare this to the TIPP CPI of 18.8% - a 15.3-point difference. Prices have increased by 18.8% since President Biden took office. On an annual basis, TIPP CPI is 6.0%.
Food prices increased by 20.9% under Biden compared to only 2.2% as per BLS CPI, a difference of 18.6 points.
TIPP CPI data show that Energy prices increased by 33.6%. But, according to the BLS CPI, energy prices rose by 2.1%. The difference between the two is a whopping 31.5 points.
The Core CPI measures the price increase for all items, excluding food and energy. The Core TIPP CPI is 17.1% compared to 3.8% BLS CPI, a 13.3-point difference.
Further, gasoline prices have increased by 38.3% since President Biden took office, whereas the BLS CPI shows that gasoline prices have improved by 1.3%, a difference of 37.0 points.
Shelter costs rose by 20.4% under Biden’s watch, compared to the BLS reading of 5.7%, a difference of 14.8 points.
TIPP CPI finds that Used car prices have risen by 20.4% during this President’s term. Meanwhile, the BLS CPI reports that the prices have dropped 2.2%, a difference of 22.6 points.
Inflation for air tickets is at 35.1% compared to the BLS CPI’s finding of an improvement of 7.1%, a difference of 42.2 points.
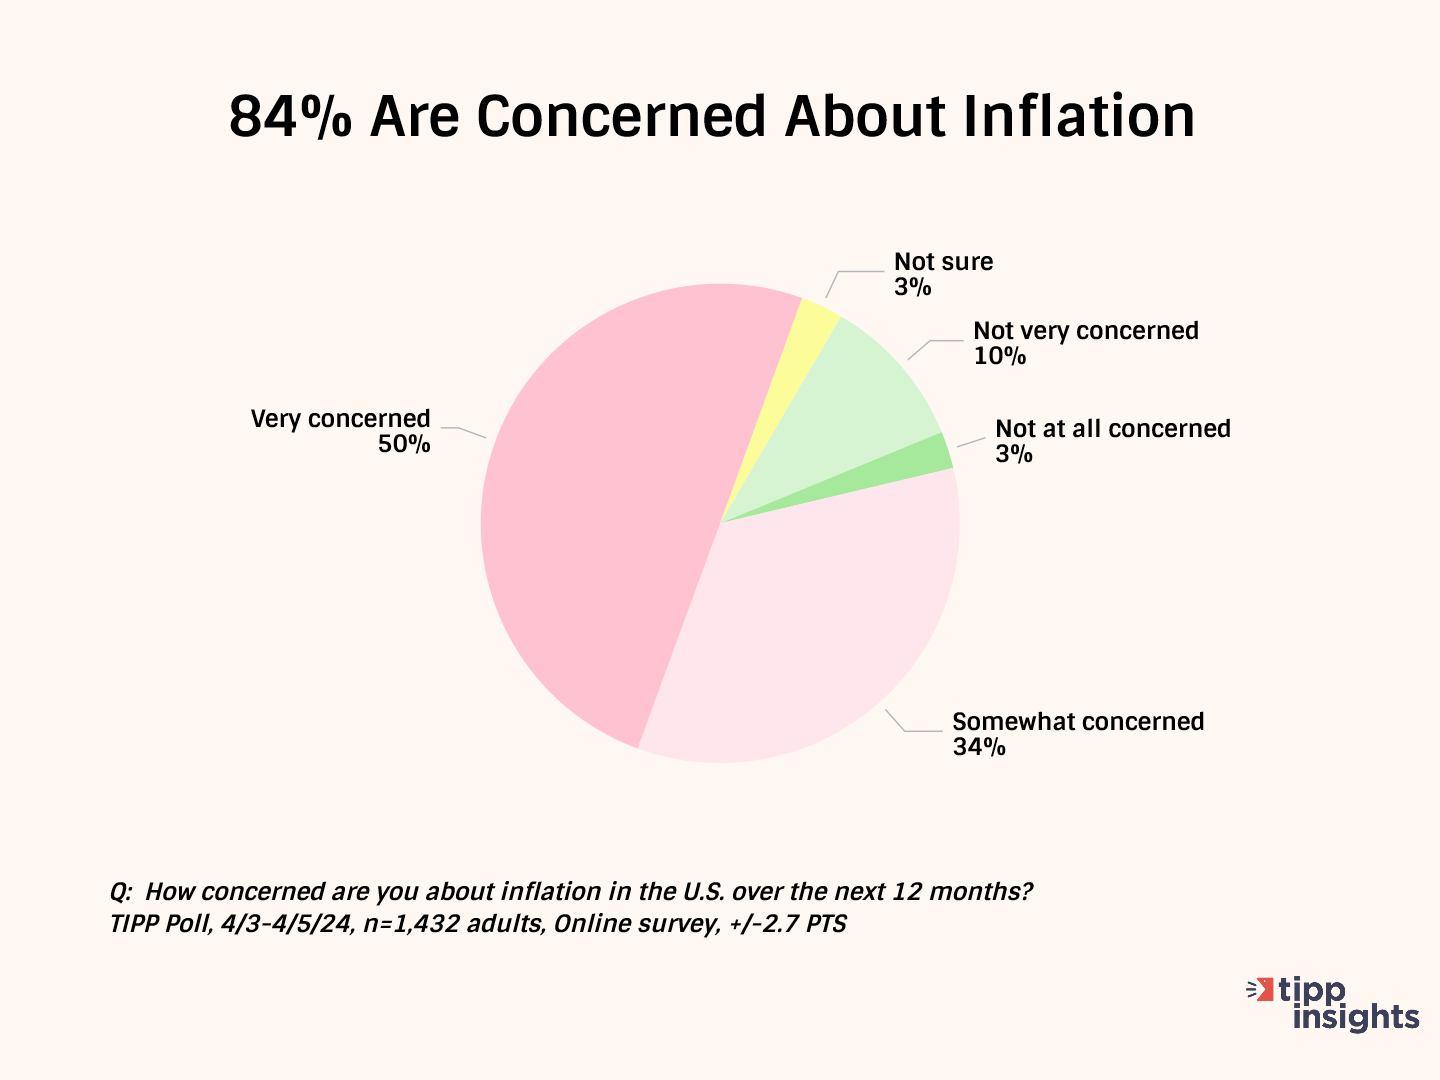
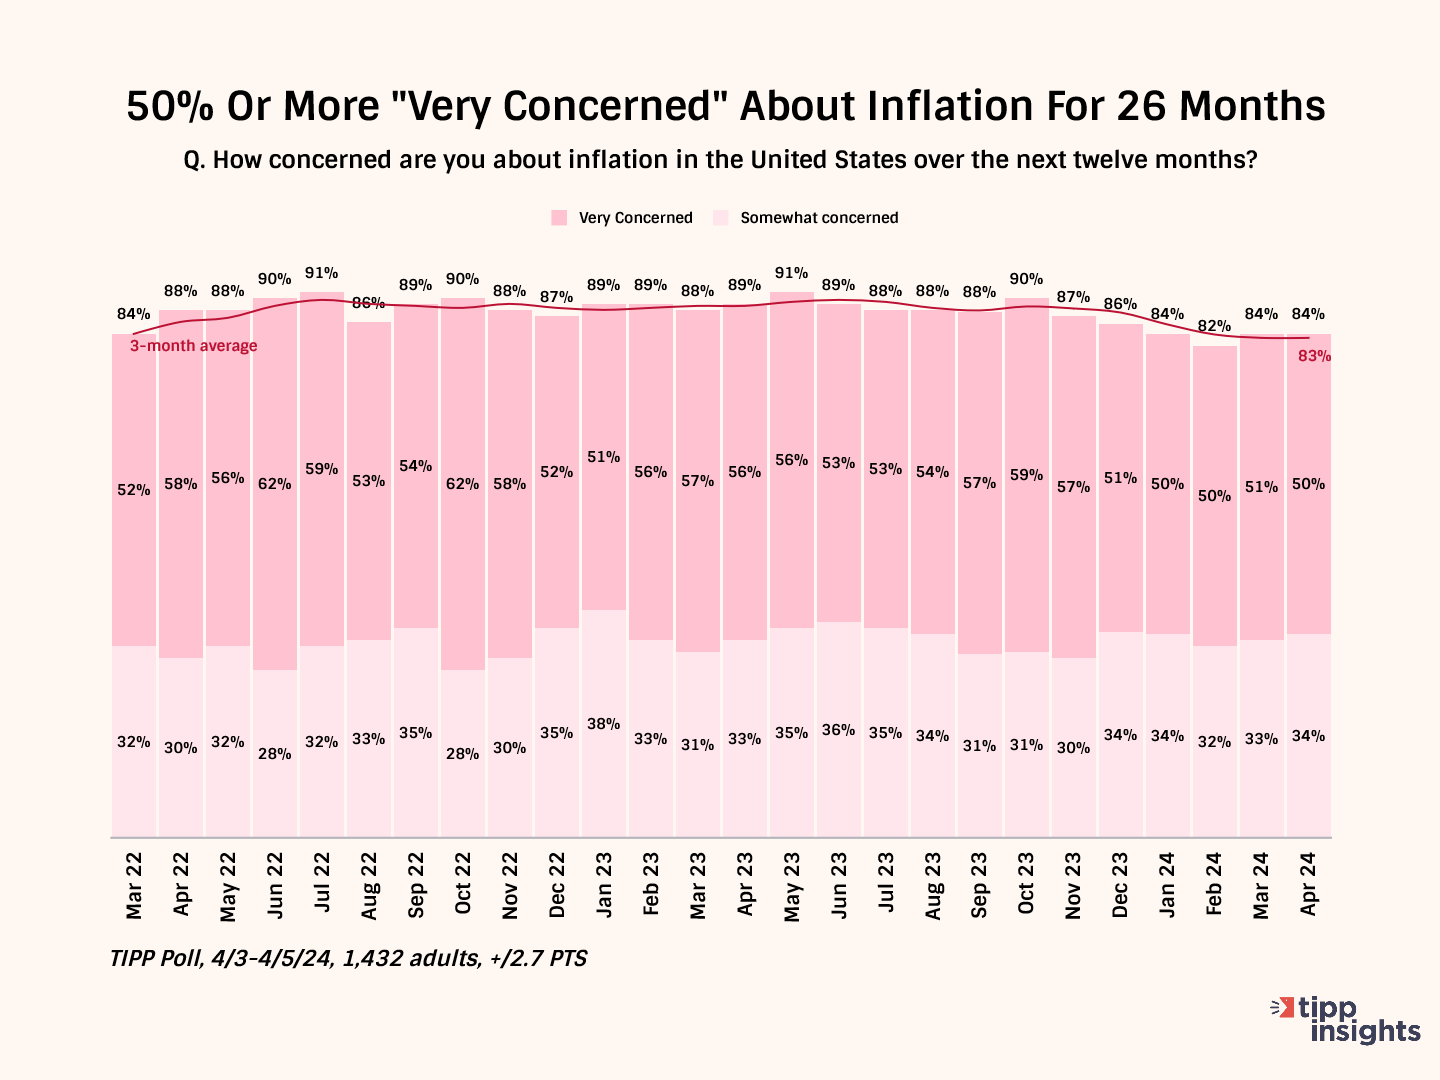
The latest TIPP Poll, completed earlier this month, shows over eight in ten (84%) survey respondents are concerned about inflation. Since January 2022, inflation concerns have stayed above 80%. The "very concerned" share has been at least 50% since March 2022, i.e., for the past twenty-six months.
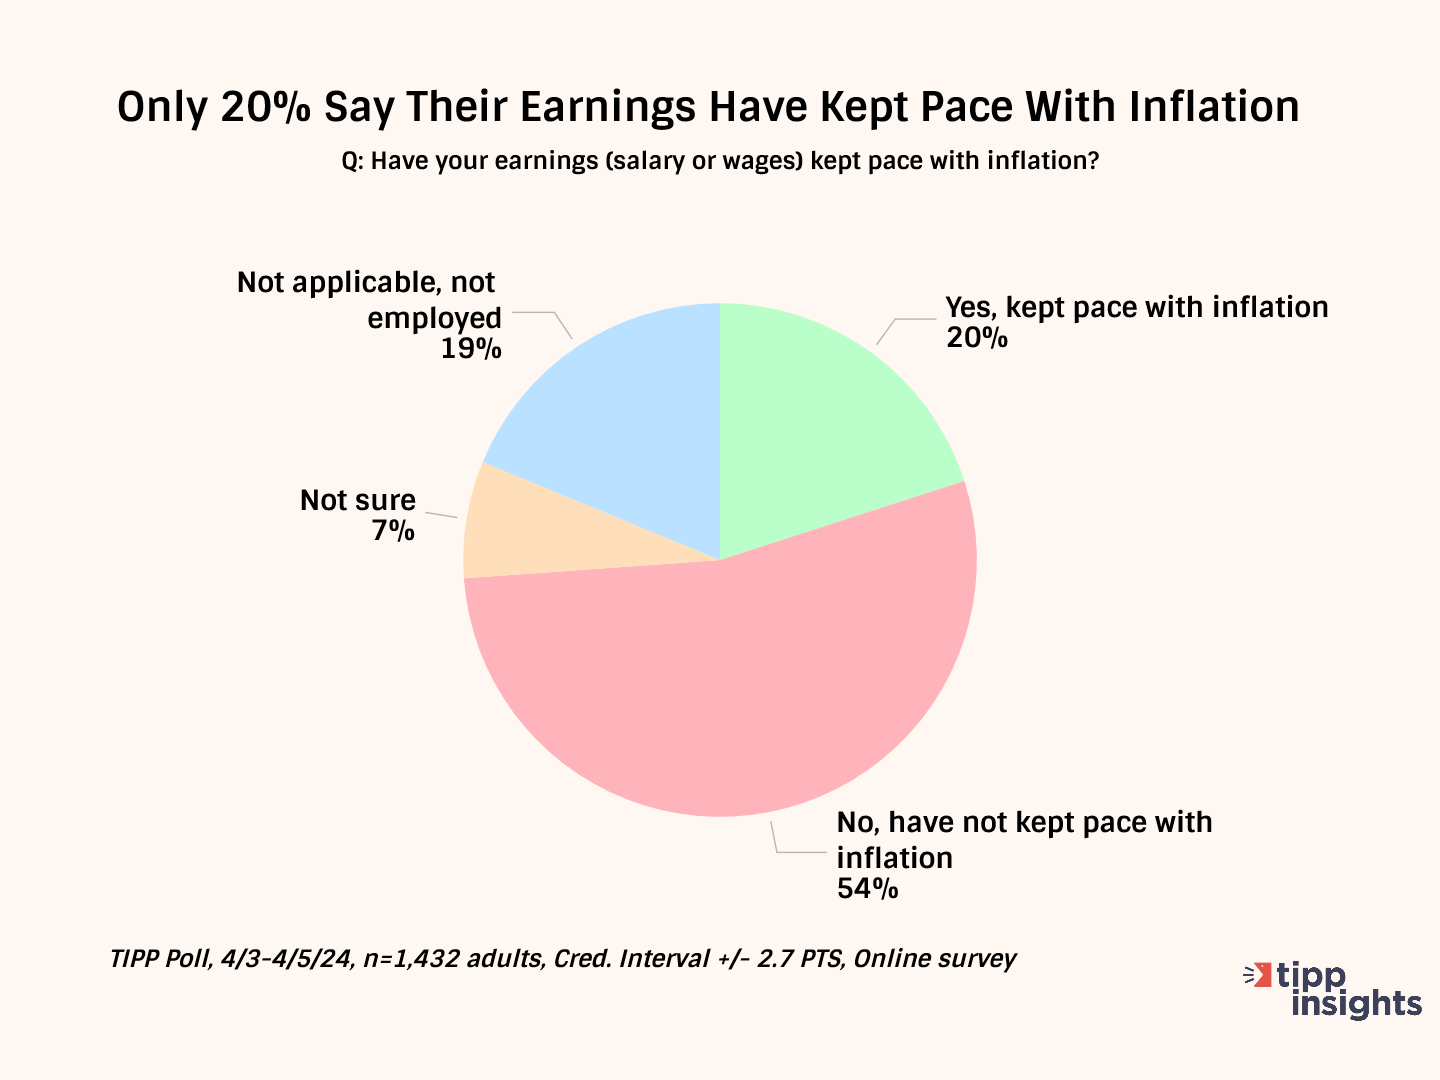
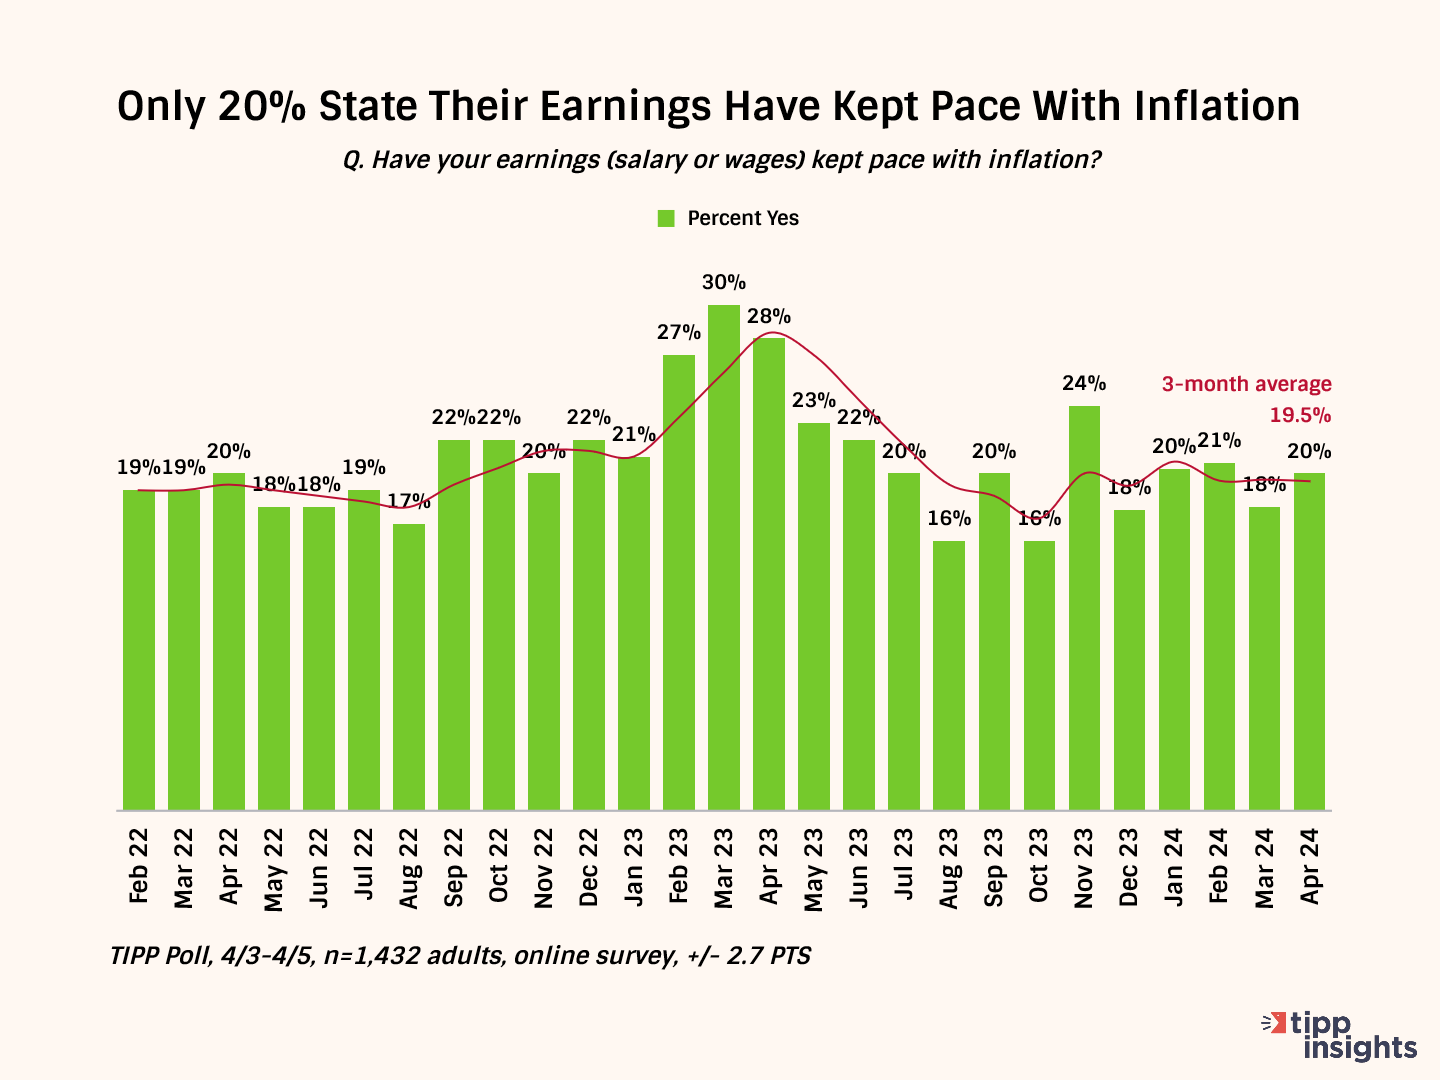
Over half (54%) say their wages have not kept up with inflation, while only one in five (20%) say their income has. Since December 2023, this statistic has moved in the tight 18% to 21% range. Its three-month average is 19.5%.
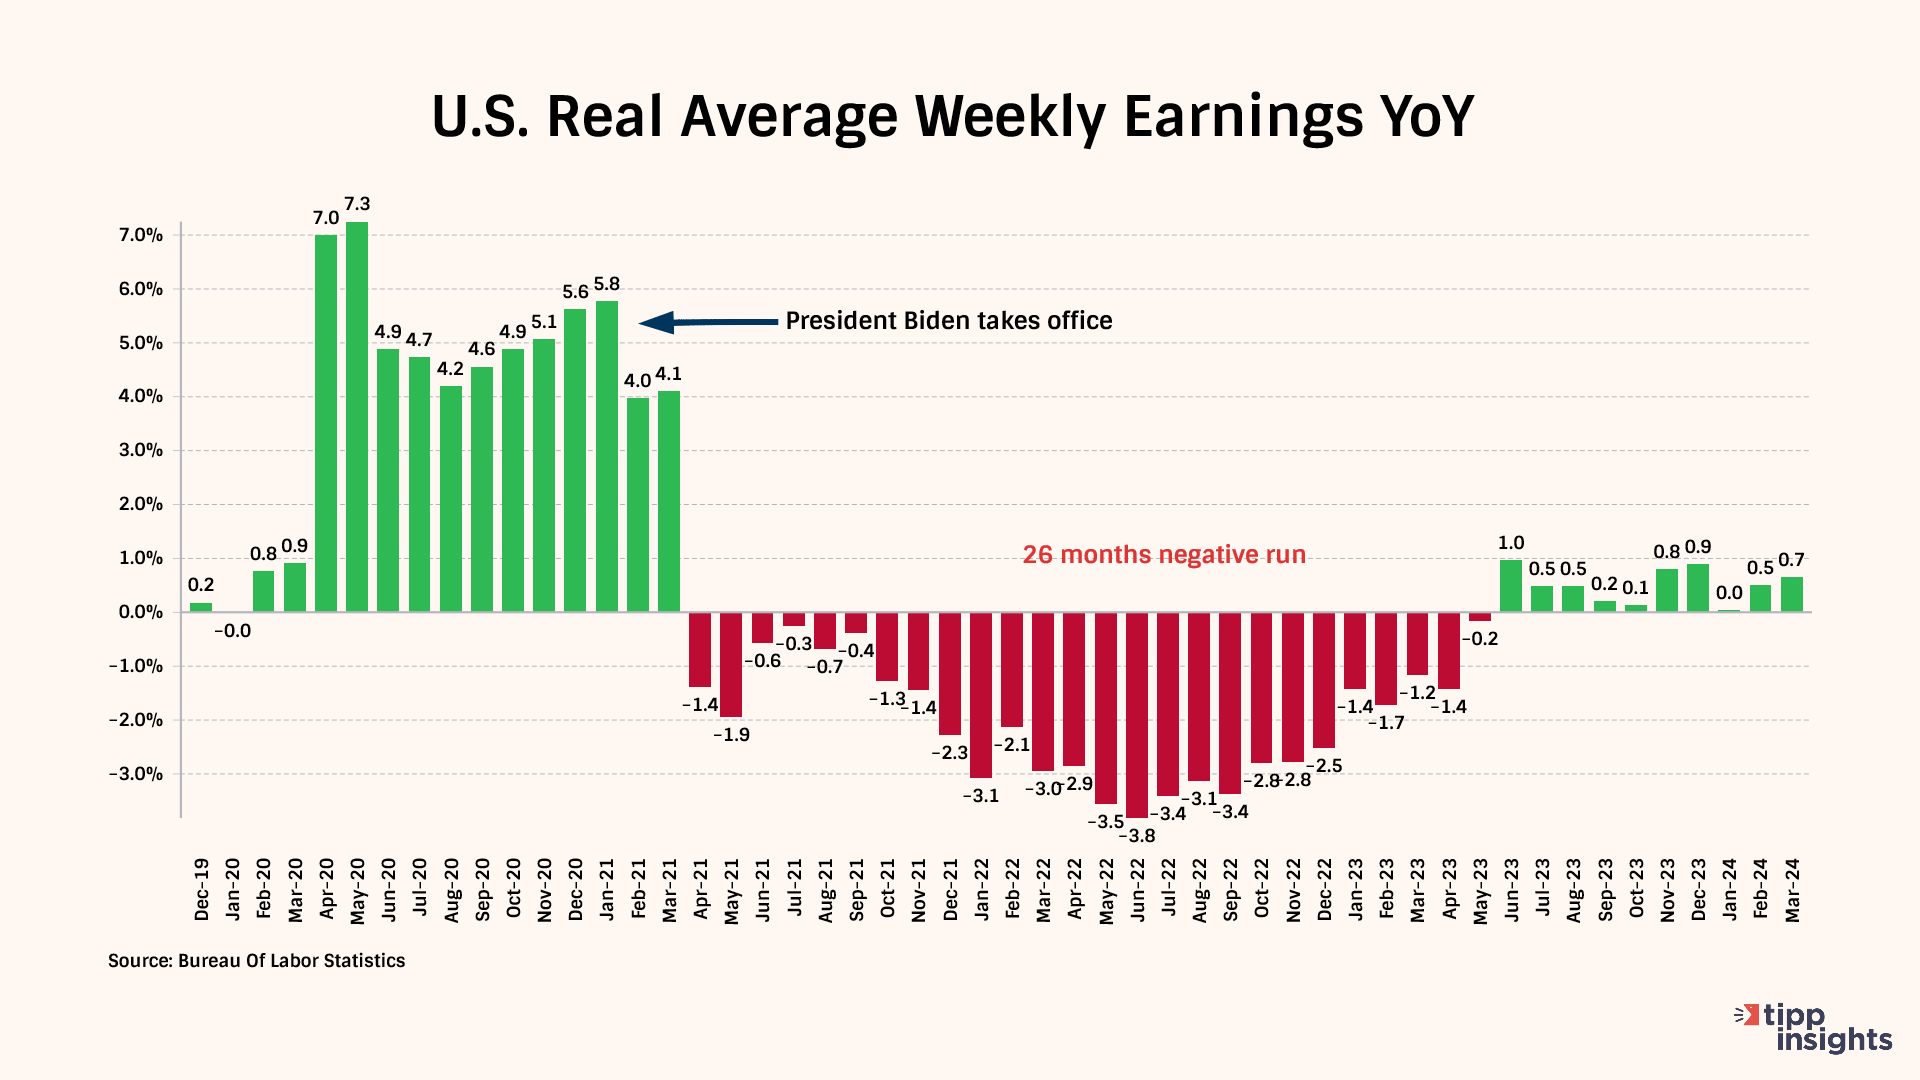
Nominal wages represent the amount of money one earns without considering changes in the cost of living. On the other hand, real wages consider inflation and measure the purchasing power of wages. Real wages provide a more accurate reflection of what is affordable with the income earned by factoring in the changes in the cost of living.
Real weekly wages, measured year-over-year, showed negative readings for 26 out of the 38 months during the Biden presidency from February 2021 to March 2024. The 26-month negative streak was broken in June. The measure has posted positive readings for nine months, from July 2023 and March 2024.
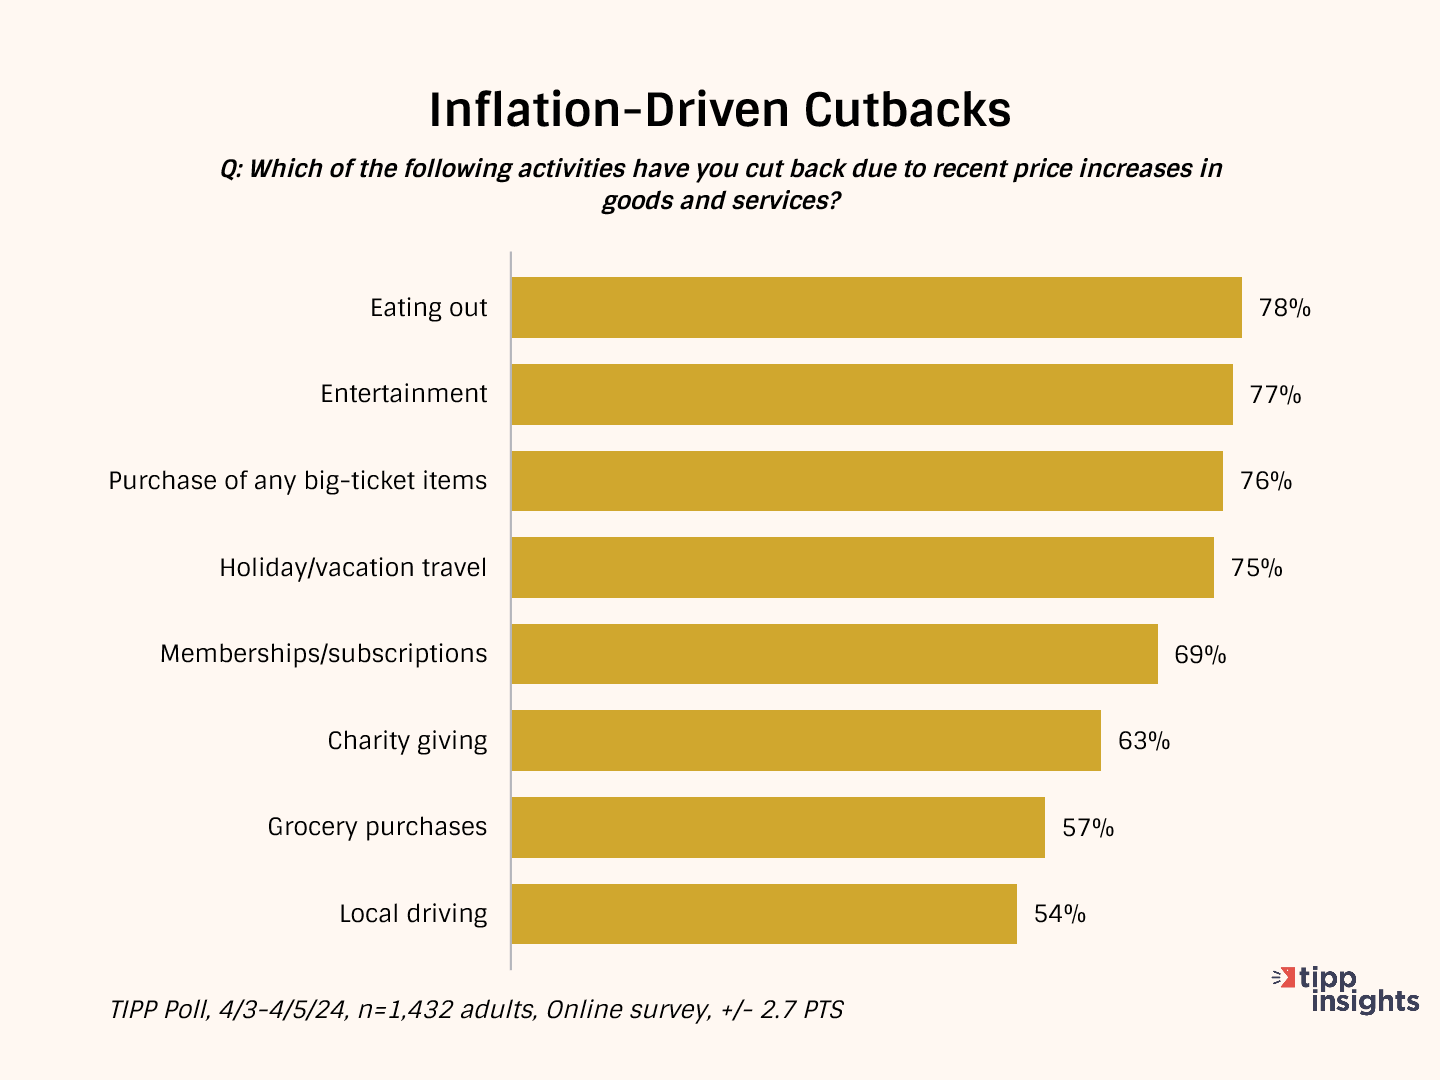
As a result of inflation, Americans are cutting back on household spending.
They are cutting back on eating out (78%), entertainment (77%), purchasing big-ticket items (76%), holiday/vacation travel (75%), and memberships/subscriptions (69%).
Nearly two-thirds (63%) are cutting back on charity giving. Over one-half (57%) of households spend less on groceries. The high gasoline prices forced 54% to cut back on local driving.
American Dream Of Owning A Home
Bidenflation has not been kind to help Americans realize their dream of owning a home.
According to Freddie Mac, when Biden took office, the average 30-year home mortgage rate in 2021 was 2.96%. The rate rose to 5.34% in 2022 and 6.81% in 2023. The Fed's Funds Rate, which steadily increased from near zero in April 2022 to about 5.50%, has little impact on the 30-year mortgage rate, but a tightening inflationary picture has helped push mortgage rates higher and higher. The current 30-year rate is about 7.0%. Home prices have skyrocketed due to a severe housing shortage resulting from a surge in migration and unmet demand for new home construction. Further, many Americans who now own homes at low-interest rates locked for 15 years cannot sell because they will have to buy at higher interest rates. These factors have made it extraordinarily difficult for first-time home buyers, as many homes stay out of reach.
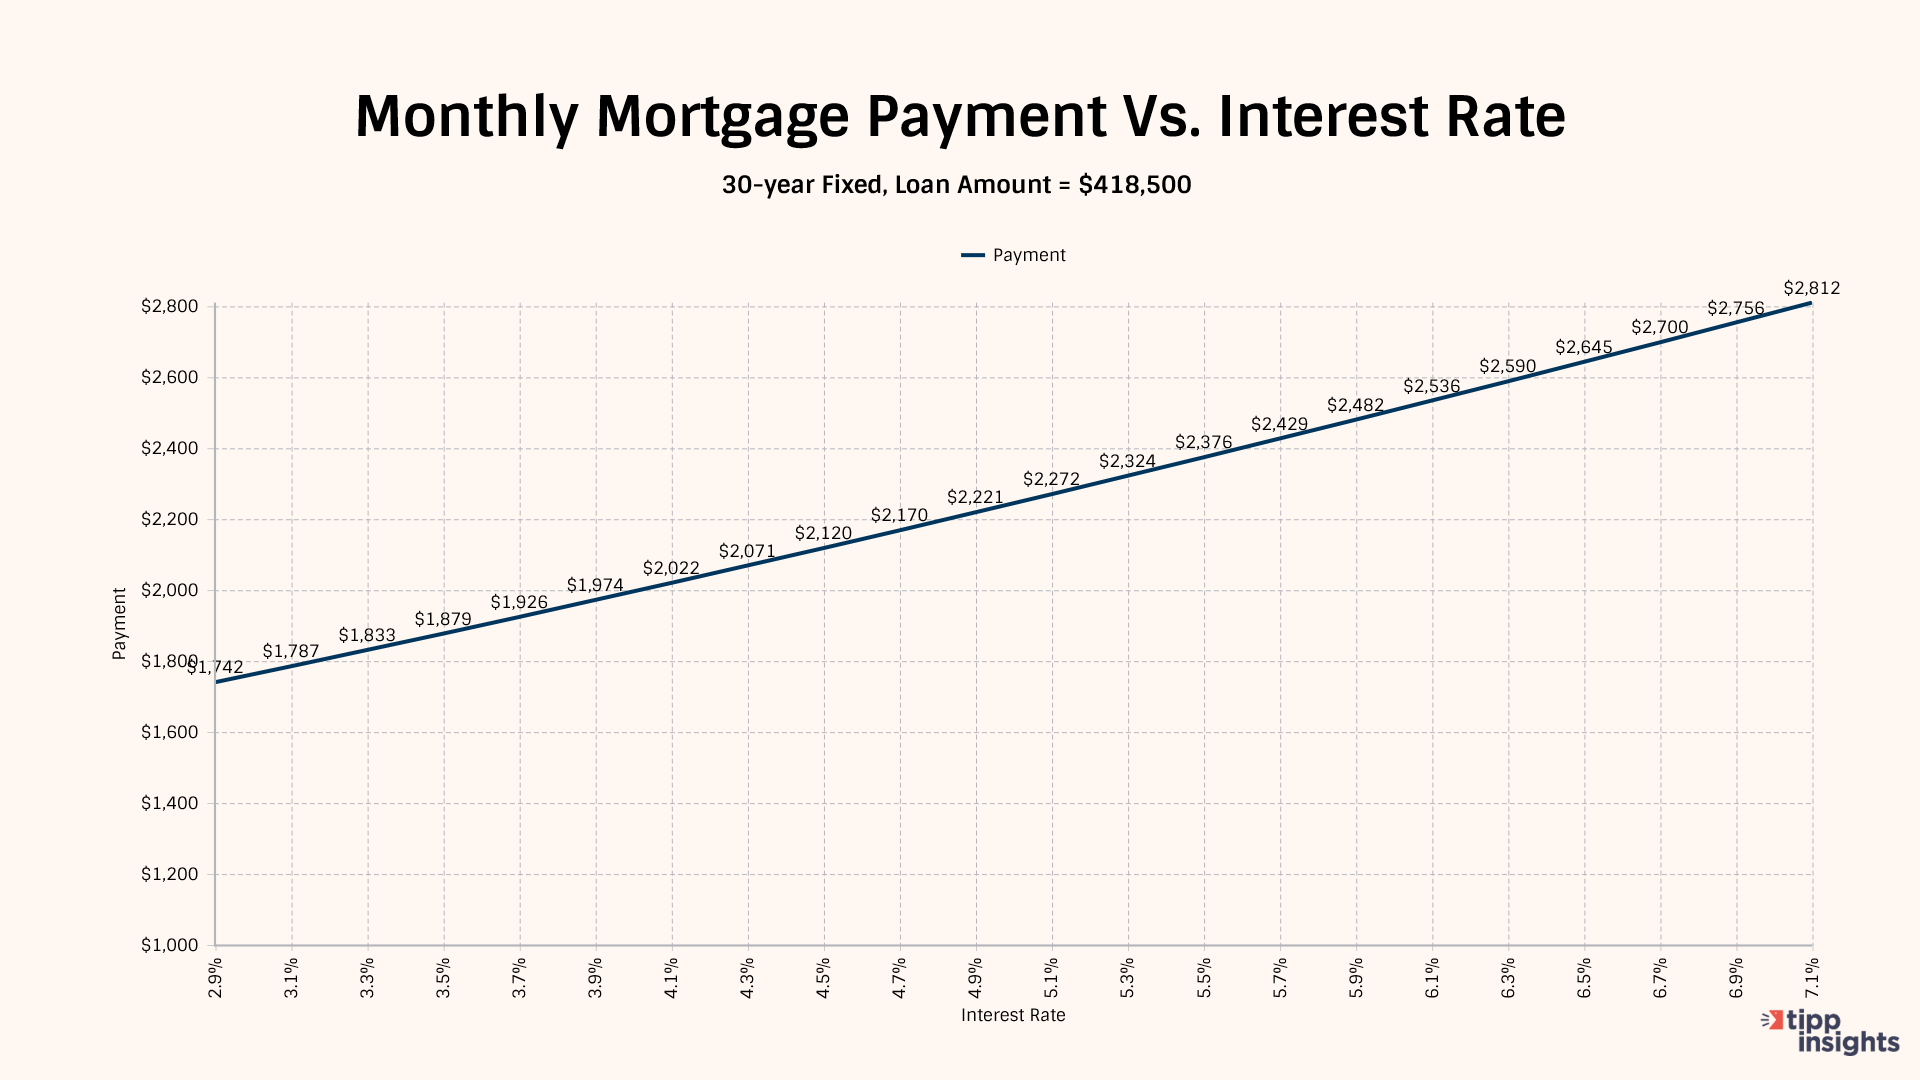
We chart below how rising mortgage rates have affected the average American household. The average home price in America is about $465,000. Assuming that a family makes a downpayment of 10%, they would borrow $418,500 over 30 years. Of course, the interest rates remain fixed, but the monthly set-aside for mortgage payments increases steadily with each new family aspiring to own a home. This set aside does not include other homeowner costs, like home insurance rates, which are steadily rising, maintenance, and real estate taxes, which are rising too.
Inflation Direction
The chart below compares the 12-month average of monthly changes against the 6-month and the 3-month averages. We also show the reading for March 2024.
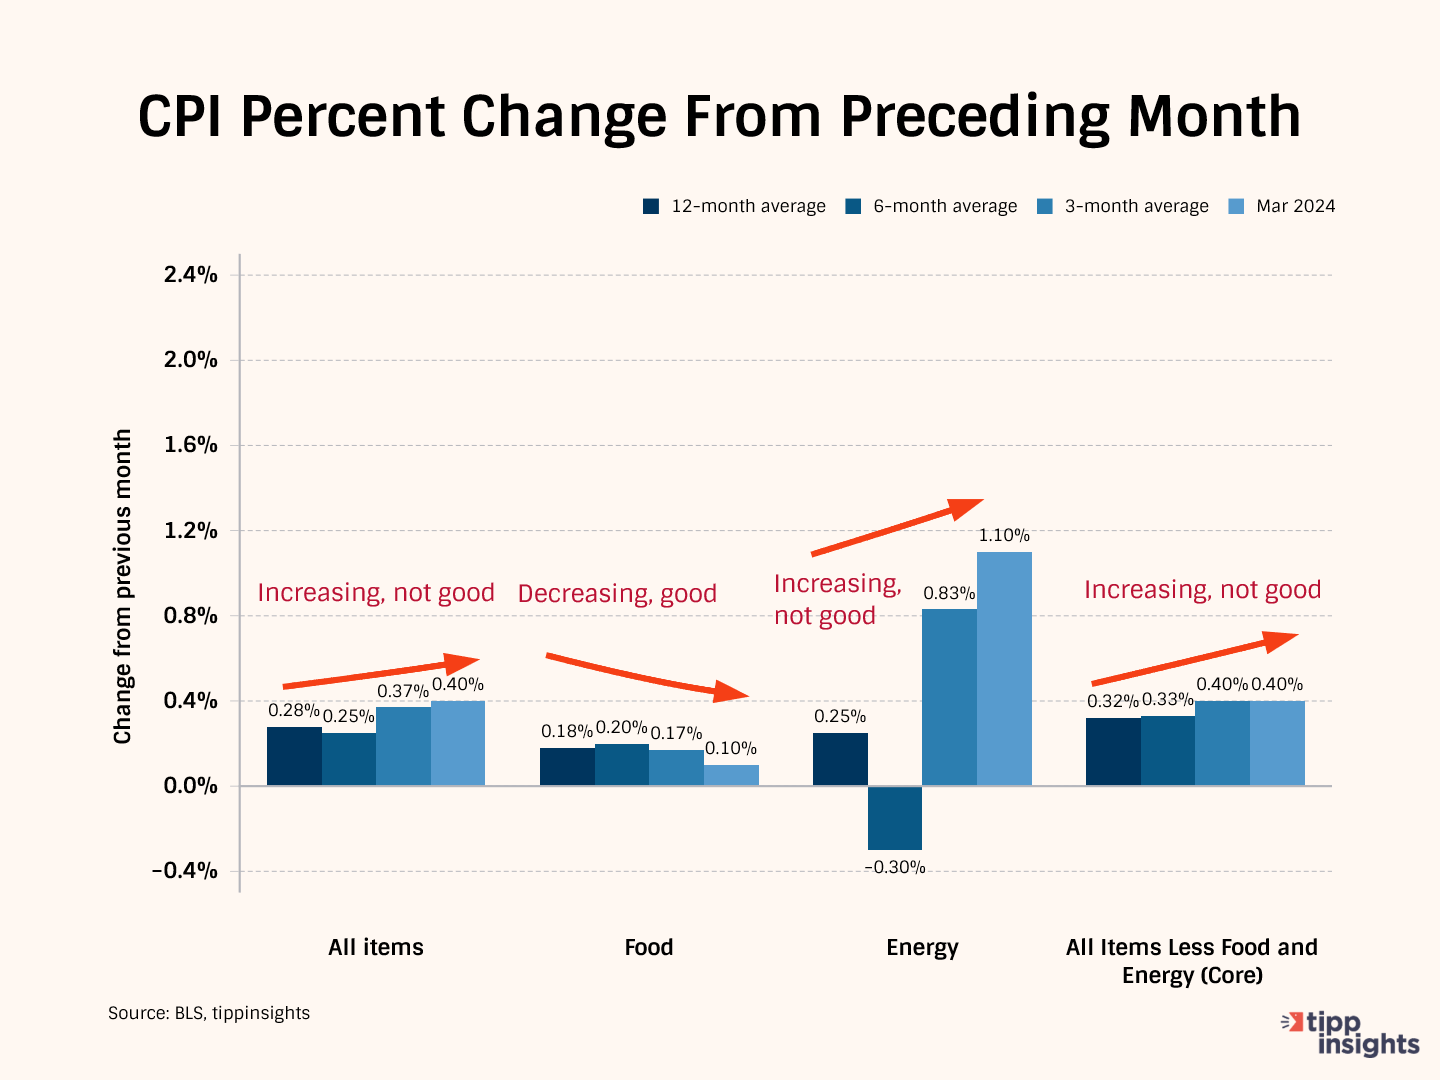
The 12-month average considers 12 data points and presents a long-term reference, while the six-month and three-month averages consider recent data points.
Typically, we compare the data from March 2024 to the three-month average to gain a clearer perspective. In March 2024, the price increase for All items was 0.40%, bigger than the three-month average of 0.37%. This shows a significant deterioration in March.
Meanwhile, the three-month average of 0.37% is larger than the six-month average of 0.25%, indicating a recent acceleration in the rate of increase over the last three months.
This pattern suggests that price increases sharply accelerated in March, a cause for concern.
In March, Food prices increased by 10%, which is smaller than the 3-month average of 0.17% and the 6-month average of 0.20%. The slowdown suggests food prices are not increasing, which is welcome news.
Meanwhile, Energy prices increased by 1.10%, which is bigger than the three-month average of 0.83%, indicating acceleration. Further, the three-month average increased compared to the 12-month average of 0.25% and the six-month average of -0.30%. In summary, the energy situation is deteriorating.
All items less food and energy, known as "core inflation," was 0.40%, the same as the three-month average of 0.40%. However, the three-month average of 0.40% was greater than the six-month average of 0.33%. The data shows a mixed picture.
In summary, apart from food, we witnessed a deterioration in the prices of energy, core items, and all other items in March. Typically, there is a lag between the increase in energy and food prices. Consequently, we anticipate a rise in food prices in the coming months due to the spike in energy prices.
Monetary Policy
Since March 2022, the Fed has raised interest 11 consecutive times, bringing its benchmark interest rate to 5.25%, the highest level in 22 years.
With the core CPI entrenched at 3.8% and geopolitical tensions that could lead to volatility in the energy markets, we are unsure of what lies ahead. We believe it won't be easy to bring CPI inflation down to the Fed's target of 2.0%, and more rate hikes may be needed.
The national debt is $34.55 trillion, according to the Debt to the Penny dataset, which the Treasury updates daily. For the current fiscal year, which began in October 2023, the U.S. is expected to pay over $1 trillion in interest costs, more than the U.S. defense budget.
One downside of ballooning federal debt is that refinancing becomes challenging. Supply and demand in the bond market will drive interest rates. If there is a high supply of government bonds (due to high debt levels), interest rates may need to stay high to attract investors and ensure that the government can continue borrowing money.
Most Americans are concerned about the sustainability of this trajectory. The high interest rates are also hurting Americans and sapping their confidence.
According to Michael Hartnett, a BofA Global equity strategist, signs that the U.S. economy is “flipping from goldilocks to stagflation” have multiplied recently. We've been pointing to the economic stagflation for a while now.
To access the TIPP CPI readings each month, you can visit tippinsights.com. We'll publish the TIPP CPI and our analysis in the days following the Bureau of Labor Statistics (BLS) report. The upcoming release of TIPP CPI is on May 18, 2024. We'll also post a spreadsheet in our store for download.
Hey, want to dig deeper? Download data from our store for a small fee!
Want to understand better? We wrote an explainer on inflation that sixth graders could understand. Everyone can benefit from it. Milton Friedman's Priceless Lessons On Inflation.


