
The RealClearMarkets/TIPP Economic Optimism Index, a leading gauge of consumer sentiment, dropped 1.1% in March to 43.5. The index has remained in negative territory for 31 consecutive months since September 2021.
RealClearMarkets (RCM) is the new sponsor of the TIPP Economic Optimism Index, which has been continuously measuring consumer outlook since February 2001.
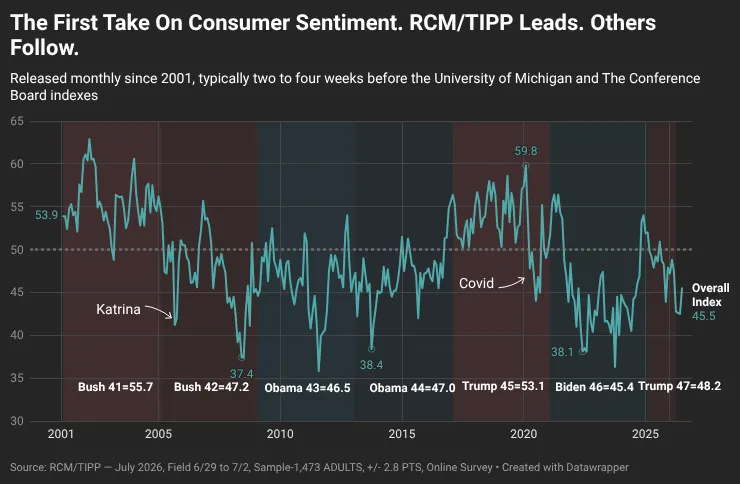
The RCM/TIPP Economic Optimism Index is the first monthly measure of consumer confidence. It accurately captures monthly changes, as reflected in other well-known surveys by The Conference Board and the University of Michigan.
RCM/TIPP Economic Optimism Index
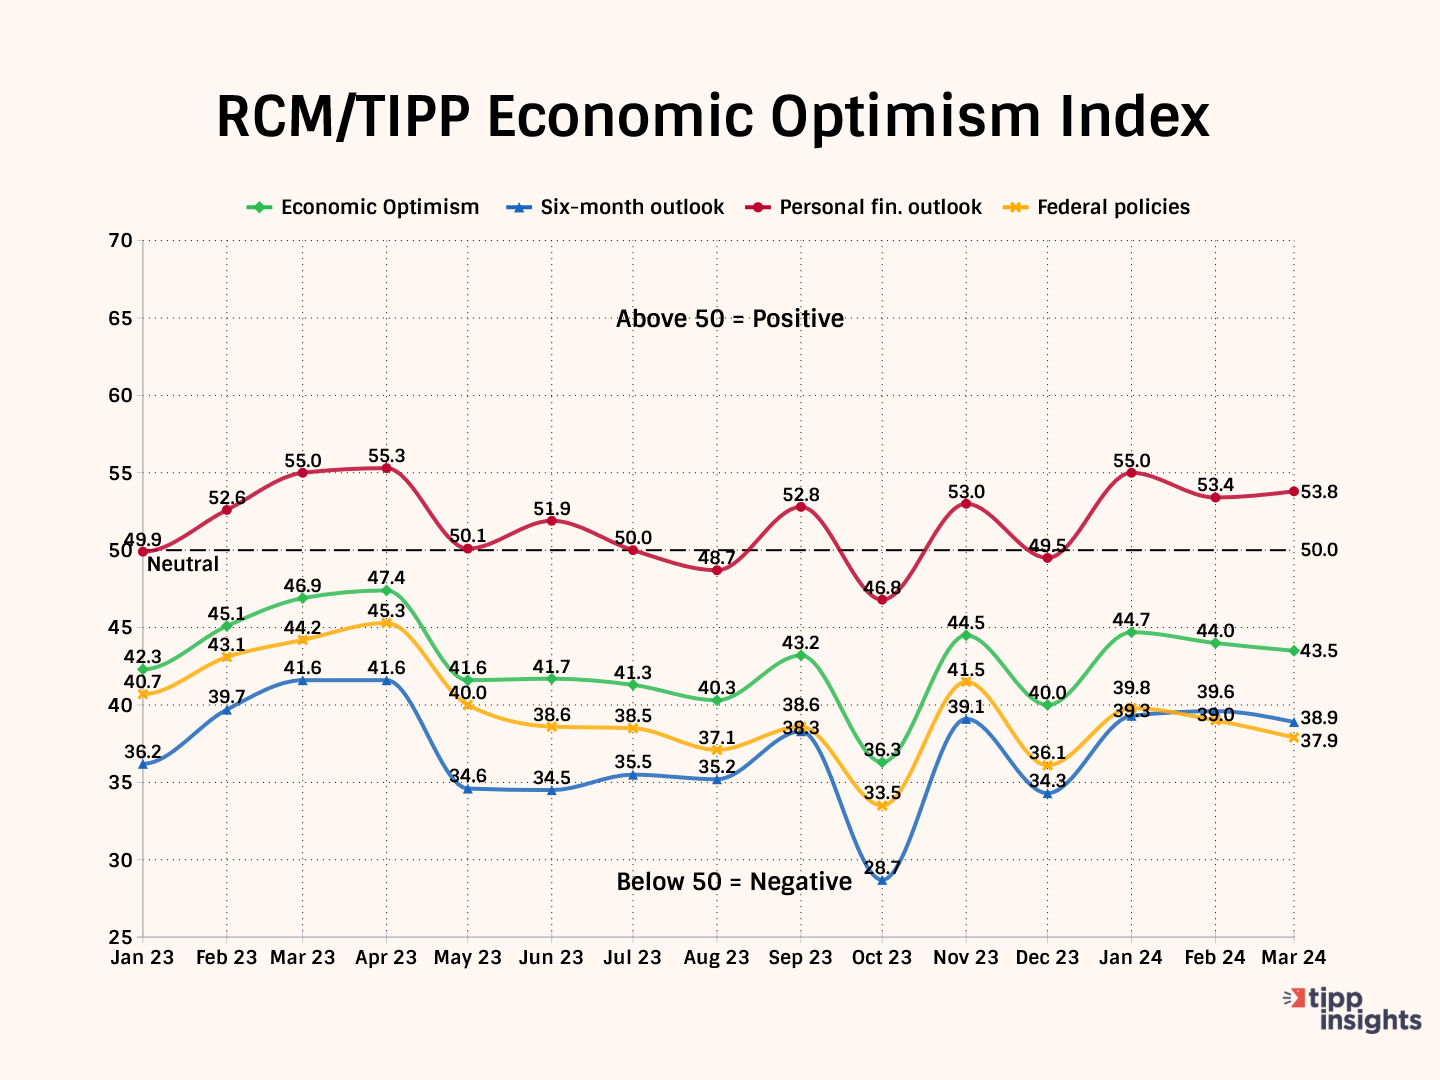
The RCM/TIPP Economic Optimism Index has three key components. For the index and its components, a reading above 50.0 signals optimism, and a reading below 50.0 indicates pessimism.
In March, two of these components declined, while one showed improvement.
- The Six-Month Economic Outlook, which measures how consumers perceive the economy's prospects in the next six months, dropped from 39.6 in February to 38.9 in March, marking a 1.8% decrease. In October 2023, this component posted 28.7, its lowest reading since the index debuted 23 years ago.
- The Personal Financial Outlook, a measure of how Americans feel about their own finances in the next six months, improved 0.7% from its previous reading of 53.4 in February to 53.8 this month. In January, the component crossed above the neutral reading of 50.0 and has since remained in positive territory for the third month.
- Confidence in Federal Economic Policies, a proprietary RCM/TIPP measure of views on the effectiveness of government economic policies, declined from 39.0 in February to 37.9, reflecting a 2.8% drop.
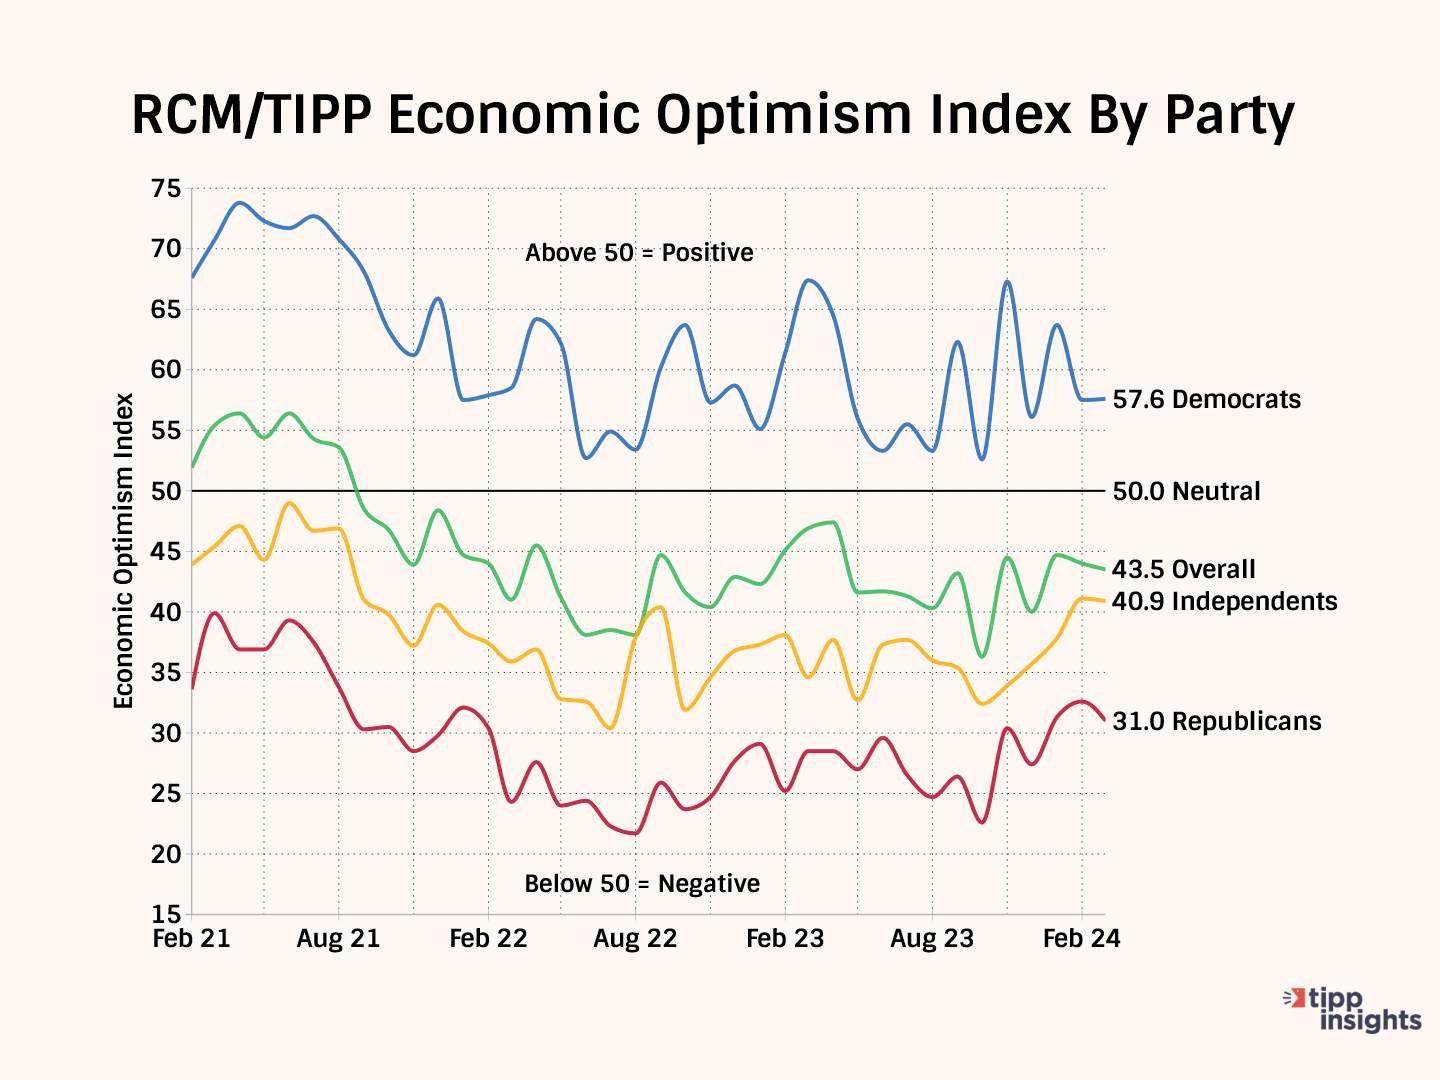
Party Dynamics
Democrats posted the highest confidence levels in March, at 57.6, edging up from 57.5 in February.
Meanwhile, Republicans' confidence declined 1.6 points to 31.0 this month. It has stayed in the pessimistic zone for 40 consecutive months since December 2020, after the last presidential election.
Independents’ confidence has been in pessimistic territory for 48 months since April 2020, the month after the onset of the pandemic. They dropped slightly by 0.2 points and posted 40.9 on the index in March.
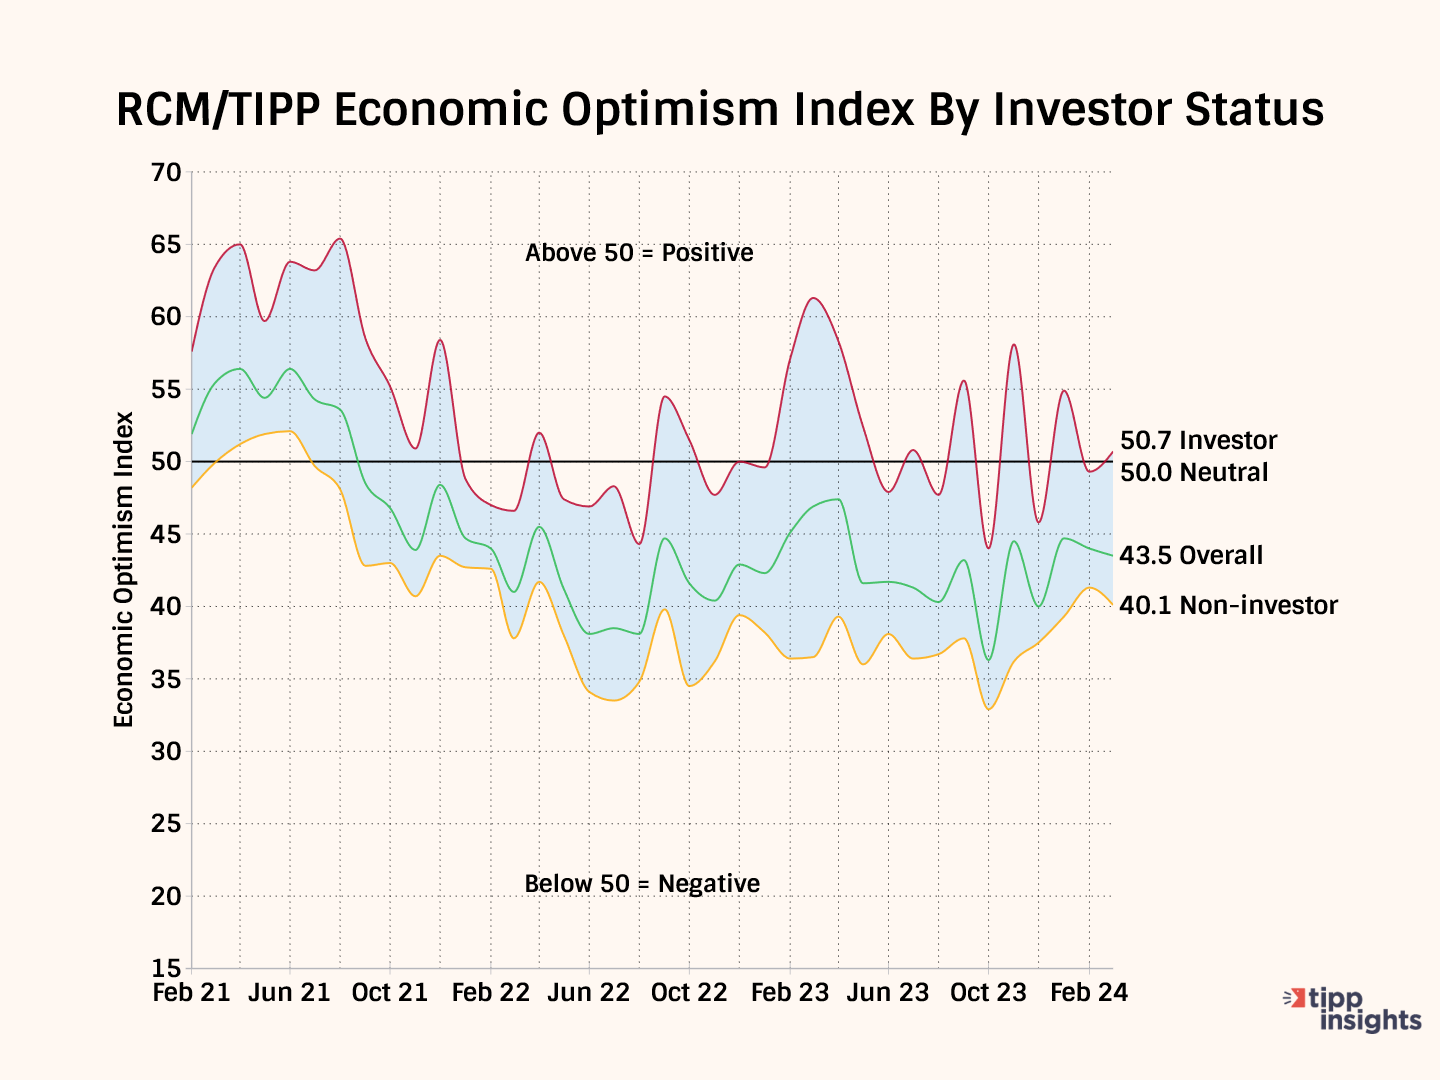
Investor Confidence
RCM/TIPP considers respondents to be "investors" if they currently have at least $10,000 invested in the stock market, either personally or jointly with a spouse, either directly or through a retirement plan. We classified 30% of respondents who met this criterion as investors and 65% as non-investors. We could not ascertain the status of 5% of respondents.
Reflecting the recent stock market gains, optimism among investors gained 2.8% from 49.3 in February to 50.7 in March, while it dropped by 2.9% among non-investors, from 41.3 in February to 40.1 in March.
The economic optimism gap between investors and non-investors is 10.6 in March, widening from 8.0 in February.
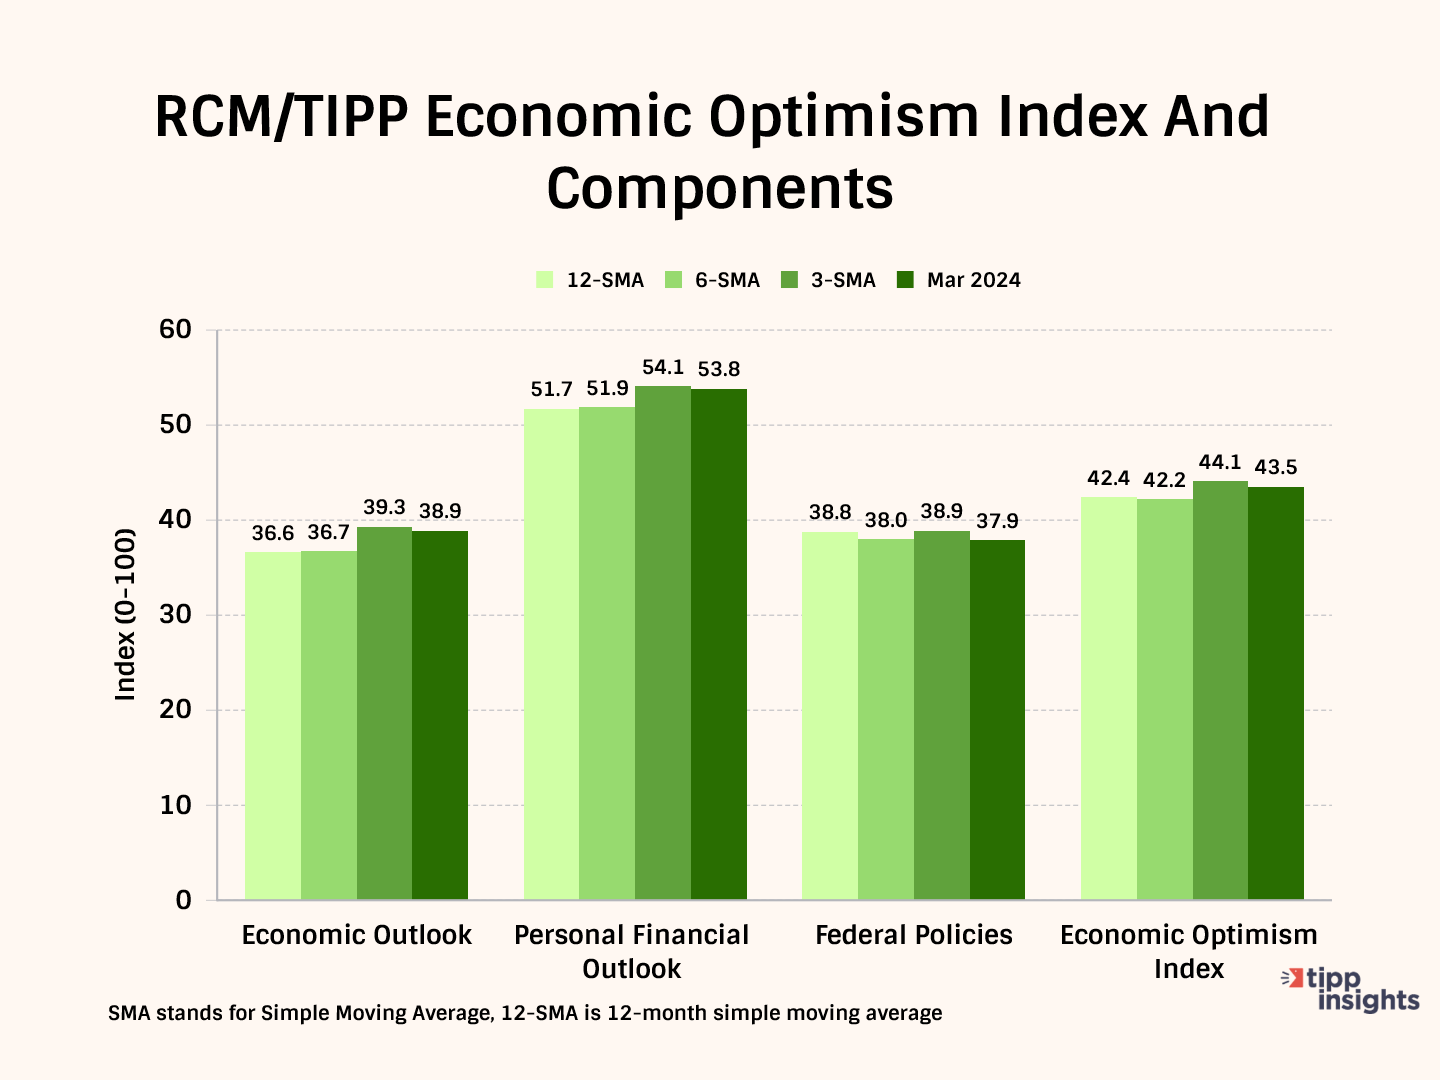
Momentum
Comparing a measure's short-term average to its long-term average is one way to detect its underlying momentum. For example, if the 3-month average is higher than the 6-month average, the indicator is bullish. The same holds if the 6-month average exceeds the 12-month average.
In March, all three components and the Economic Optimism Index are lower than their three-month moving averages. However, the three-month moving averages for all the components and the Optimism Index are higher than the six-month moving average. As a result, the data shows a mixed picture.
Demographic Analysis
The number of groups in the positive zone indicates the breadth of optimism in American society. This month, three of the 21 demographic groups we track—such as age, income, education, race, etc. —are above 50.0, indicating optimism on the Economic Optimism Index. Starting with three groups in January 2023, we saw steady improvement, peaking at nine groups in April and then declining to one group in August. Since August, it has moved in the range of one to six. In March, only three groups are in the positive zone.
Ten of the 21 groups improved on the index, compared to 10 in February and 19 in January.
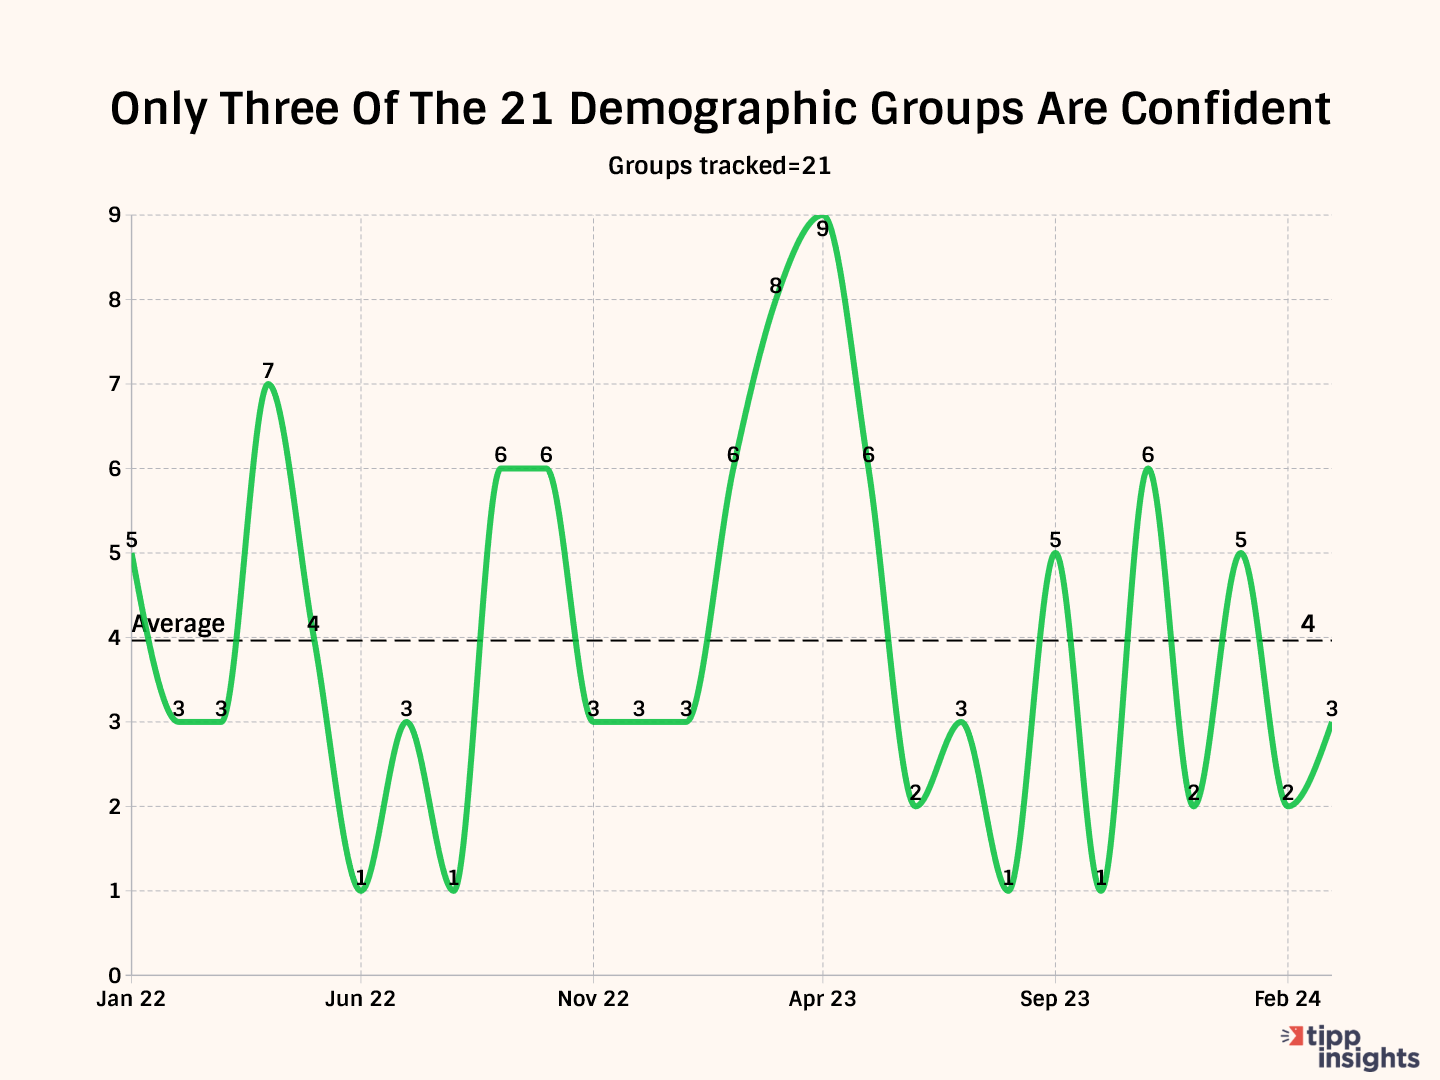
Why do we look at this? It shows the breadth of optimism.
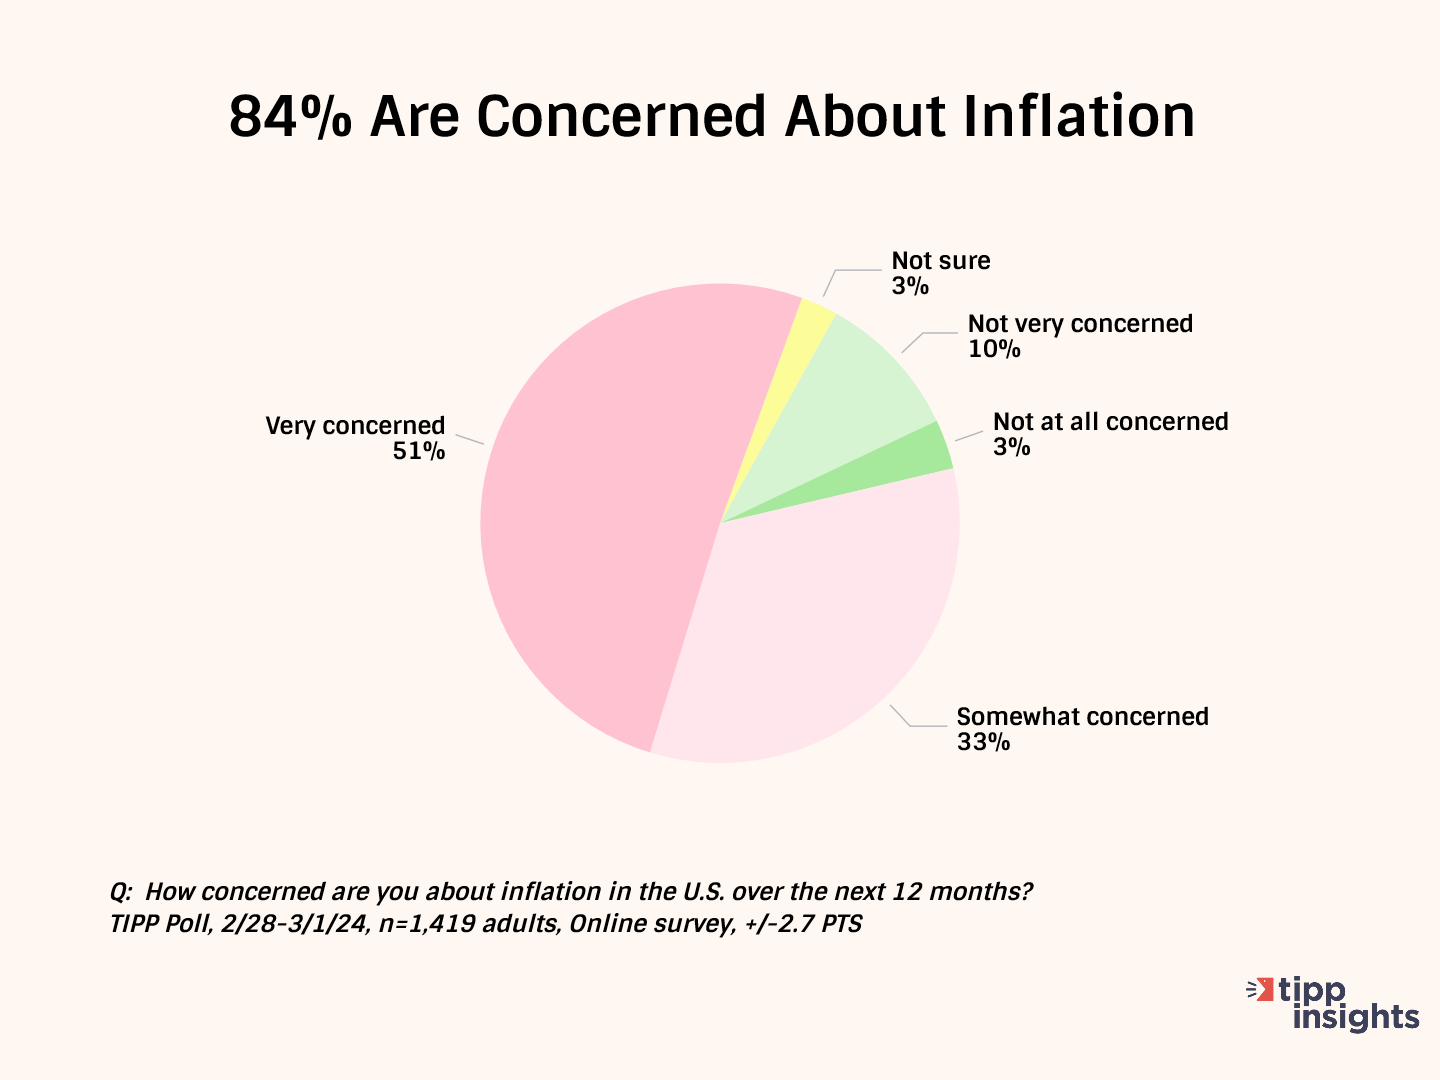
Inflation
Inflation acts as a form of indirect tax on American households. According to a recent TIPP survey, 84% are worried about inflation. One-half (51%) are very concerned, and another 33% are somewhat concerned.
Even though the CPI rate has declined from a 40-year high of 9.1% in June 2022 to 3.1% in January 2024, Americans continue to be hurt because real wages have not improved.
The Federal Reserve believes that long-run inflation of 2%, measured by the annual change in the price index for personal consumption expenditures, is most consistent with its maximum employment and price stability mandate.
We will cover inflation in greater depth after the upcoming release of the CPI on March 12.
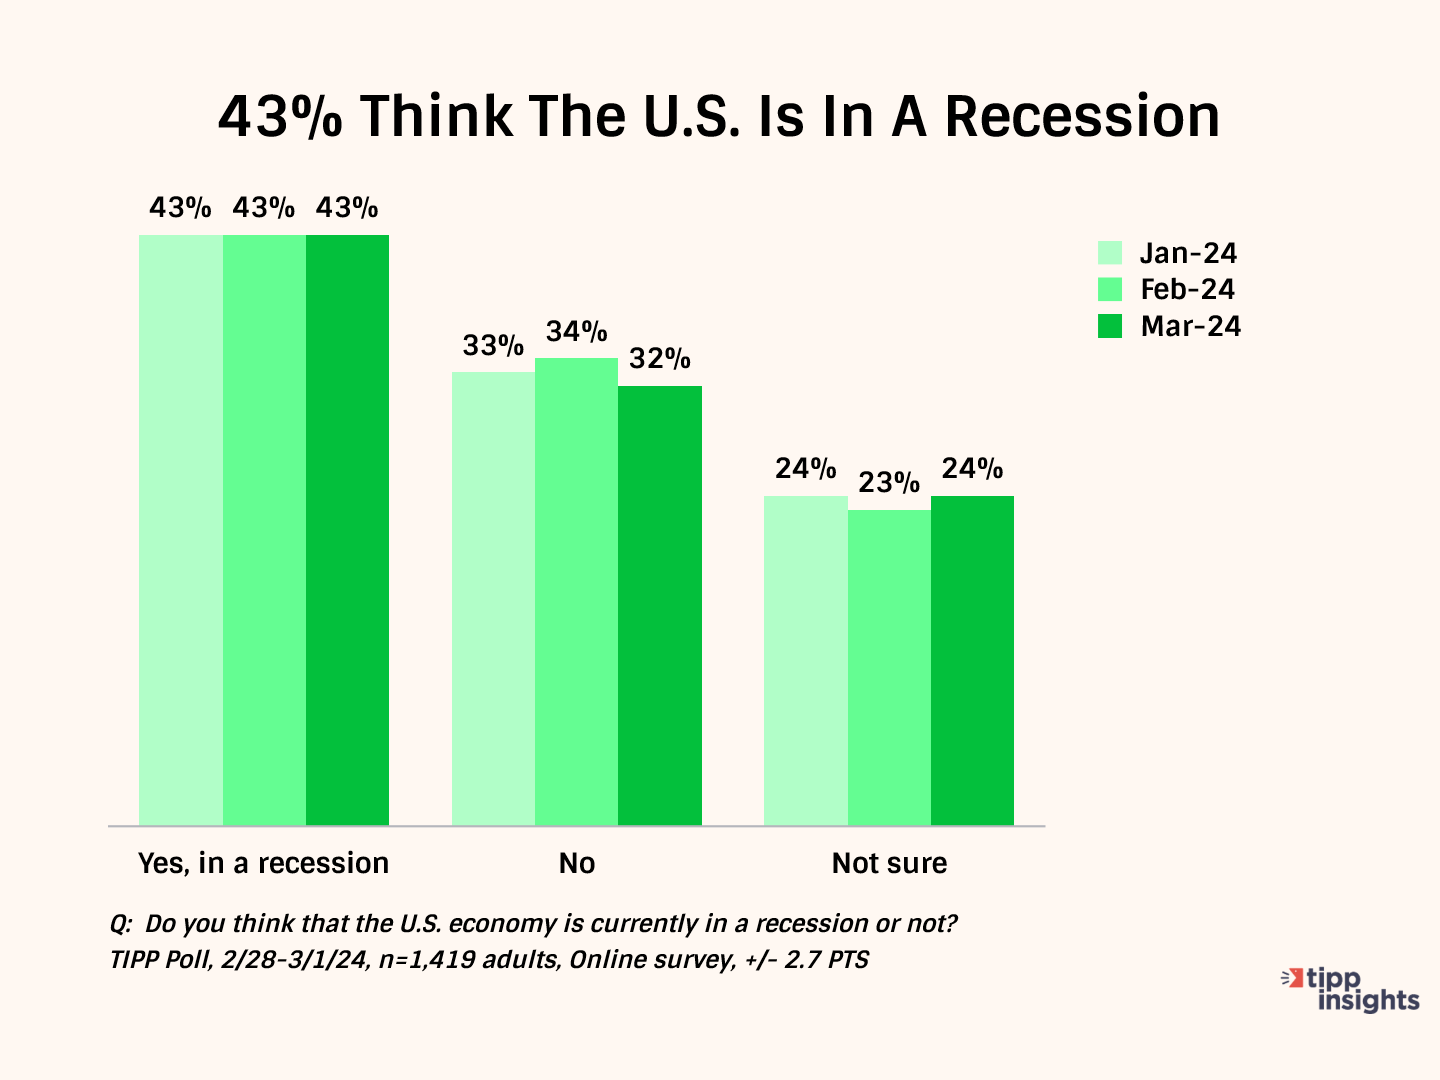
Recession
Four in ten (43%) Americans believe we are in a recession, while 24% are unsure. 32% believe we are not in a recession. Interestingly, the share of Americans who feel we are in a recession has stayed at 43% since January.
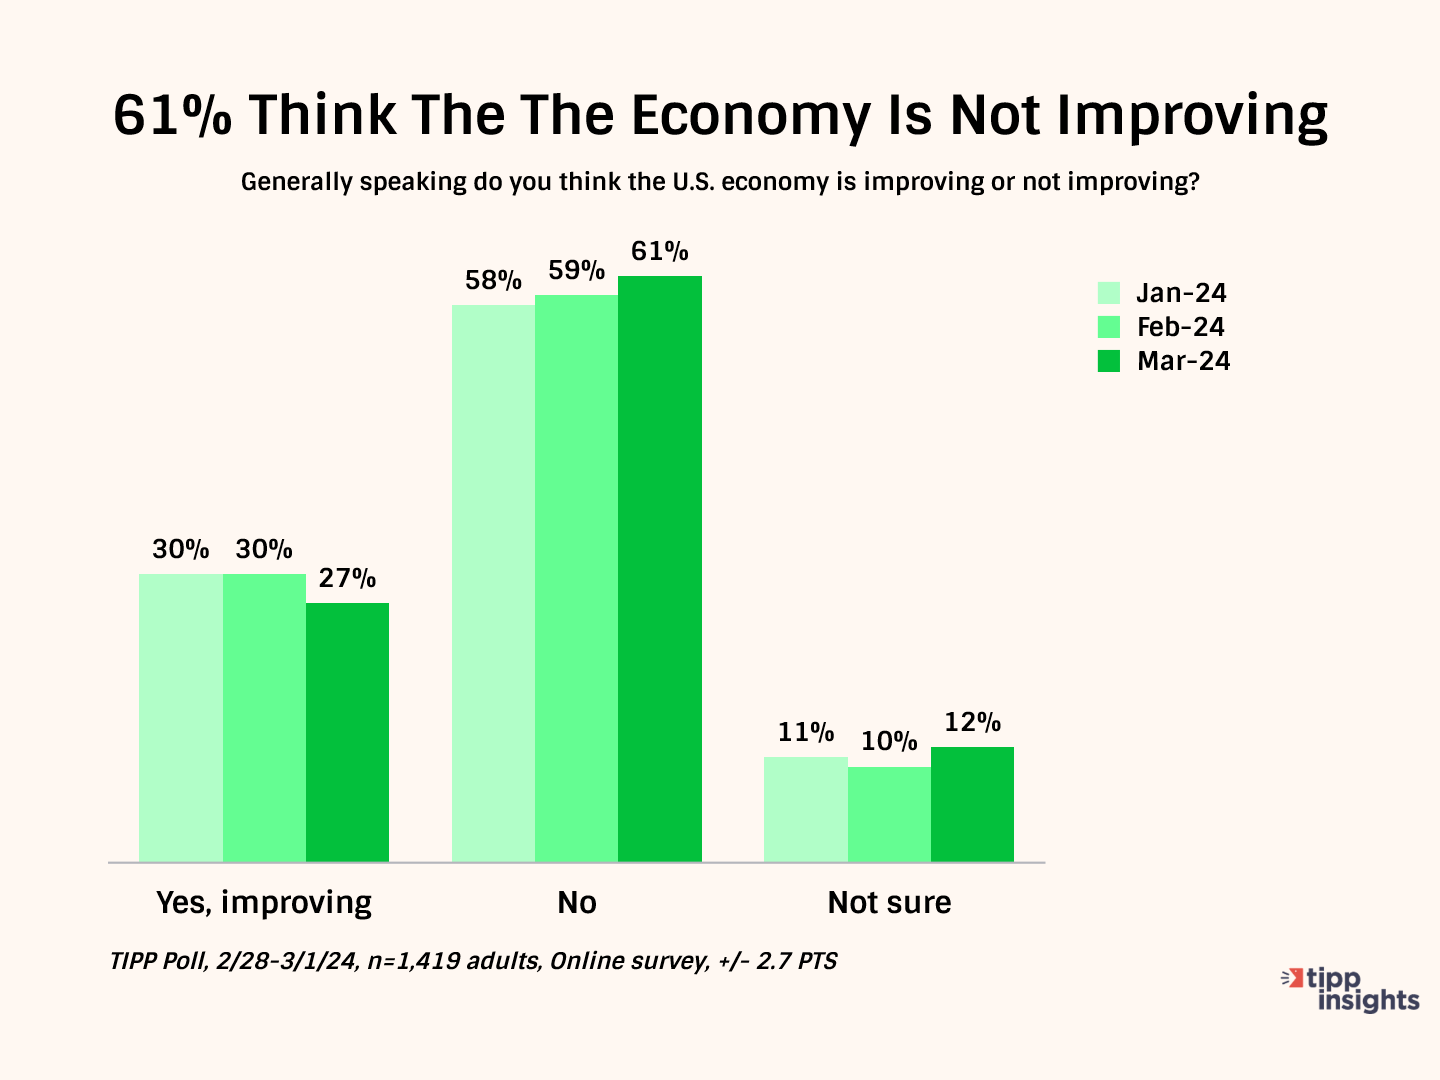
Further, over one-half (61%) think the U.S. economy is not improving, while 27% believe it is improving.
Fiscal Profligacy
Government spending has spiraled out of control, resulting in a national debt exceeding $34 trillion. The debt is increasing by $1 trillion every 100 days.
One downside of ballooning federal debt is that refinancing becomes challenging. Supply and demand in the bond market will drive interest rates. If there is a high supply of government bonds (due to high debt levels), interest rates may need to stay high to attract investors and ensure that the government can continue borrowing money.
Most Americans are concerned about the sustainability of this trajectory. The high interest rates are also hurting Americans and sapping their confidence.
We anticipate a stagflationary economy in 2024. The risks on the downside outweigh those on the upside. Watch the real estate, stock, and job markets, and see if Washington can pass spending bills.
Using an online survey, TIPP polled 1,419 adults nationwide from February 28 to March 1. Our next report will be released on Tuesday, April 9. A more detailed methodology is available here.


