
The International Day of Happiness, established by the United Nations General Assembly in 2012 to promote global awareness of the significance of happiness in people's lives, is celebrated worldwide on March 20th. The 2024 World Happiness Report, a collaboration between Gallup, the Oxford Wellbeing Research Centre, the U.N. Sustainable Development Solutions Network, and the WHR's Editorial Board, was released to coincide with this celebration.
The report shows that the U.S. fell out of the top 20 for the first time in 12 years, now ranking 23rd, down from 15th last year.
However, despite this decline, our ongoing tracking of Americans' happiness levels reveals some positive news. Since March 2022, we have been monitoring Americans’ happiness monthly.
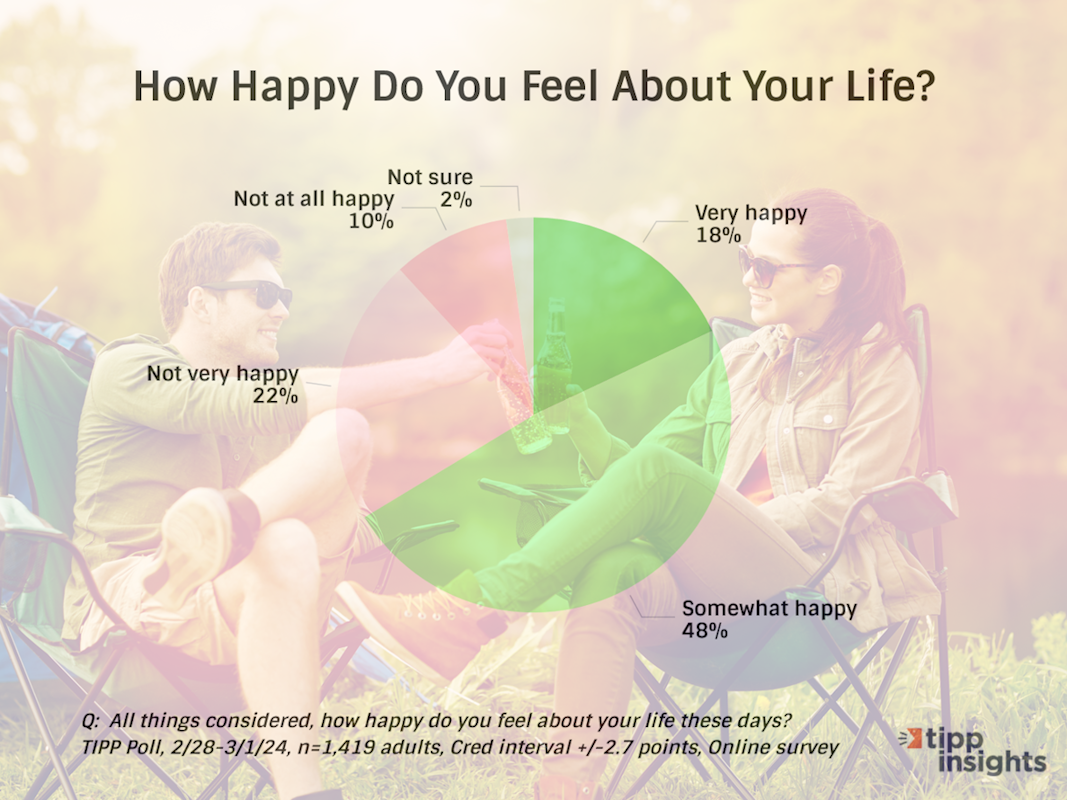
Despite financial stress and other challenges, two-thirds of Americans (64%) say they are happy with their lives, with 18% being very happy and another 48% somewhat happy. Further, a majority of all the 36 demographic groups we analyze are either very happy or somewhat happy.
The data comes from a TIPP Poll of 1,419 adults nationwide completed in early March.
Happiness Index
TechnoMetrica, in its tradition of out-of-box thinking, developed the Happiness Index, a barometer of Americans' happiness, based on the question: All things considered, how happy do you feel about your life these days?
The chart shows the answers to the question for March.
We converted the raw responses to a compact index to compare demographic segments and track happiness over time.
The index ranges from 0 to 100. Higher numbers indicate greater happiness, while lower numbers indicate decreased happiness. 50 is a neutral value.
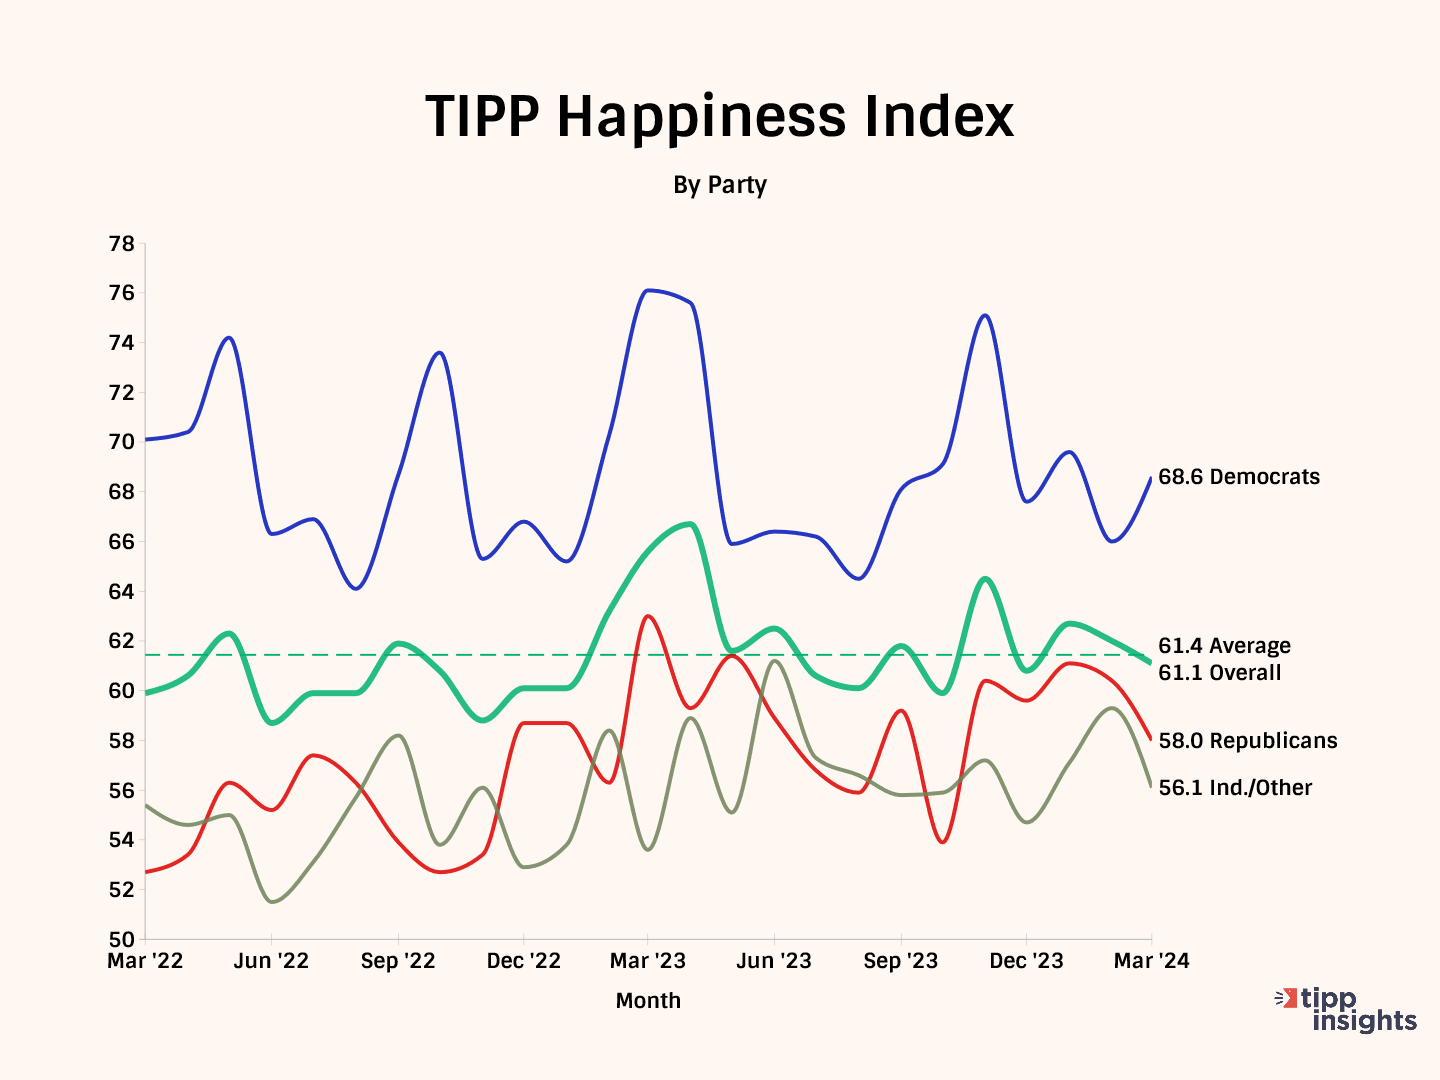
Contrary to the World Happiness Report, our tracking shows that Americans’ happiness improved from an average of 60.3 in 2022 to 62.3 in 2023.
This month, the TIPP Happiness Index posted 61.1, with Democrats (68.6) scoring the highest, followed by Republicans (58.0) and independents (56.1)
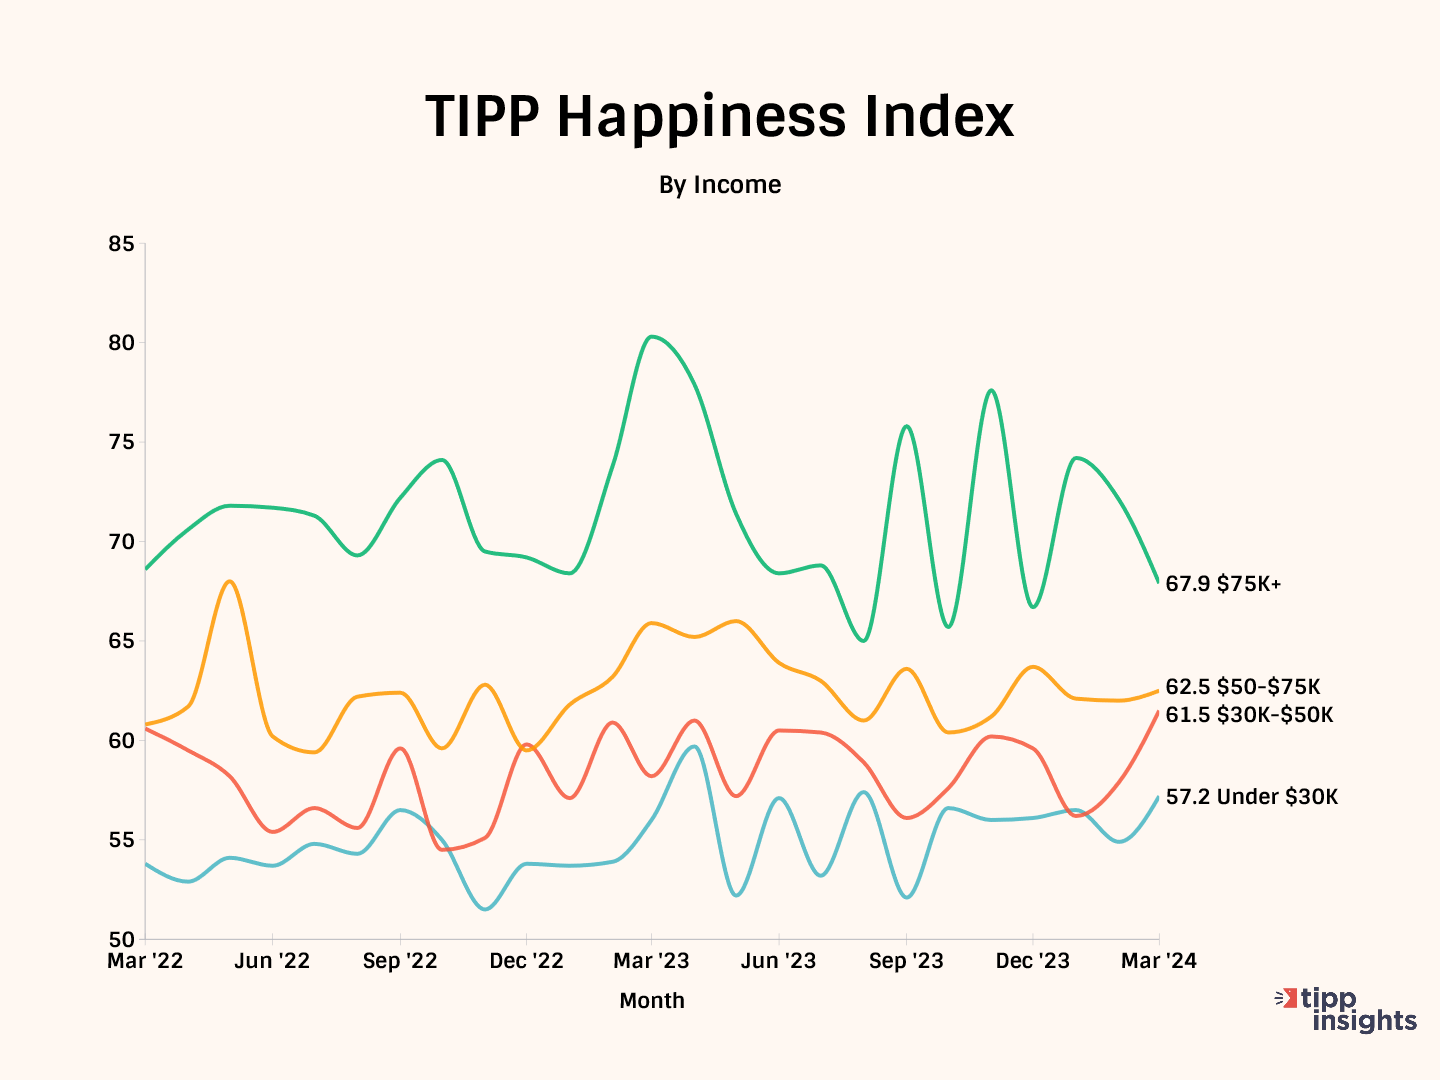
Our data shows that happiness increases with income. The green line on the chart represents the $75K+ income group, which is consistently above the next income strata of $50K-$75K. Further, the $50-$75K group shows higher happiness than the $30K-$50K group. The under $30K group registered the lowest score almost throughout the period.
Notice the difference in happiness scores between the $75K and $30K groups, which is a whopping 10.7 points.
Under The Hood
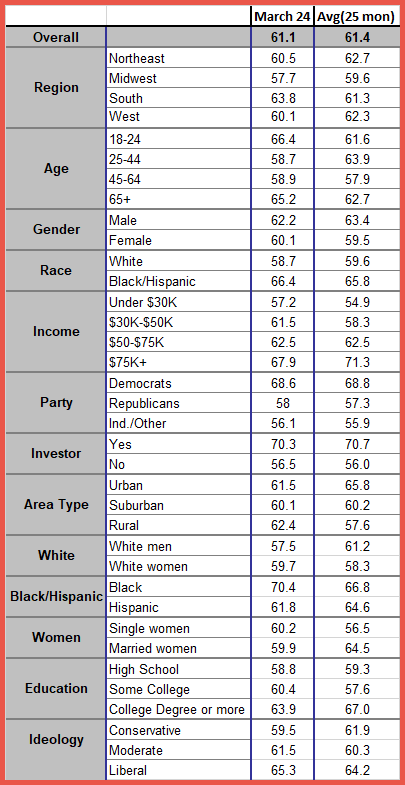
All 36 demographic groups we track are above 50 in March, indicating happiness.
The table below shows the TIPP Happiness Index for this month and the 25-month average of the index.
The demographic groups with the highest Happiness Index scores are Blacks (70.4), investors (70.3), Democrats (68.6), households with income of $75K+ (67.9), and the 18-24 age group (66.4).
On the other hand, the groups with the lowest Happiness Index scores are independents (56.1), non-investors (56.5), households with incomes less than $30K (57.2), white men (57.5), and the Midwest (57.7)
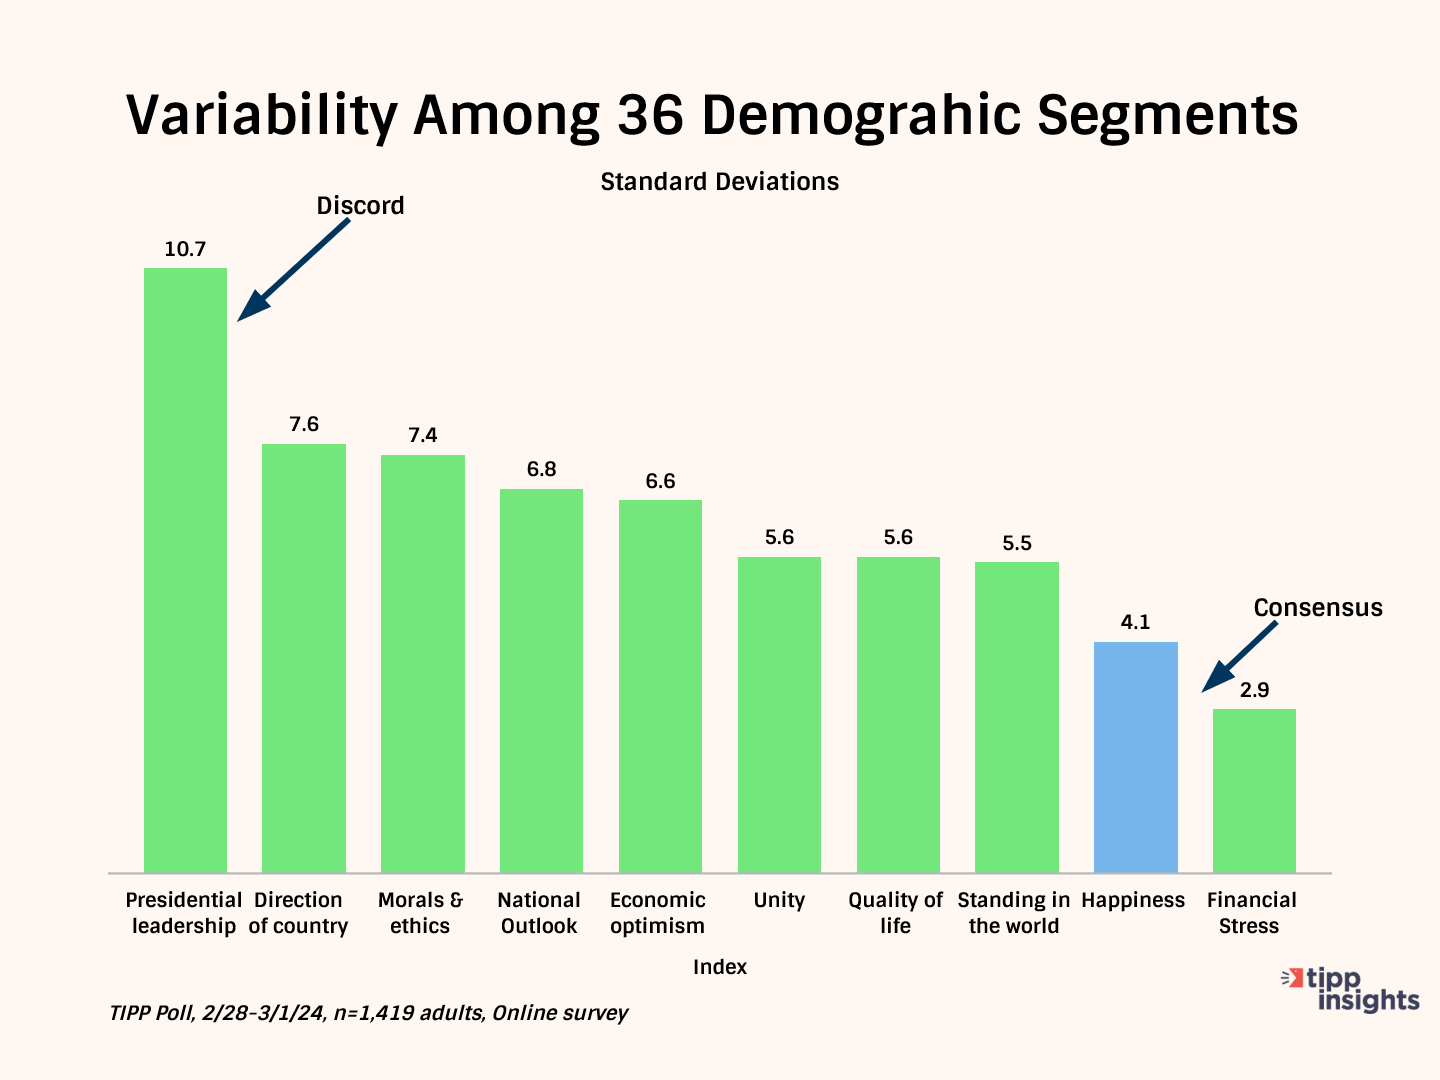
We compared the standard deviations of TIPP indexes across the 36 demographic groups to better understand the variability of the Happiness index.
The chart below shows that financial stress and happiness exhibit the least variation, meaning better consensus among the 36 groups. The presidential leadership index and the country's direction exhibit the greatest variation, meaning a lack of consensus among the 36 groups.
Note the position of the Happiness Index.
Financial Stress And Happiness Index
To better understand the relationship between financial stress and happiness, we plotted the RCM/TIPP Financial Stress Index and the TIPP Happiness Index for selected demographic groups. We divided the data into four quadrants using the overall index values for the Financial Stress Index and Happiness Index.
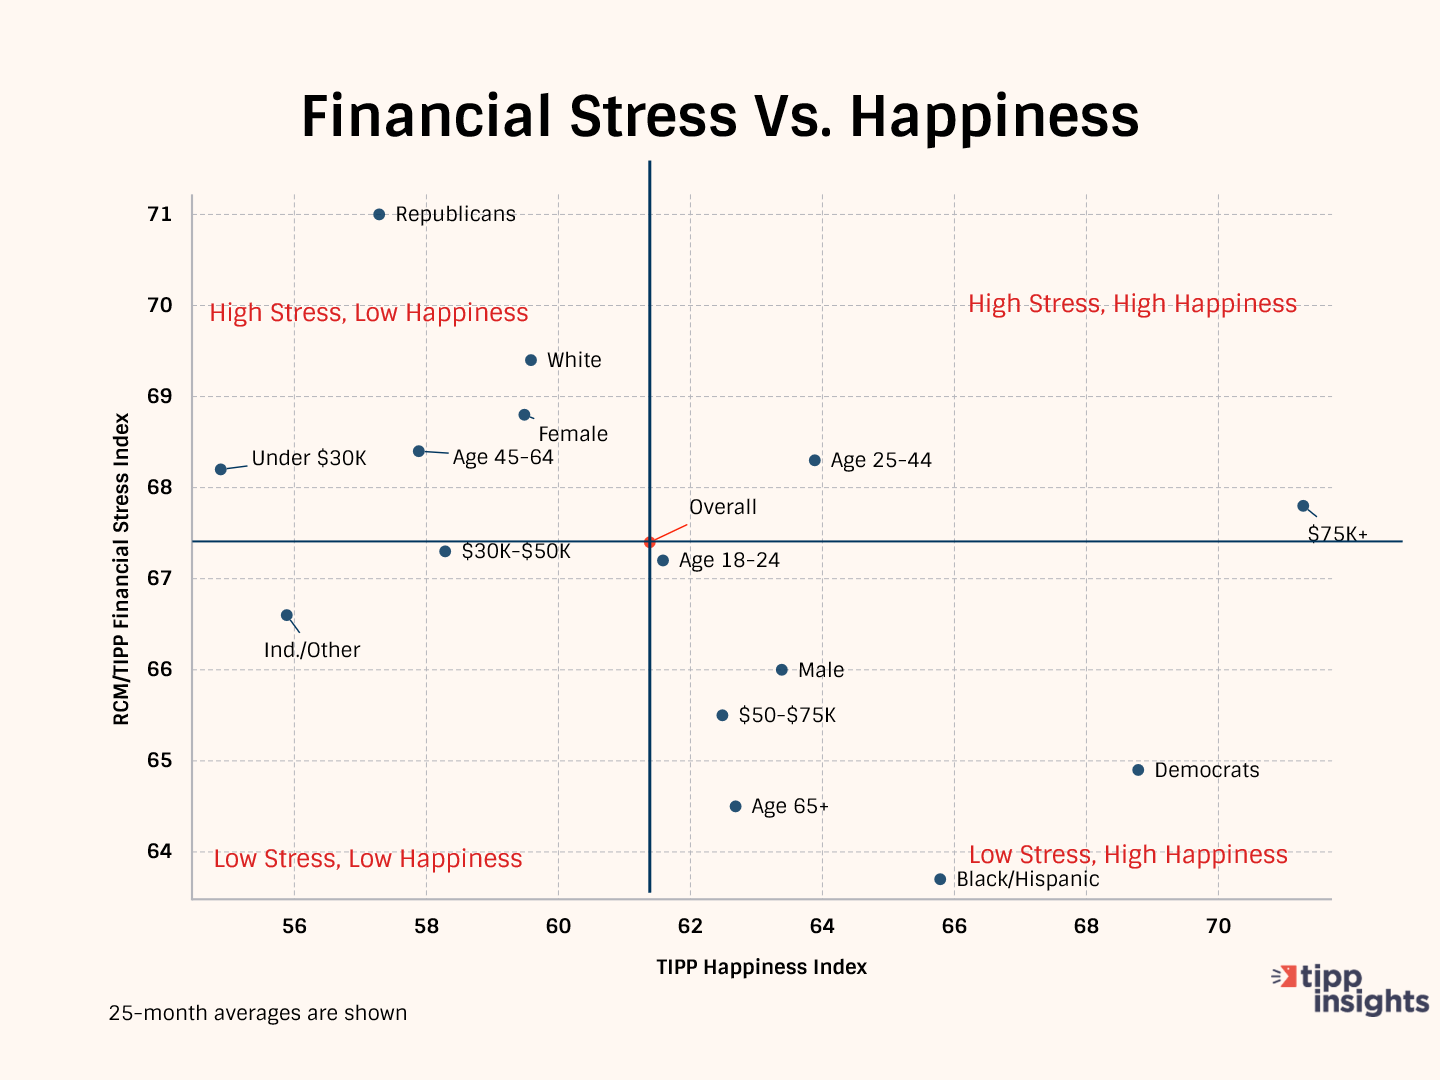
Quadrant 1: Low Stress And High Happiness
Six demographic groups—age 18-24, Democrats, male, Black/Hispanic, incomes $50K-$75K, and 65+—fall into this quadrant.
Quadrant 2: High Stress And High Happiness
Households with incomes $75K+ and the 25-44 age group are the two groups in this quadrant.
Quadrant 3: High Stress And Low Happiness
Five groups occupy quadrant 3. They are Republicans, White, Age 45-64 group, female, and under $30K income households.
Quadrant 4: Low Stress And Low Happiness
The two groups in quadrant 4 include $30K-$50K households and independents.
It’s heartening that despite the many daily life pressures, including financial stress in an inflationary environment and intense political polarization, Americans remain upbeat.
Happy Easter!


