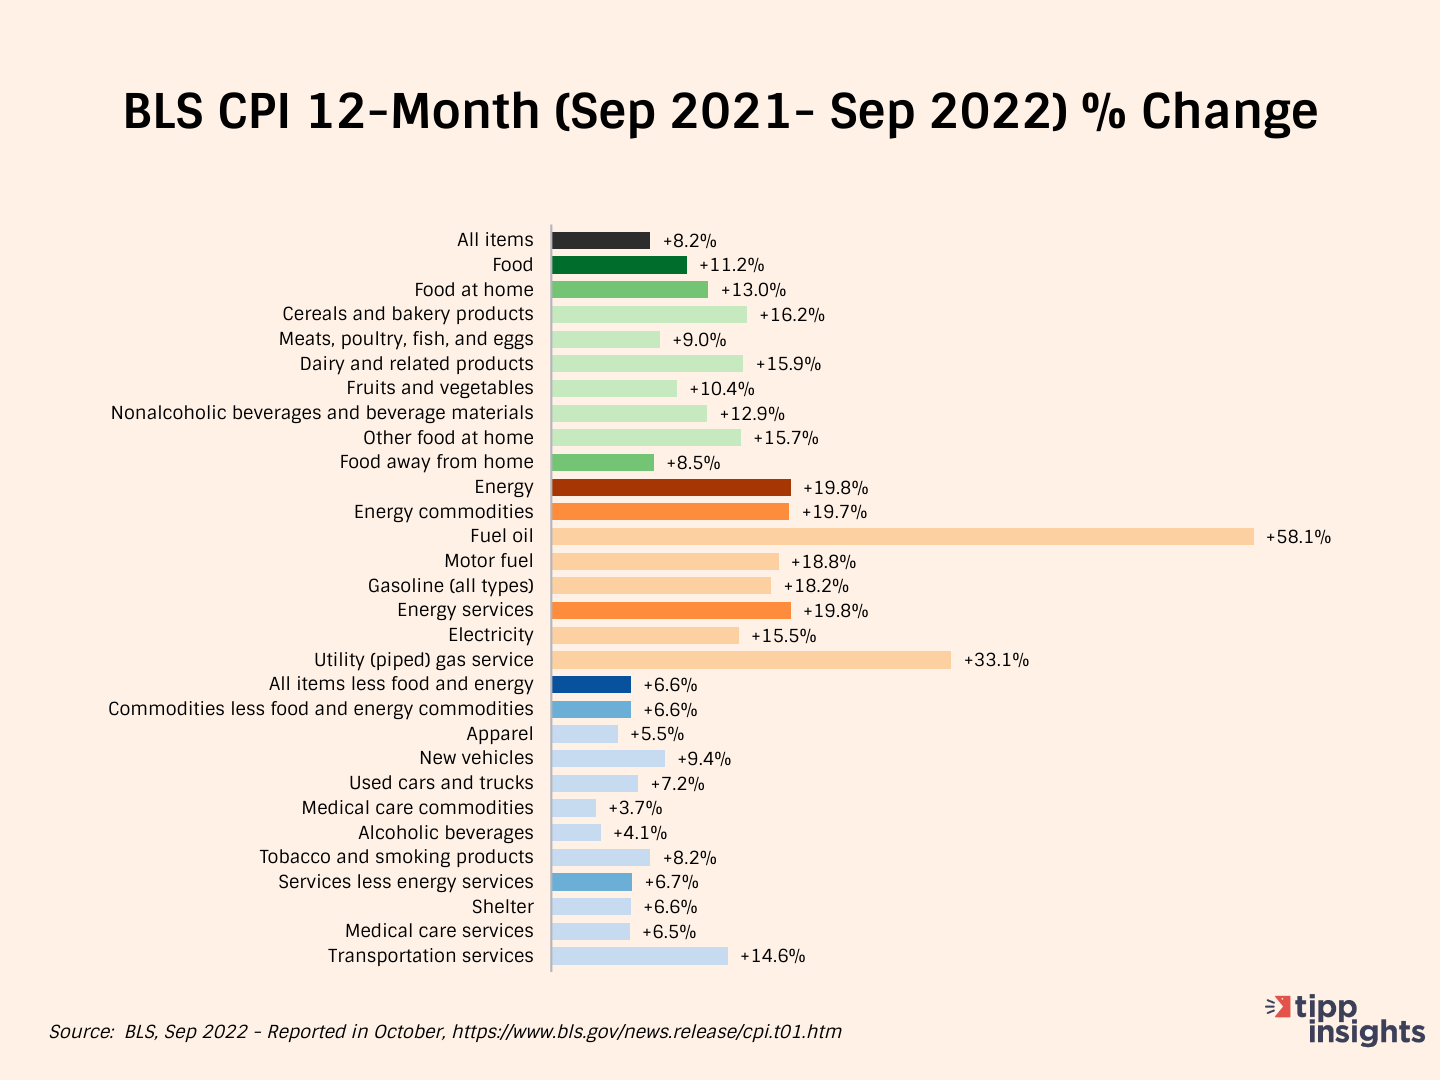
The Consumer Price Index (CPI) released by the government last Thursday showed an 8.2% year-over-year price increase from September 2021 to September 2022.
The CPI has edged down steadily from a 40-year high of 9.1% in June to 8.2% in September.
The official CPI does not tell the whole story of price increases under President Biden. Bidenflation, measured by the TIPP CPI using the same underlying data, stood at 12.8% in September. It was 12.6% in August and July and12.7% in June.
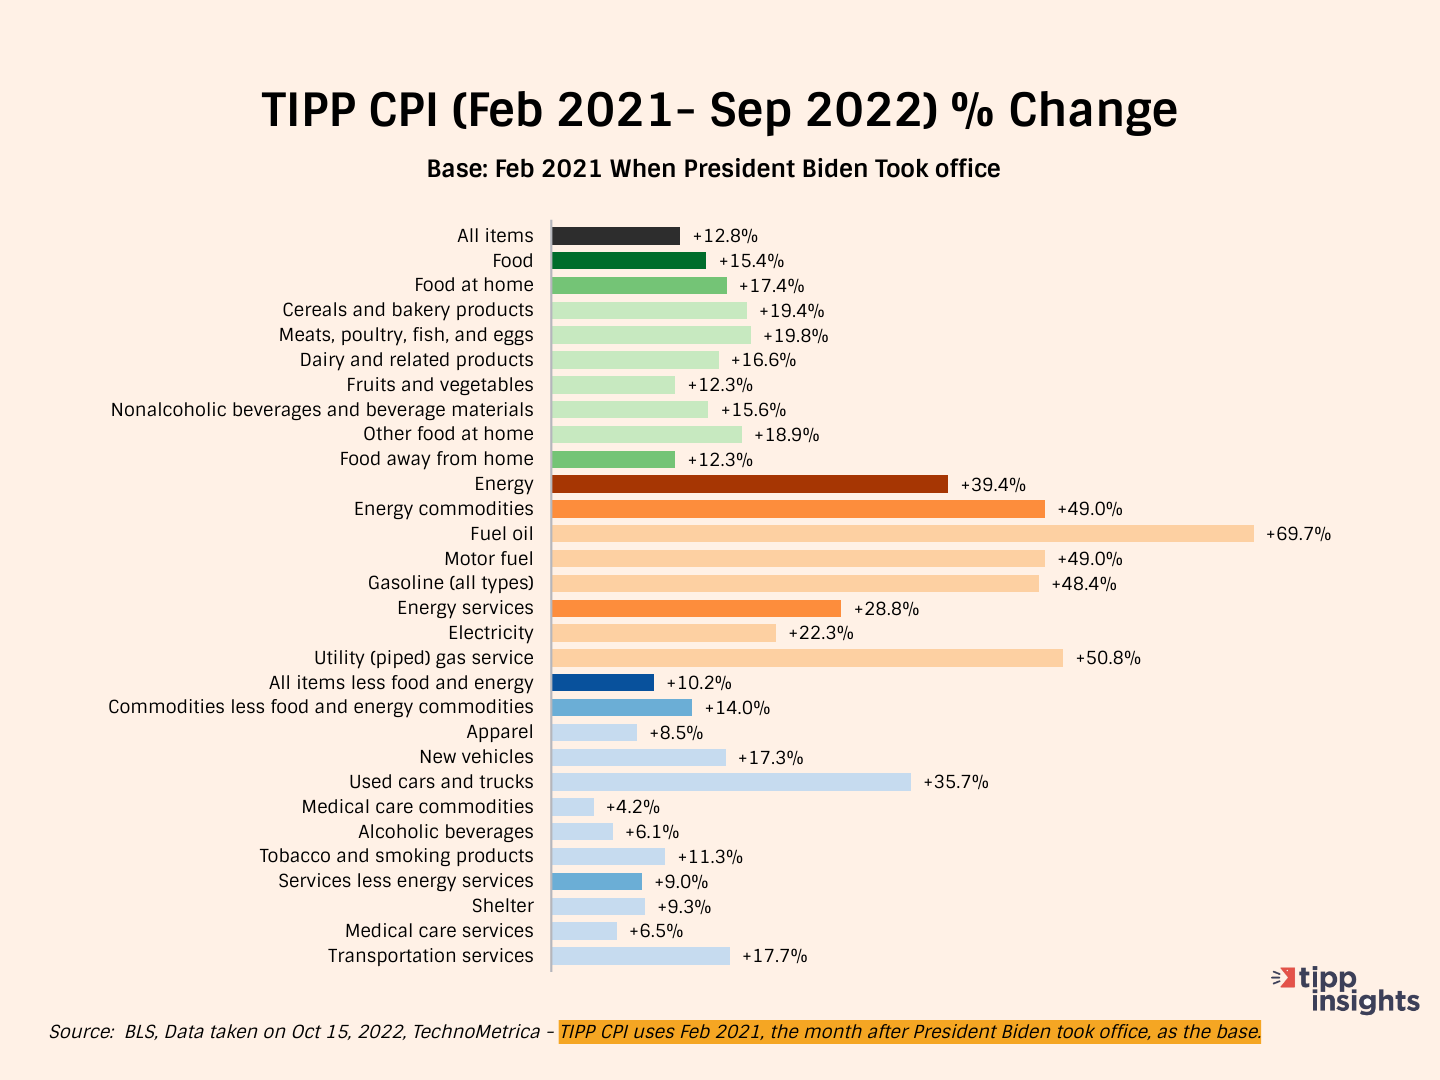
We developed the TIPP CPI, a metric that uses February 2021, the month after President Biden’s inauguration, as its base.
All TIPP CPI measures are anchored to the base month of February 2021. January 2021 was a mixed month under the watch of two presidents, two-thirds by President Trump and one-third by President Biden, so we chose to ignore it, making the TIPP CPI exclusive to the economy under President Biden’s watch. Please note that we use the relevant Bureau of Labor Statistics (BLS) underlying data but recalibrate it to arrive at the TIPP CPI.
Significant inflation had already set in by the middle of last year. In September 2021, CPI inflation was 5.4 percent. The official CPI will compare future month prices to already inflated bases in the coming months. The year-over-year calculation may moderate the statistics, but you will still feel the pinch of inflation.
TIPP CPI vs. BLS CPI
The following three charts present details about the new metric.
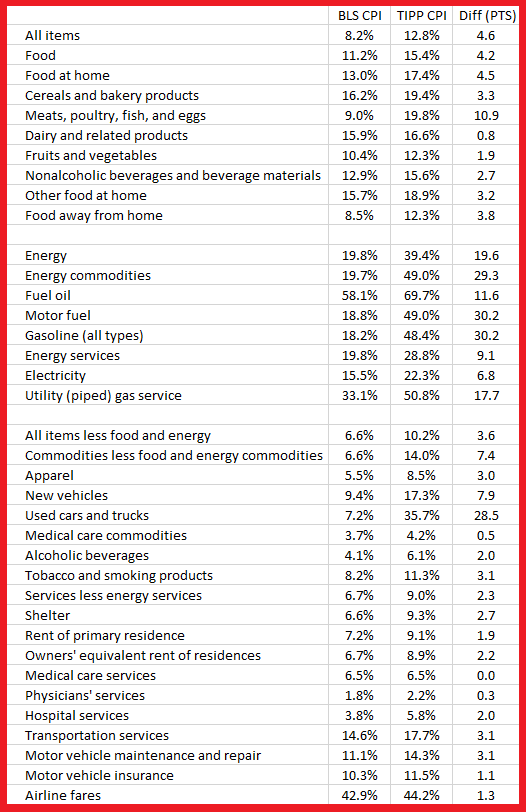
The official CPI reported by BLS is 8.2% for September 2022. Compare this to the TIPP CPI of 12.8%, a 4.6-point difference. Prices have increased by 12.8% since President Biden took office.
Food prices increased by 15.4% since President Biden took office compared to only 11.2% as per BLS CPI, a difference of 4.2 points.
Energy prices increased 39.4% per TIPP CPI compared to 19.8% according to BLS CPI, a difference of 19.6-points.
The Core CPI is the price increase for all items, excluding food and energy. The Core TIPP CPI was 10.2% compared to 6.6% BLS CPI in the year-over-year measure, a 3.6-point difference.
More specifically, gasoline prices have increased by 48.4% since President Biden took office. However, the BLS CPI for gasoline is 18.2%, a difference of 30.2 points.
Used car prices have risen by 35.7% since President Biden took office. The BLS CPI does not capture the pain and posts a relatively moderate 7.2%, a difference of 28.5 points.
Inflation for air tickets under President Biden is 44.2% compared to BLS CPI of 42.9%.
Americans’ Concerns
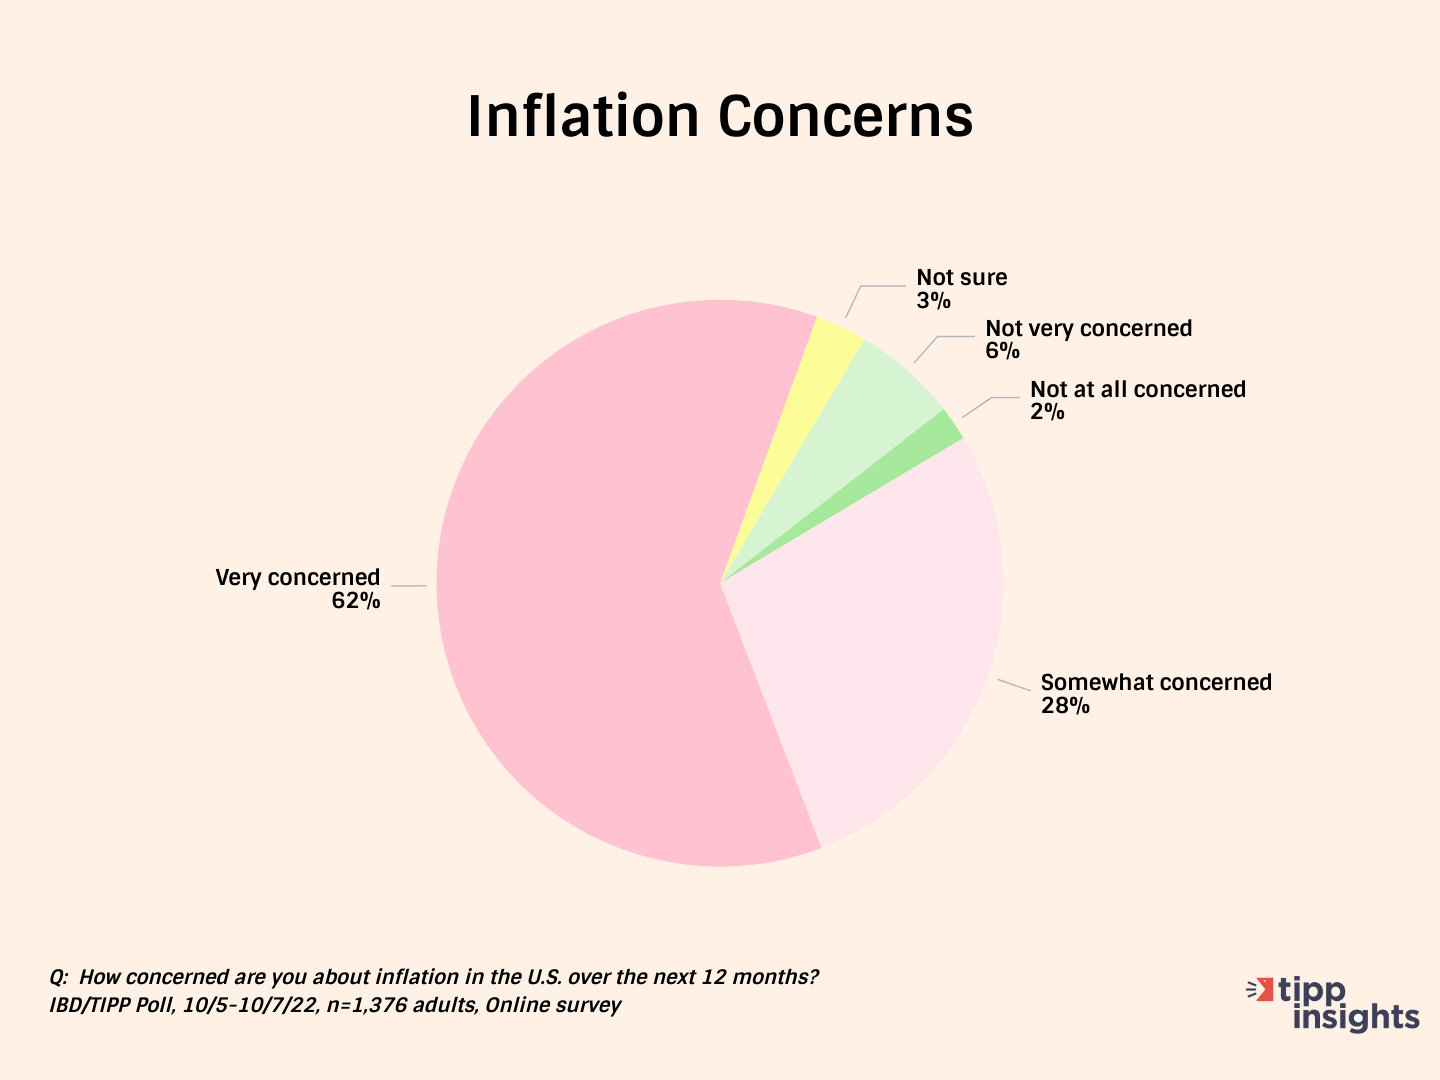
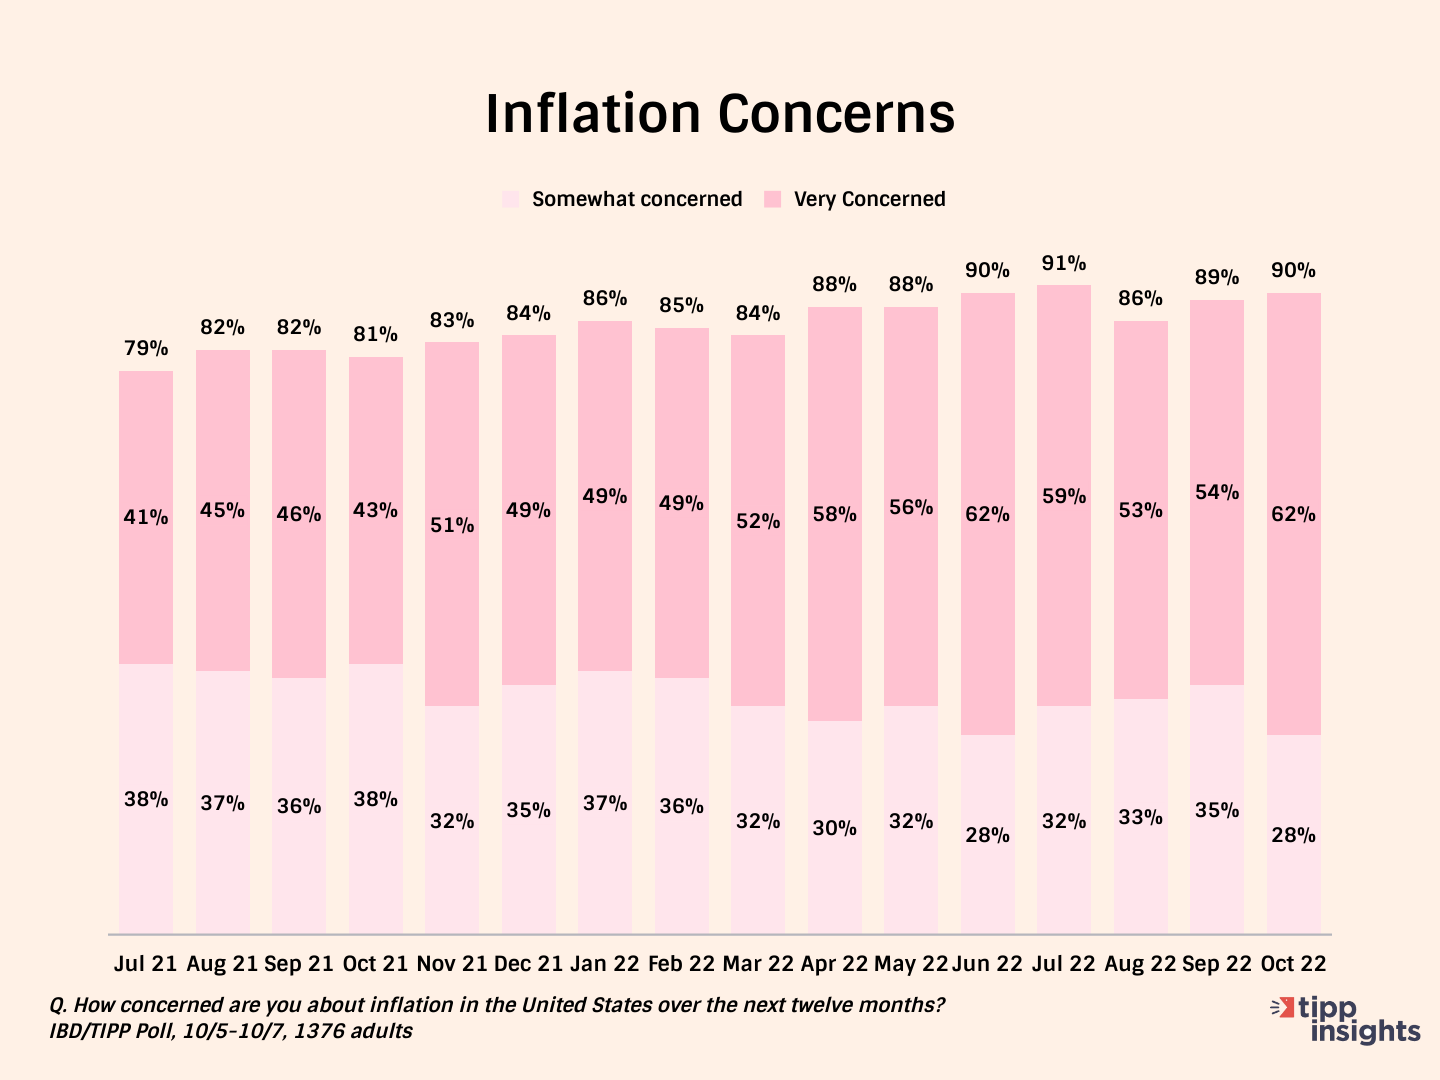
The latest Investor’s Business Daily/TIPP Poll completed last week shows that nine in ten (90%) of survey respondents are concerned about inflation. Throughout the past year, inflation concerns have stayed above 80%. The share of “very concerned” has been around 50% consistently.
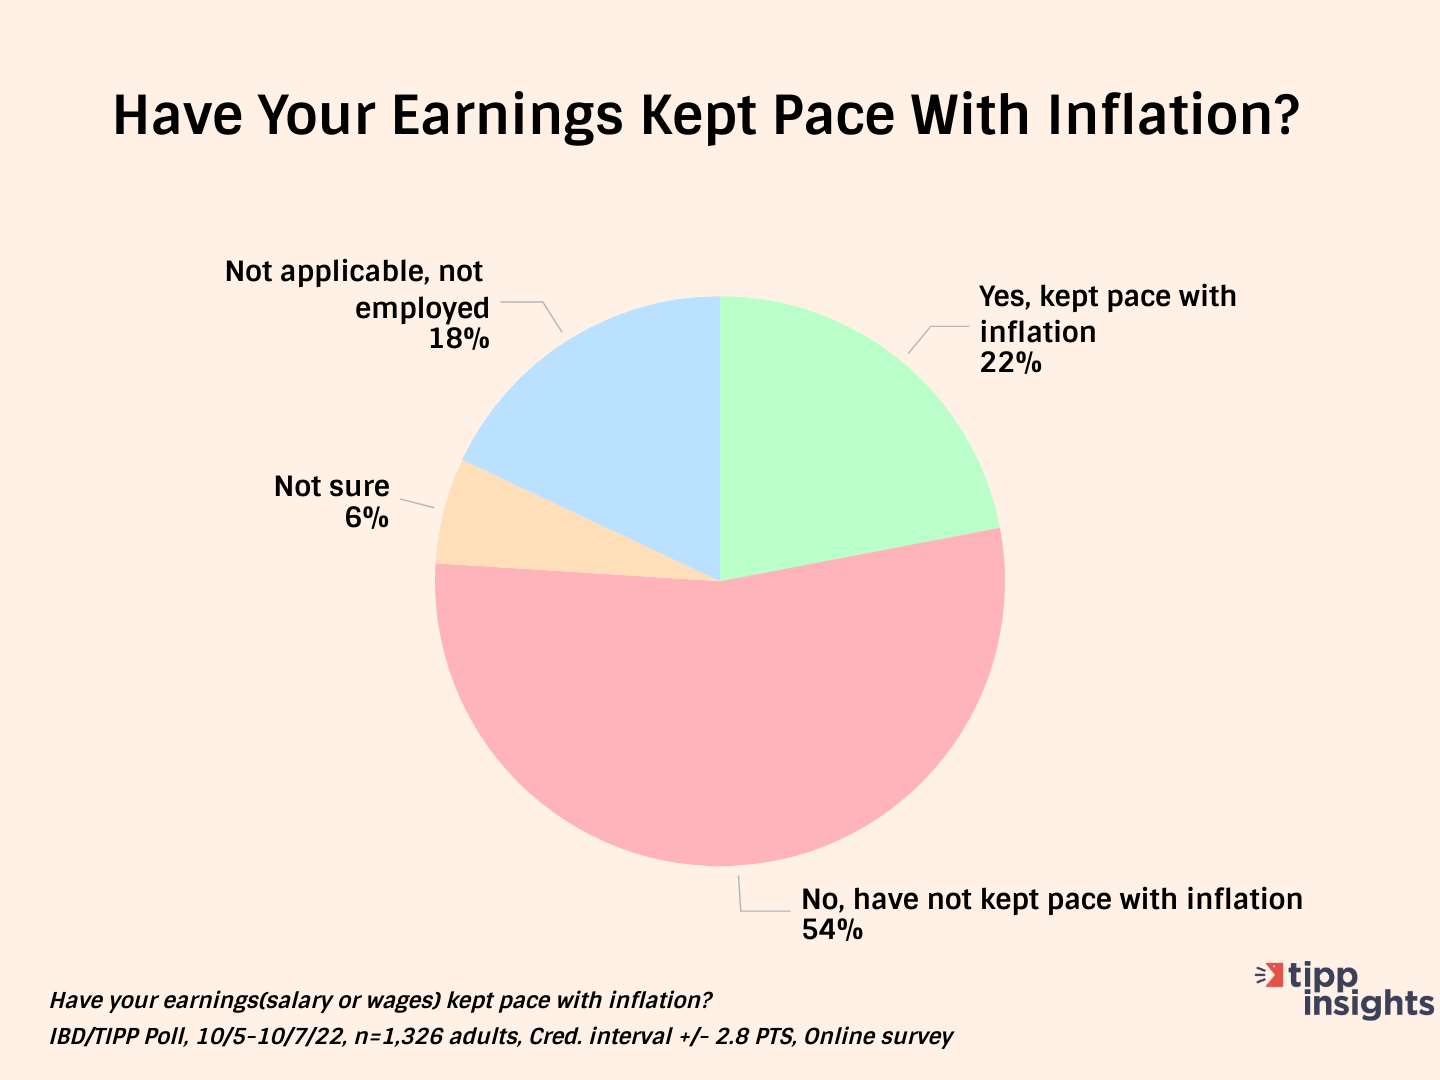
Most respondents (54%) say their wages have not kept pace with inflation. Only one in five (22%) say that it has. The share, who said wages had kept pace, has hovered in the 17% to 22% range since January 2022.
As a result of inflation, Americans are cutting back on household spending. Over three-quarters (77%) of respondents mentioned they had reduced household spending.
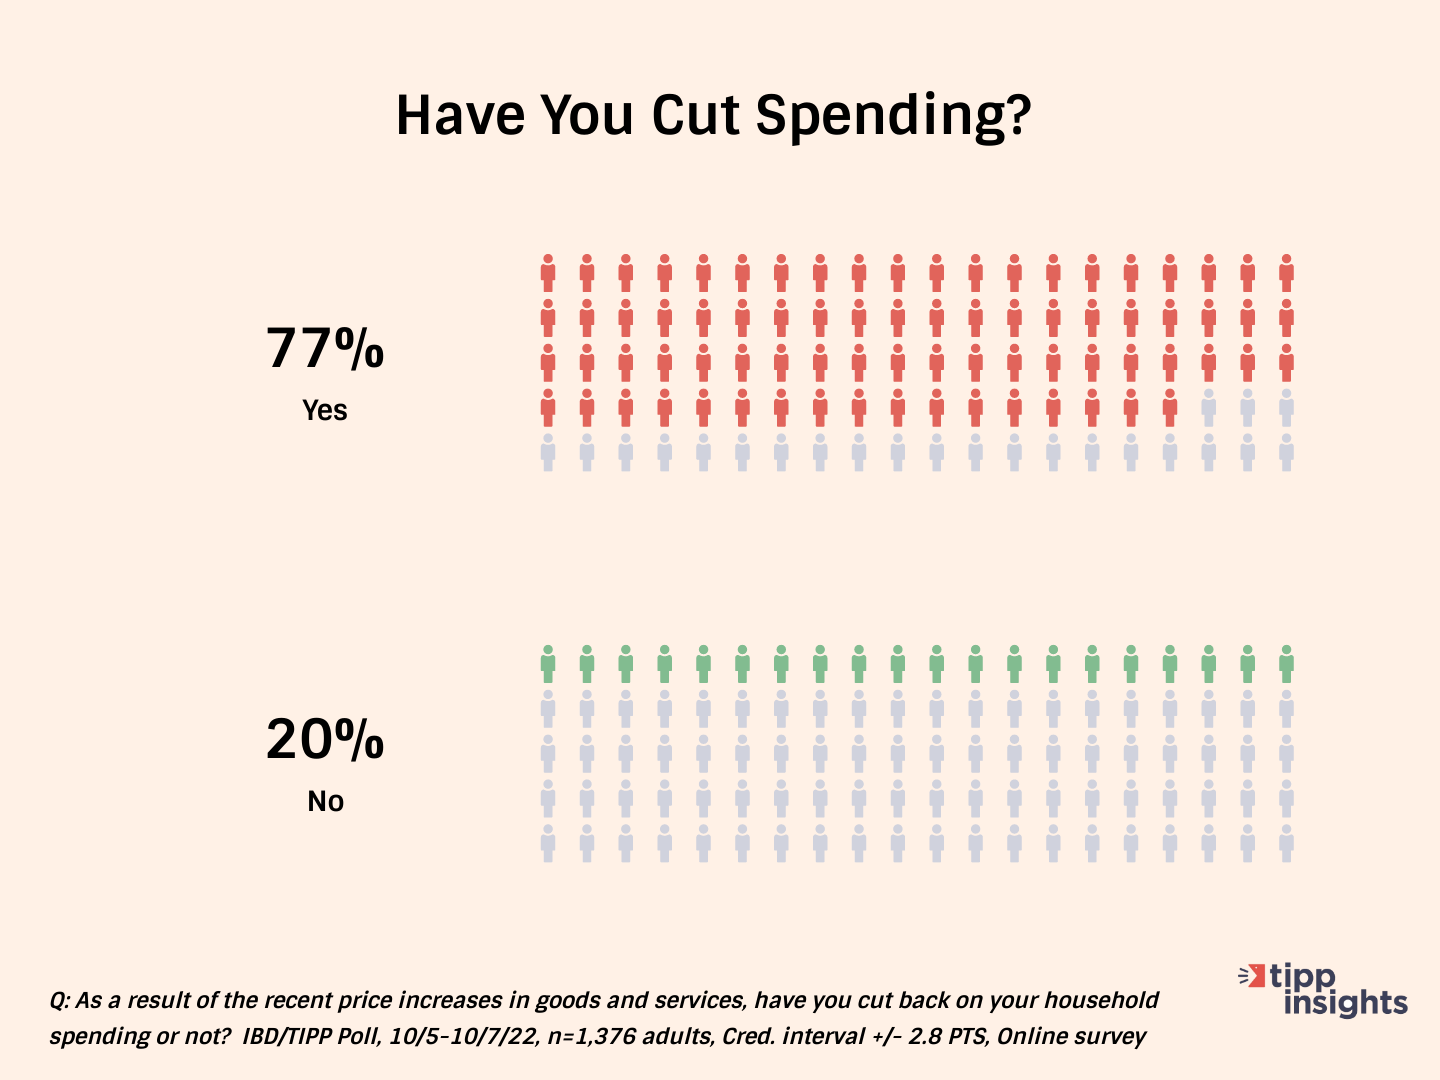
Americans of all ages and income levels are cutting spending.
- 69% in the 18 to 24 age group
- 75% for the 25 to 44 age group
- 82% for the 45 to 64 age group
- 75% for age 65+
- 77% for households with incomes under $30K
- 79% for households in the $30K-$50K range
- 77% for the $50K-$75K range
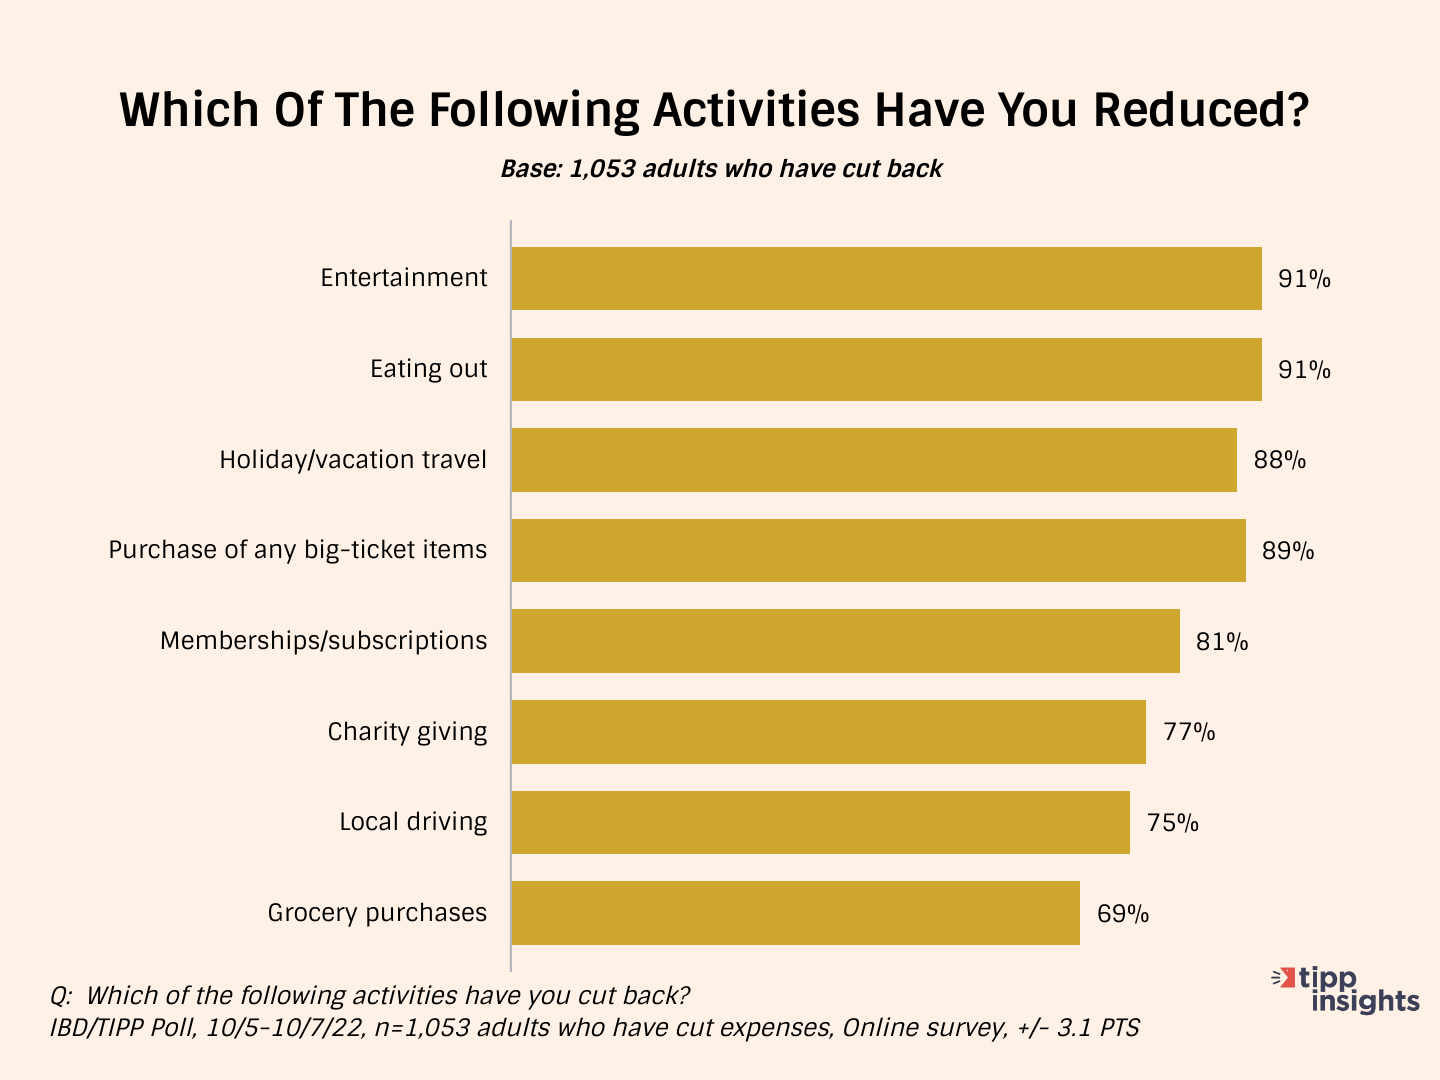
Among those cutting back, most are spending less on entertainment (91%), eating out (91%), holiday/vacation travel (88%), purchases of big-ticket items (89%), and memberships/subscriptions (81%).
Many (77%) are cutting back on even good causes such as charity giving. The high gasoline prices forced 75% to cut back on local driving. Over two-thirds (69%) of households are spending less on groceries.
Inflation Direction
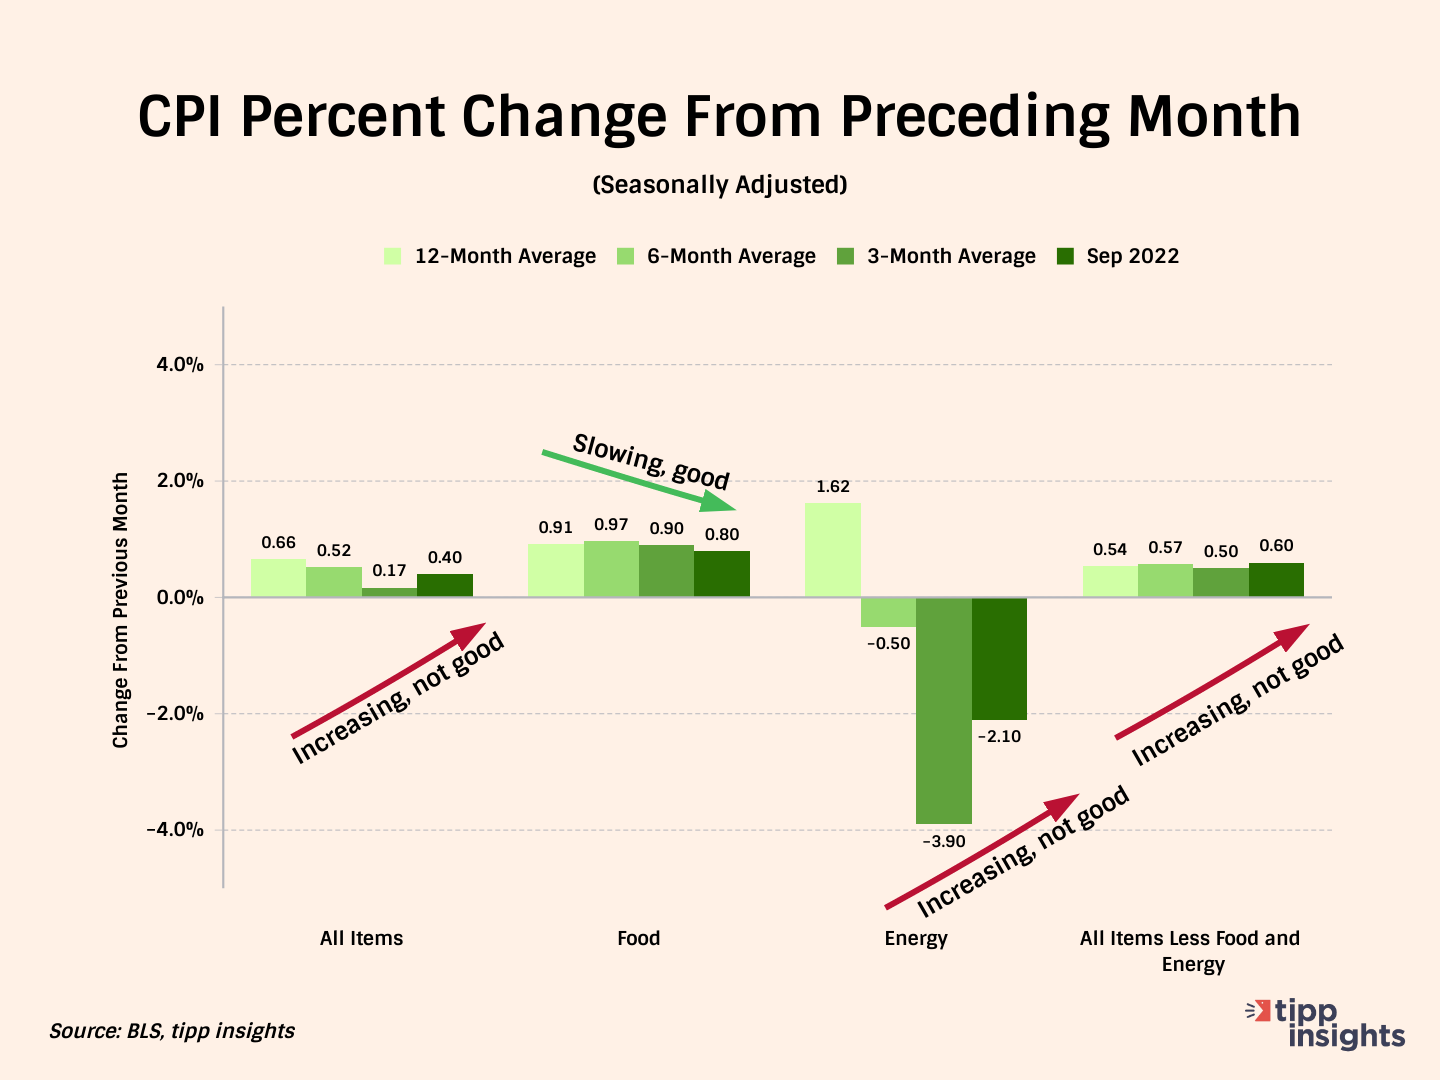
The chart below compares the 12-month average of monthly changes against the 6-month and the 3-month averages. We also show the reading for September 2022.
The 12-month average considers12 data points and presents a long-term reference, while the six-month and three-month averages consider recent data points.
Note that inflation is slowing for “Food.” However, for all items, excluding food, the CPI is increasing. The increase in September 2022 exceeded the three moving averages indicating a pickup.
The U.S. economy is in stagnation – high inflation combined with an economic slowdown. In the coming days, we’ll cover the topics of recession, economic confidence, and financial stress.
To access the TIPP CPI readings each month, you can visit tippinsights.com. We’ll publish the TIPP CPI and our analysis in the days following the Bureau of Labor Statistics (BLS) report. The upcoming releases of TIPP CPI are on November 11 and December 14. We’ll also post a spreadsheet in our store for free download.
Hey, want to dig deeper? Download data from our store for free!


