The Consumer Price Index (CPI) released by the government on Tuesday showed a 4.0% year-over-year increase in prices from May 2022 to May 2023, declining from a rate of 4.9% in April, 5.0% in March, and 6.0% in February. The CPI has declined steadily from a 40-year high of 9.1% in June 2022 to 4.0% in May. However, the CPI rose 0.1% last month after adjusting for seasonality and 0.3% on an unadjusted basis.
The media headlines read:
Inflation cools again as CPI data shows grocery prices fell, food cost eased
Cooling down: US Inflation slows
CPI report: US inflation is coming back down to Earth
But few media outlets provided context, partly because doing so would shed the Biden administration in a terrible light and does not fit the narrative. But numbers do not lie, so, we are happy to oblige and fill in the gaps.
Our conclusion: The Biden economy continues to be the worst-performing going back to President Carter. Since February 2021, the first full month of President Biden's term, the prices of various commodities, including food, gasoline, used cars, and air tickets, have consistently increased. Although the rate of increase has slowed, prices are still rising monthly.
As we have noted numerous times, President Biden’s reckless spending has resulted in inflation levels not seen for 40 years.
Mark our words. The U.S. economy will experience an extended period of stagflation characterized by a recession and inflation.
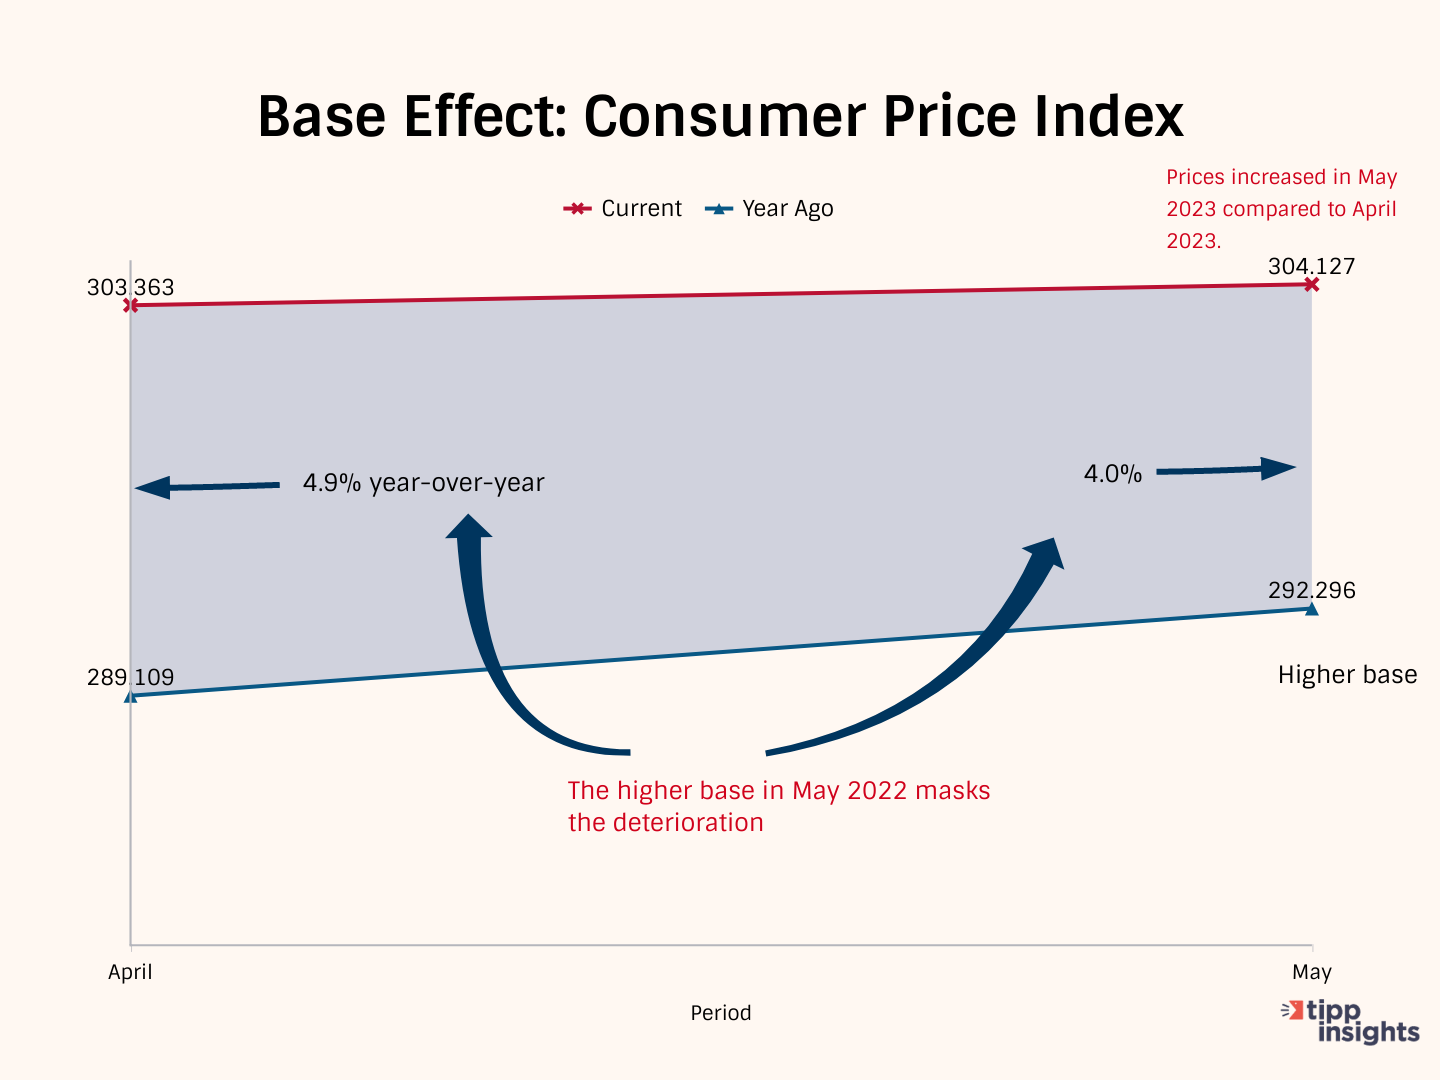
The CPI inflation rate measures how much more expensive things are getting over time. The government calculates the increase in the CPI rate over 12 months, so the base for May 2023 is May 2022, and for April 2023 is April 2022.
In May 2023, the CPI index was 304.127, 4.0% higher than its base of 292.296 for May 2022. And in April 2023, the CPI index was 303.363, 4.9% higher than its base of 289.109 for April 2022.
Between April 2022 and May 2022, the base increased sharply by 3.187 points or 1.1%. Even though the CPI index increased by 0.3% between April and May 2023, the headline CPI rate dropped from 4.9% to 4.0% because of the "base effect."
In other words, the rate seemed lower than it actually was because the base was higher in May 2022. Things were getting more expensive but more expensive at a slower rate than the previous year. Only in Washington is this good news.
TIPP CPI
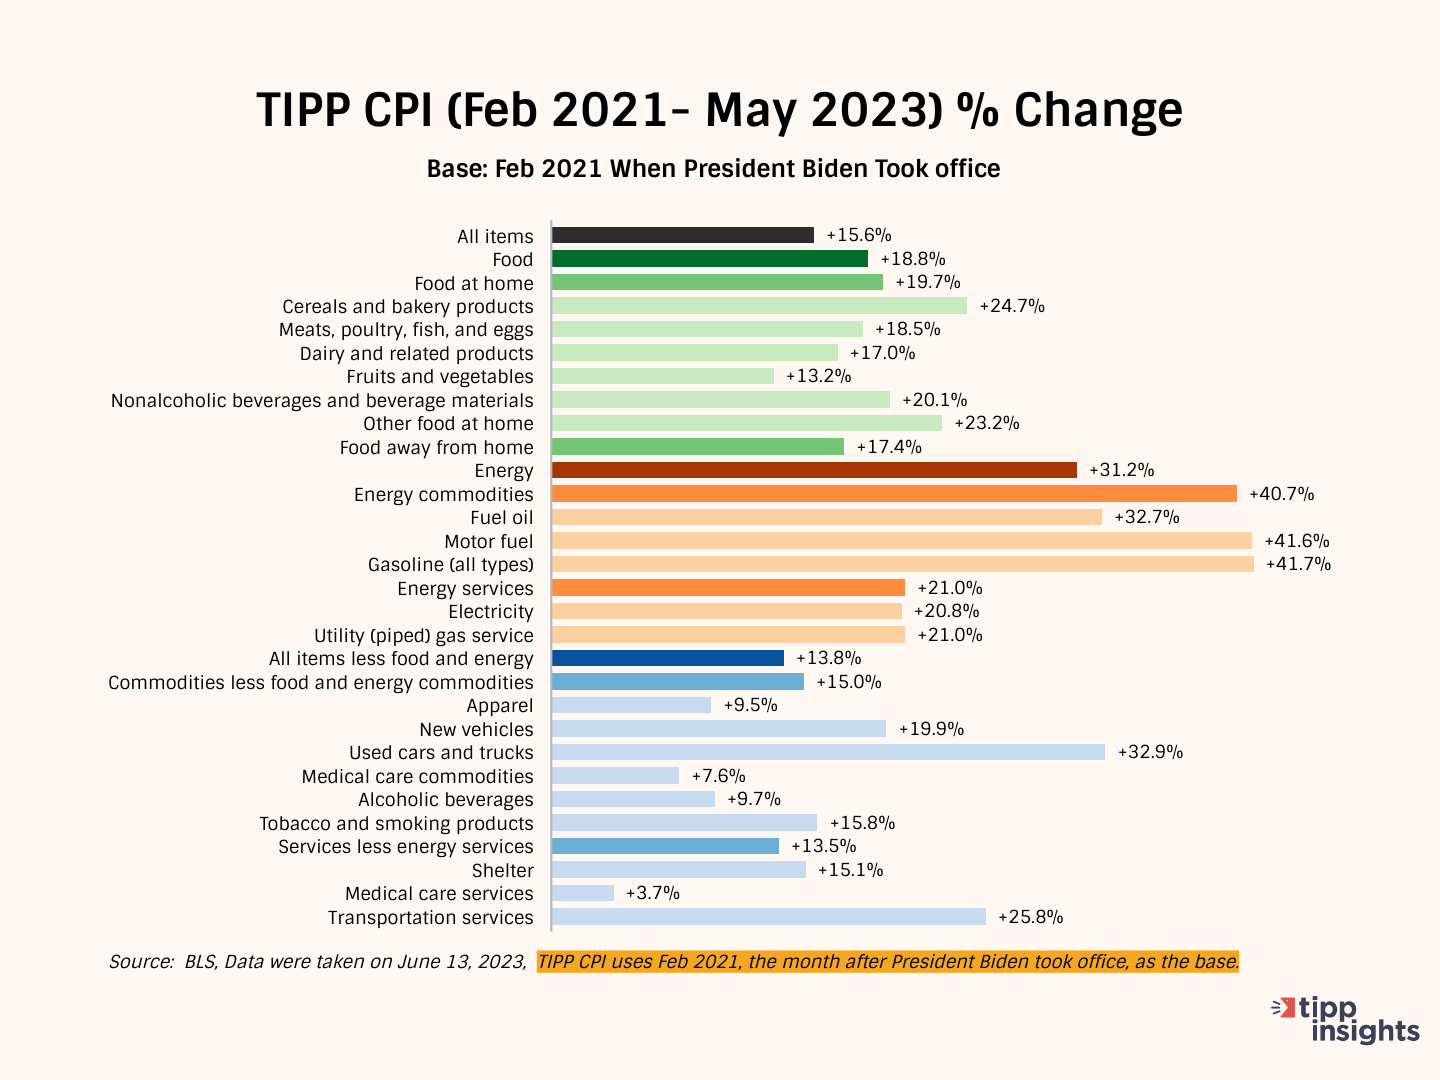
We developed the TIPP CPI, a metric that uses February 2021, the month after President Biden's inauguration, as its base. We measure the rate of change in the economy from this base. All TIPP CPI measures are anchored to the base month of February 2021, making it exclusive to the economy under President Biden's watch.
We use the relevant data from the Bureau of Labor Statistics (BLS) to calculate the TIPP CPI, but we adjust the period to Biden’s tenure. CPIs are like index numbers that show how prices affect people's lives, similar to how the Dow Jones Industrial Average reflects the stock market.
When discussing the TIPP CPI and the BLS CPI, we convert the index numbers into percentage changes to better understand and compare them.
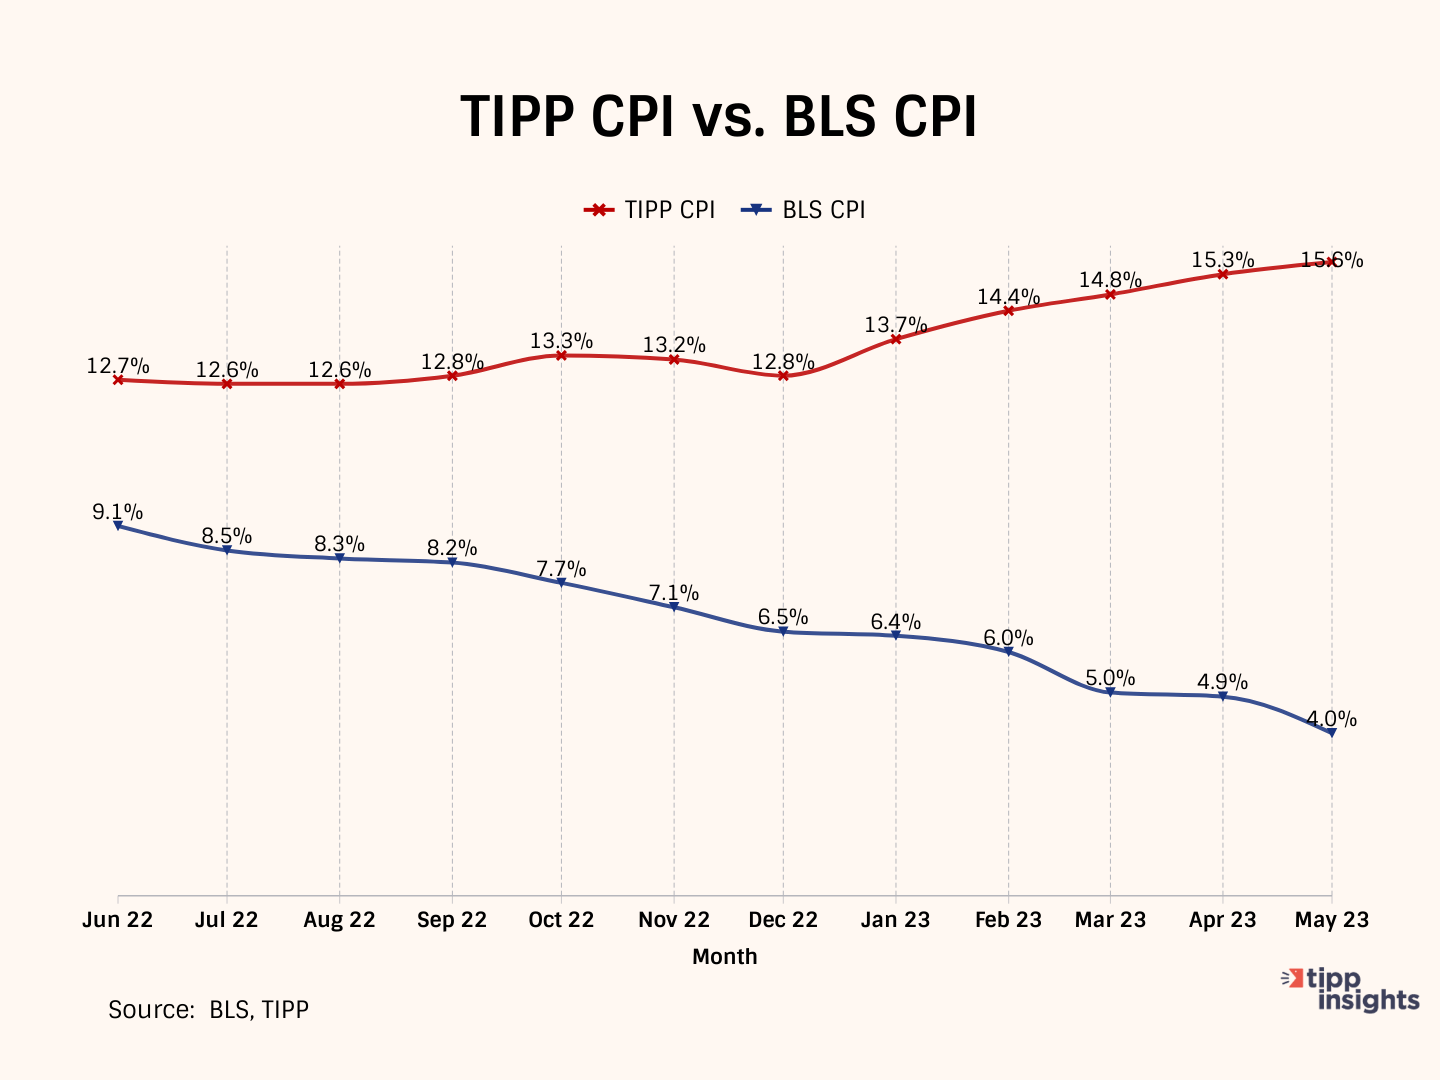
Bidenflation, as measured by the TIPP CPI using the same underlying data, reached 15.6% in May. It was 15.3% in April, 14.8% in March, 14.4% in February, and 13.7% in January.
By the middle of 2022, significant inflation had already taken hold. In May 2022, CPI inflation stood at 8.6 percent. While the official BLS CPI year-over-year increases will compare prices to already inflated bases in the coming months, these statistics might mask the full impact. Americans continue to feel the effects of inflation and face challenges with their expenses.
TIPP CPI vs. BLS CPI
The following four charts present details about the new metric.
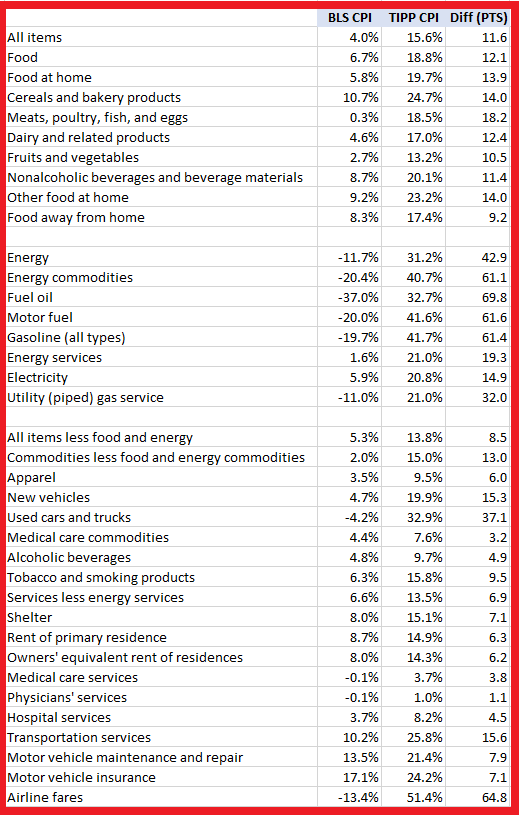
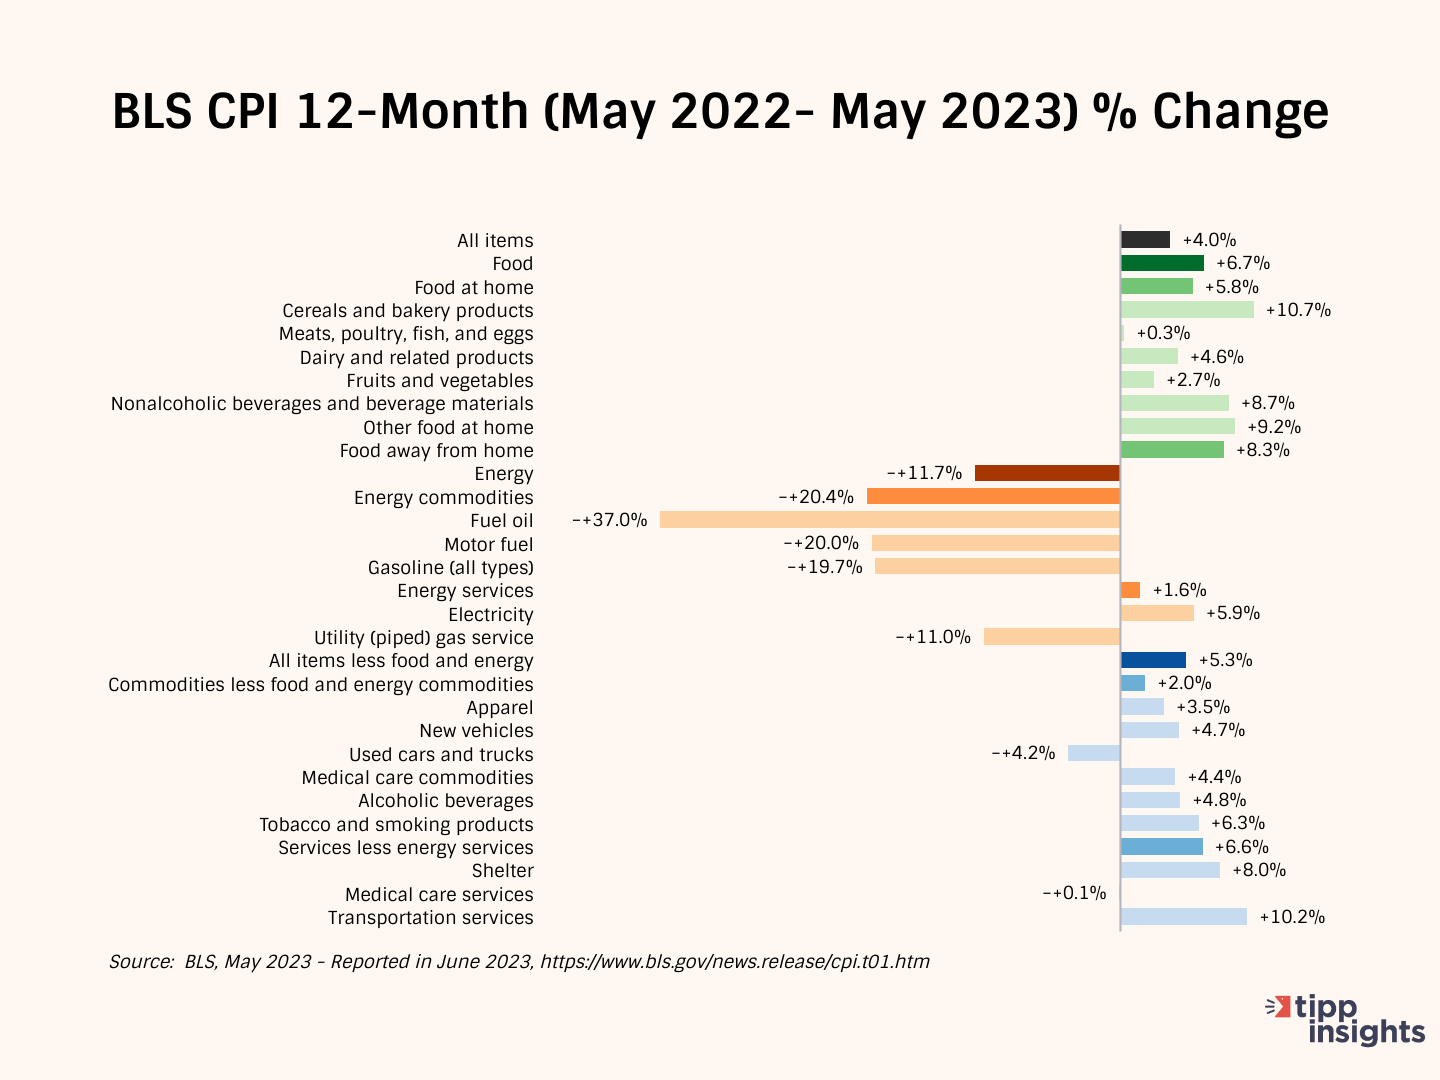
The annual CPI increase reported by BLS is 4.0% for May 2023. Compare this to the TIPP CPI of 15.6%, a 11.6-point difference. Prices have increased by 15.6% since President Biden took office. On an annualized basis, TIPP CPI is 6.8%. When compounded monthly, the rate is 0.52%, and when compounded annually, it is approximately 7.5%.
Food prices increased by 18.8% under President Biden's watch compared to only 6.7% as per BLS CPI, a difference of 12.1 points.
TIPP CPI data show that energy prices increased by 31.2%. But, according to the BLS CPI, energy prices declined by 11.2%. The difference between the two is a whopping 42.9 points.
The Core CPI is the price increase for all items, excluding food and energy. The Core TIPP CPI was 13.8% compared to 5.3% BLS CPI in the year-over-year measure, an 8.5-point difference.
Further, gasoline prices have increased by 41.7% since President Biden took office, whereas the BLS CPI shows that gasoline price has improved by 19.7%, a difference of 61.4 points.
Used car prices have risen by 32.9% during President Biden's term. The BLS CPI shows that the prices have dropped by 4.2%, a difference of 37.1 points.
Inflation for air tickets under President Biden is 51.4% compared to the BLS CPI finding of improvement of 13.4%, a difference of 64.8 points.
Americans' Concerns
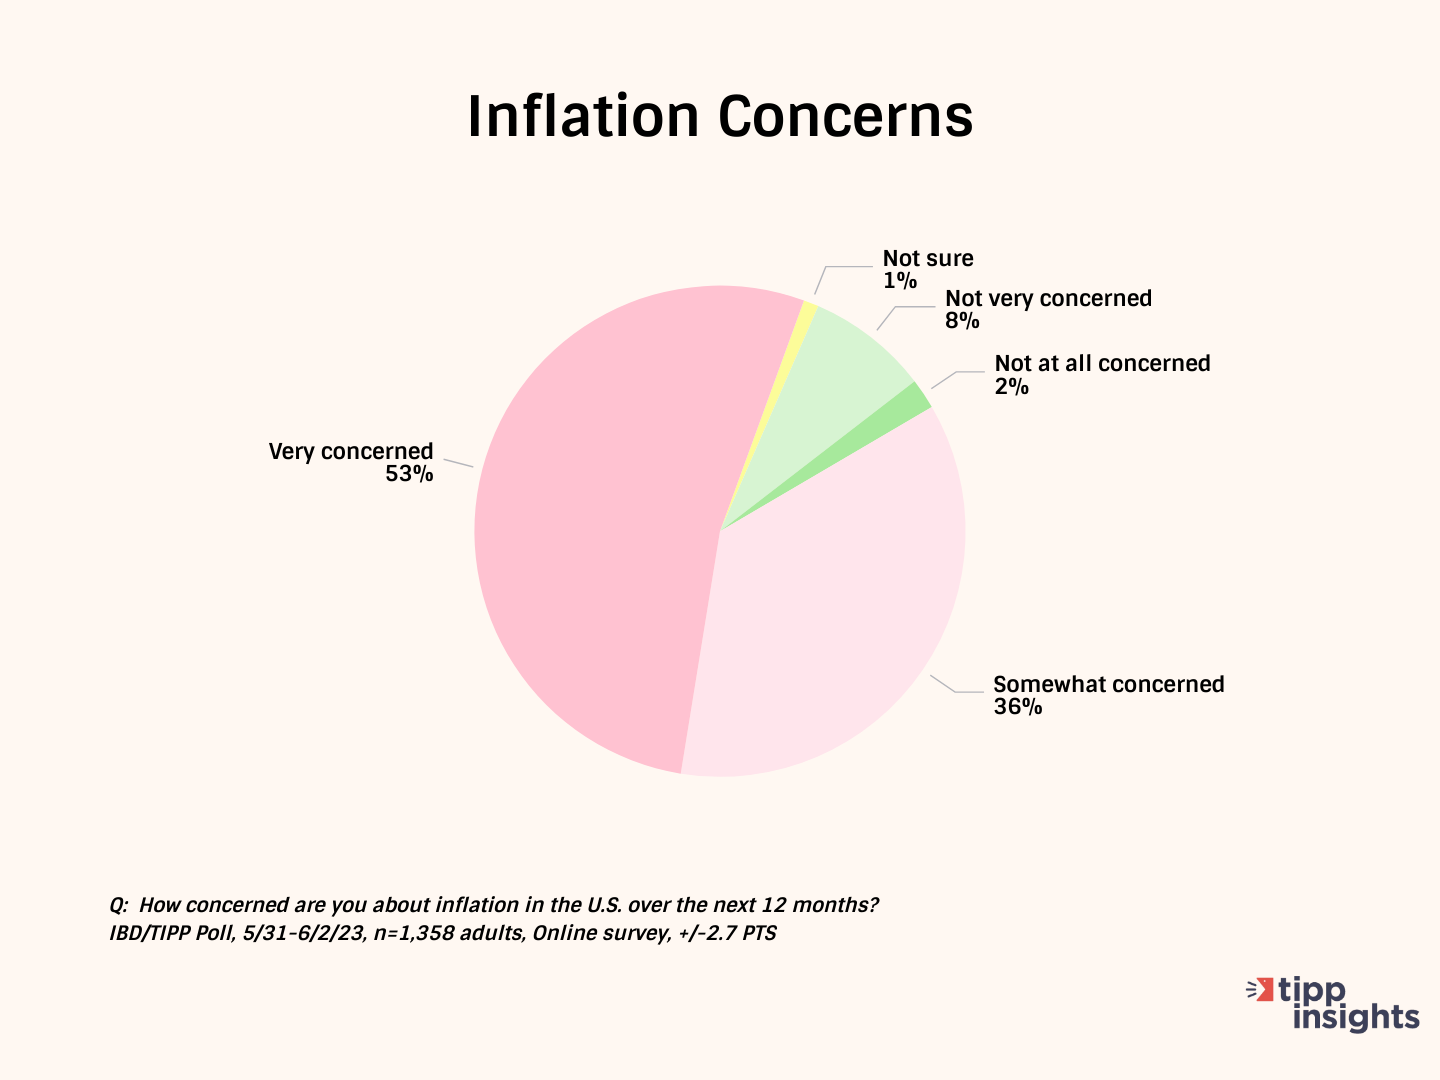
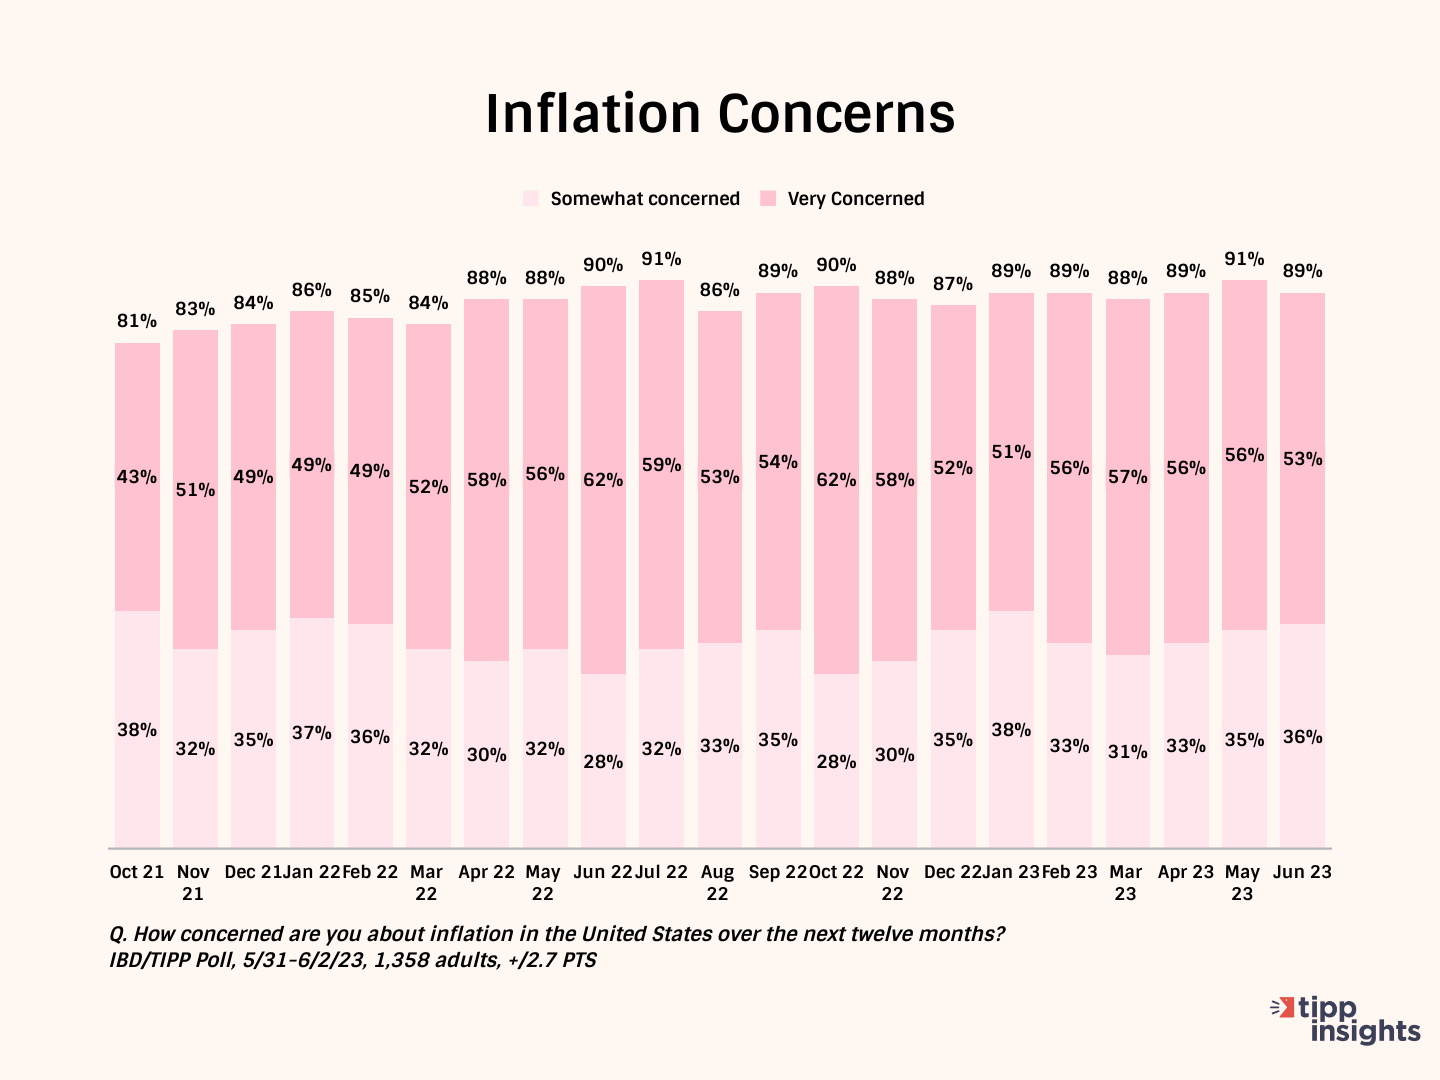
The latest Investor's Business Daily/TIPP Poll, completed earlier this month, shows nine in ten (89% in June; 91% in May) survey respondents are concerned about inflation. Throughout the past year, inflation concerns have stayed above 85%. The share of "very concerned" has been over 50% for twelve consecutive months.
Over half (52%, 52% in May) say their wages have not kept up with inflation. Only 22% (23% in May) say their income has kept pace with inflation.
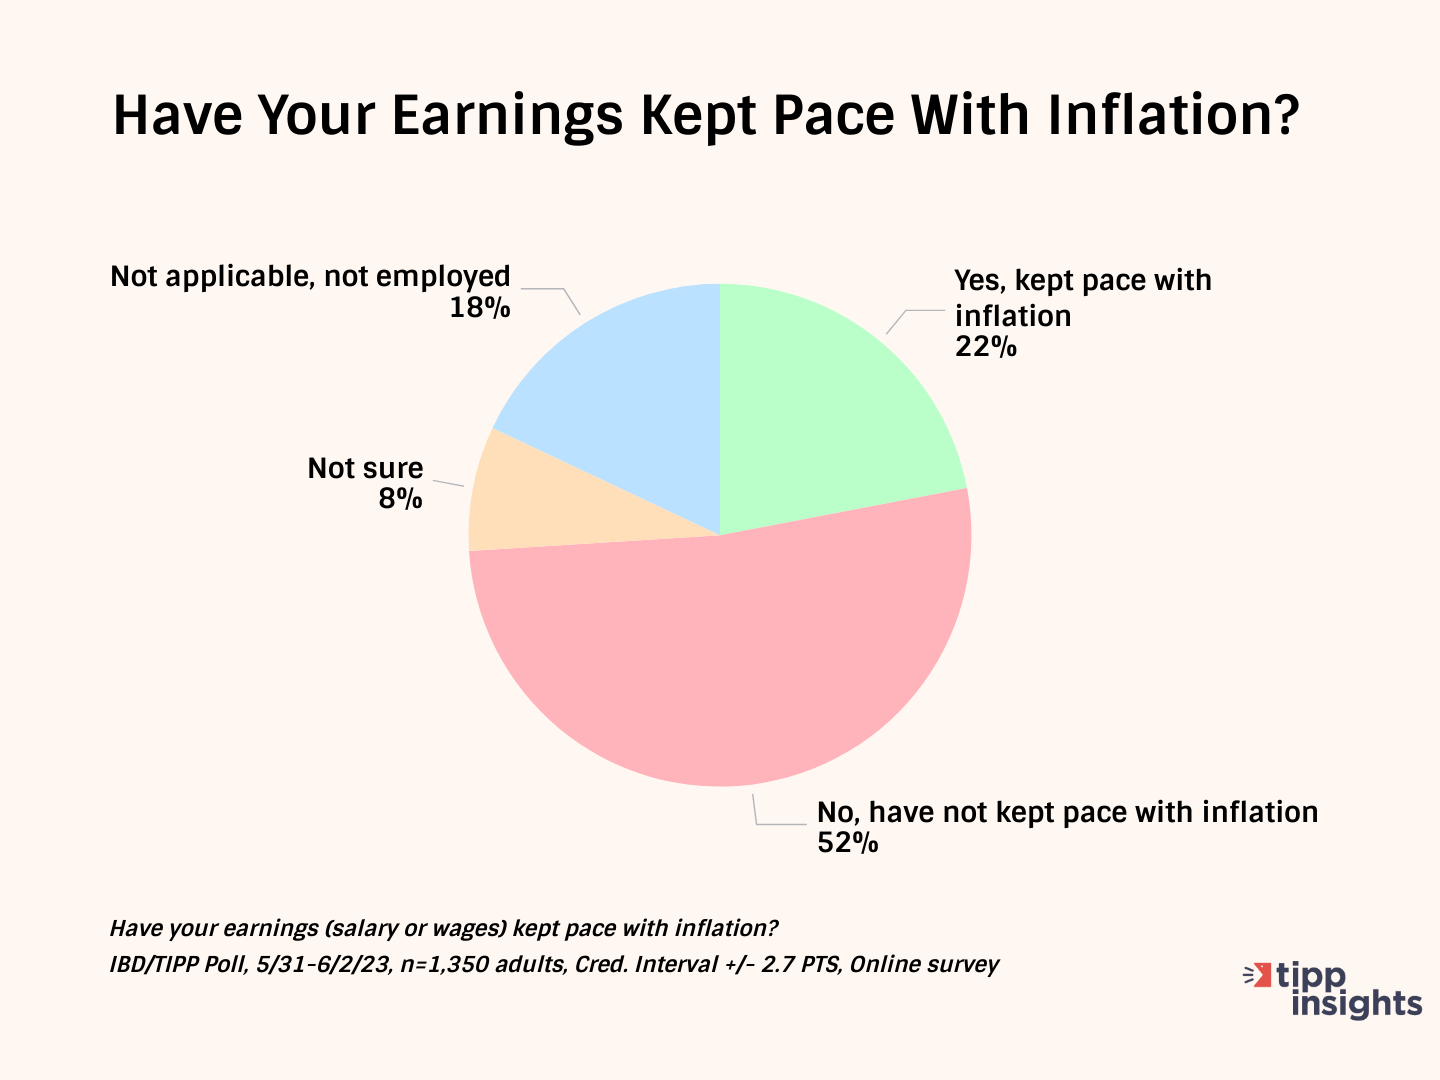
This statistic hovered in the low twenties for most of the last year. The positive change between February and April has petered out since May.
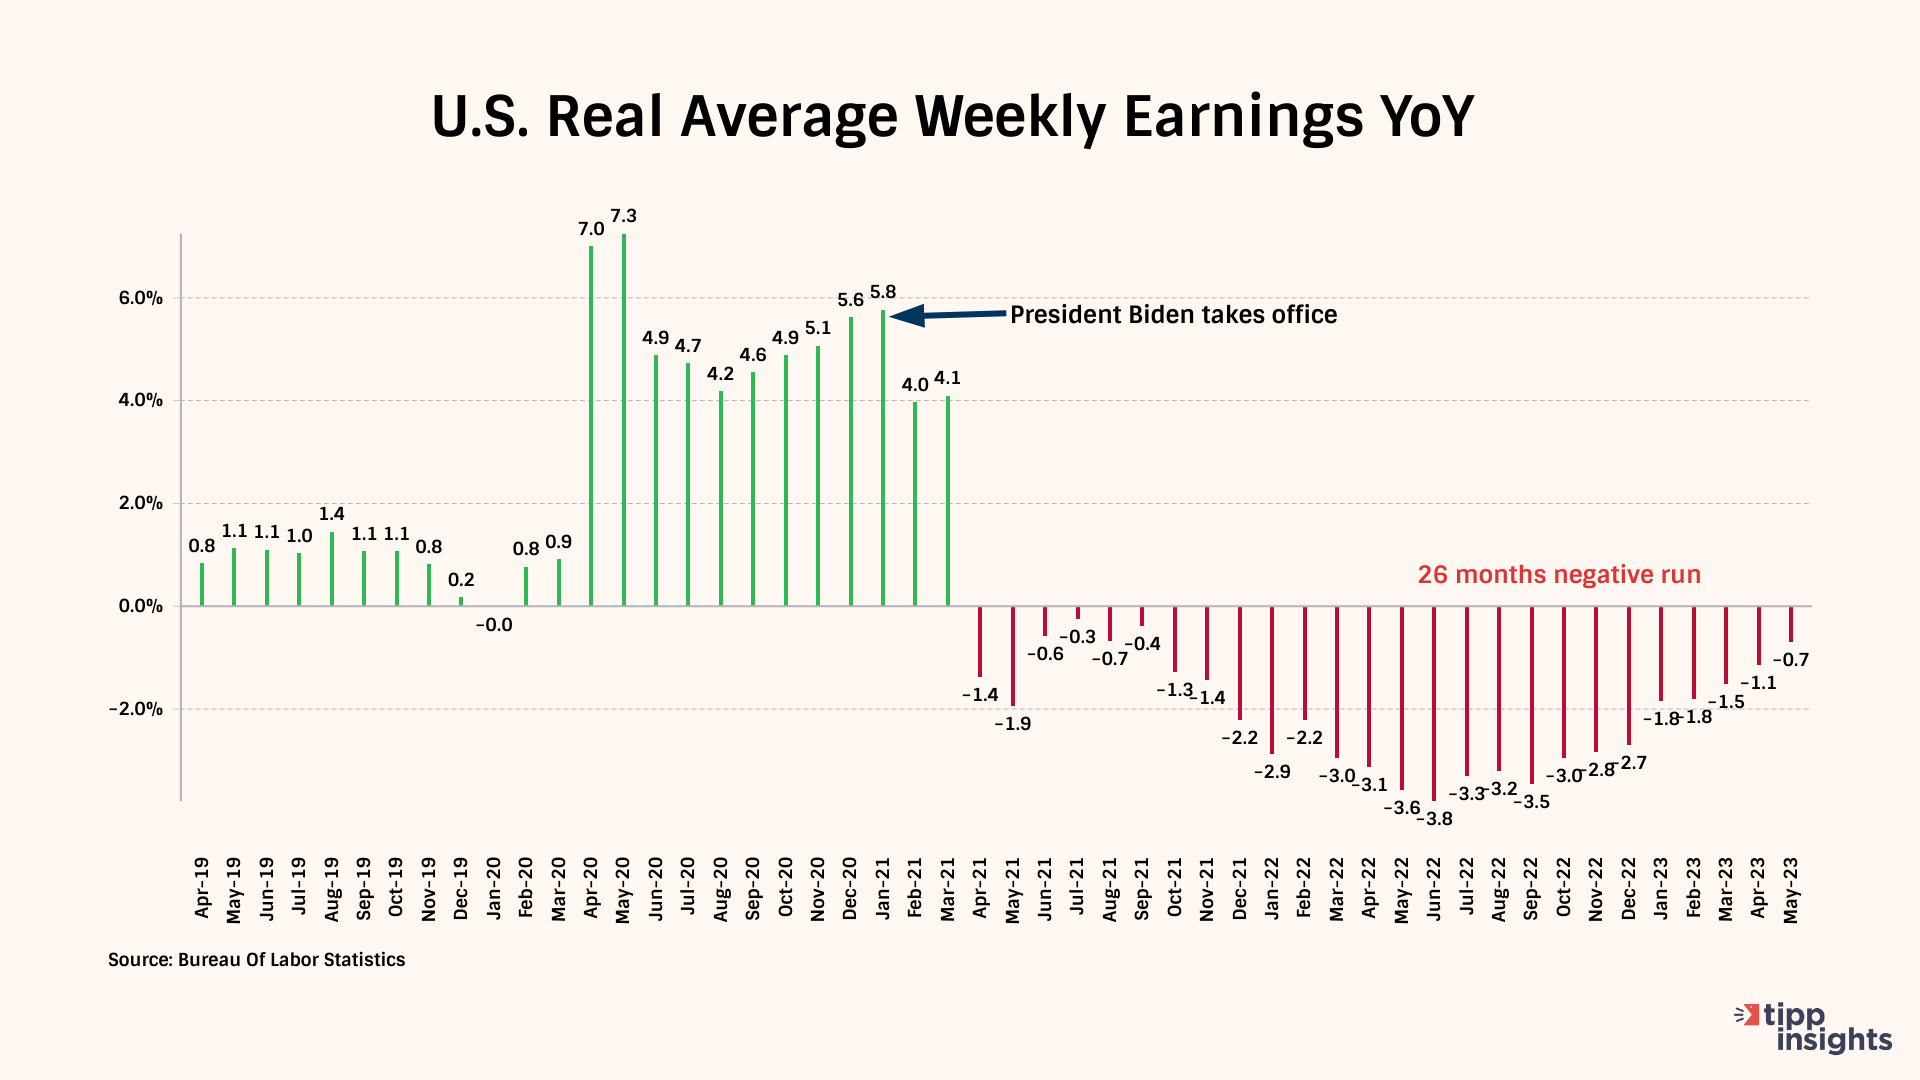
Real wages consider inflation, measuring wages based on their purchasing power. It is different from nominal wages, which are wages without considering inflation.
Real weekly wages have dropped 26 of the 28 months (93%) during the Biden presidency. The decline in real wages during the Biden presidency is the longest in history, surpassing the duration of the 2008-09 financial crisis.
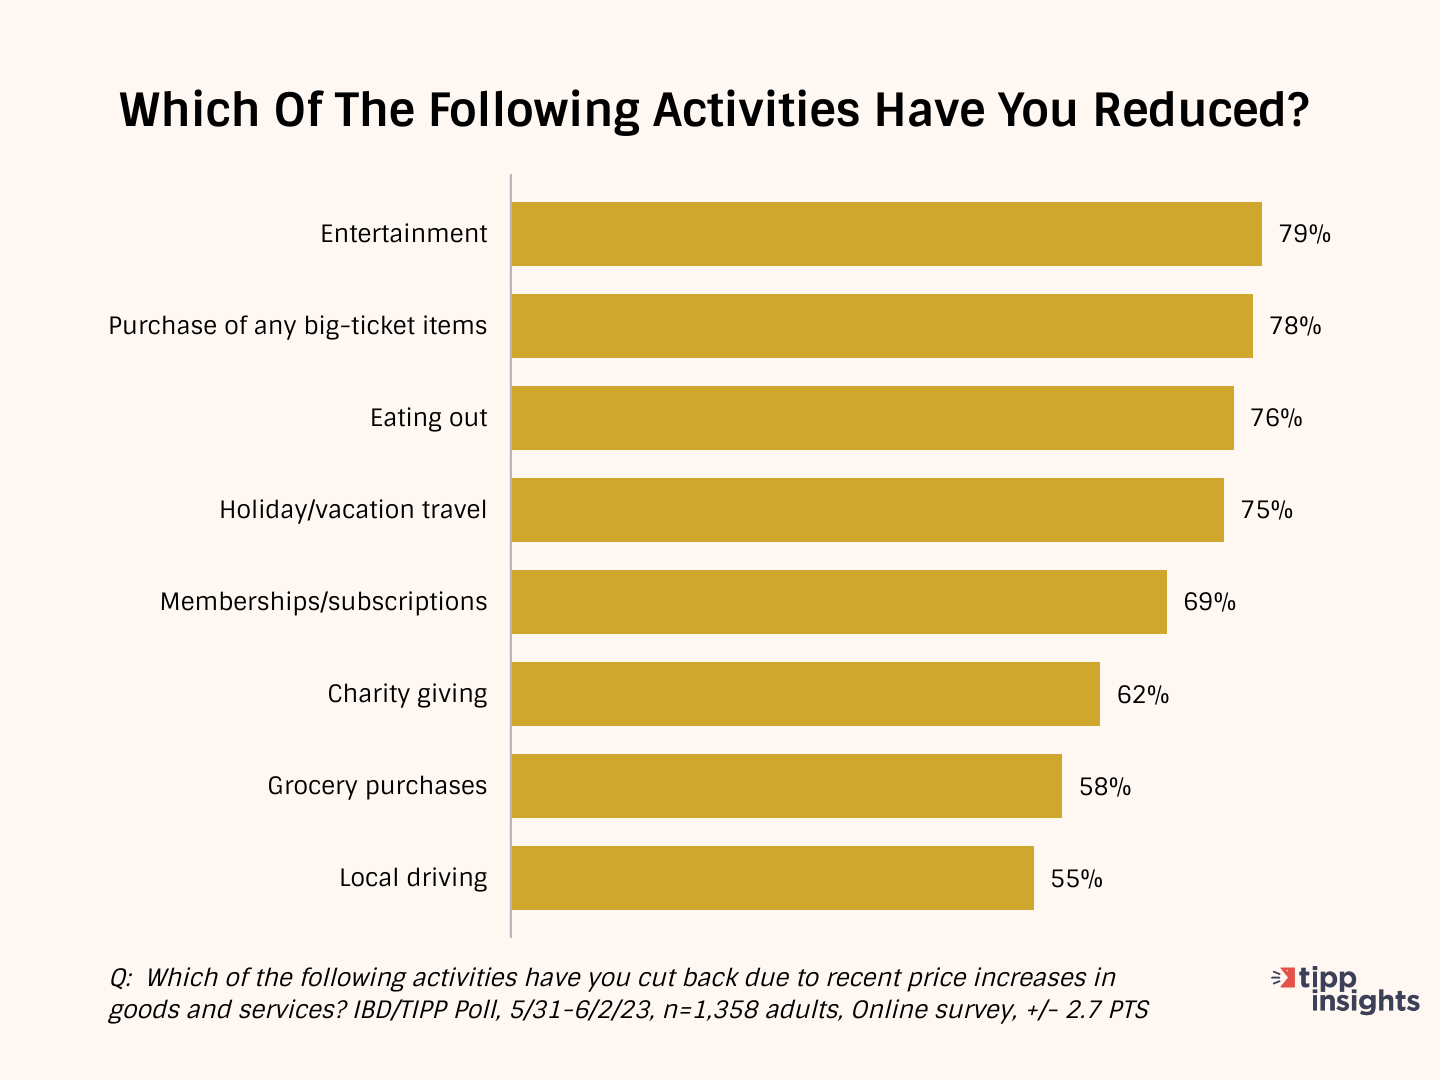
As a result of inflation, Americans are cutting back on household spending.
Most Americans are spending less. They are cutting back on entertainment (79%), purchasing big-ticket items (78%), eating out (76%), holiday/vacation travel (75%), and memberships/subscriptions (69%).
Many (62%) are cutting back on even good causes such as charity giving. Nearly three out of every five (58%) households spend less on groceries. The high gasoline prices forced 55% to cut back on local driving.
Inflation Direction
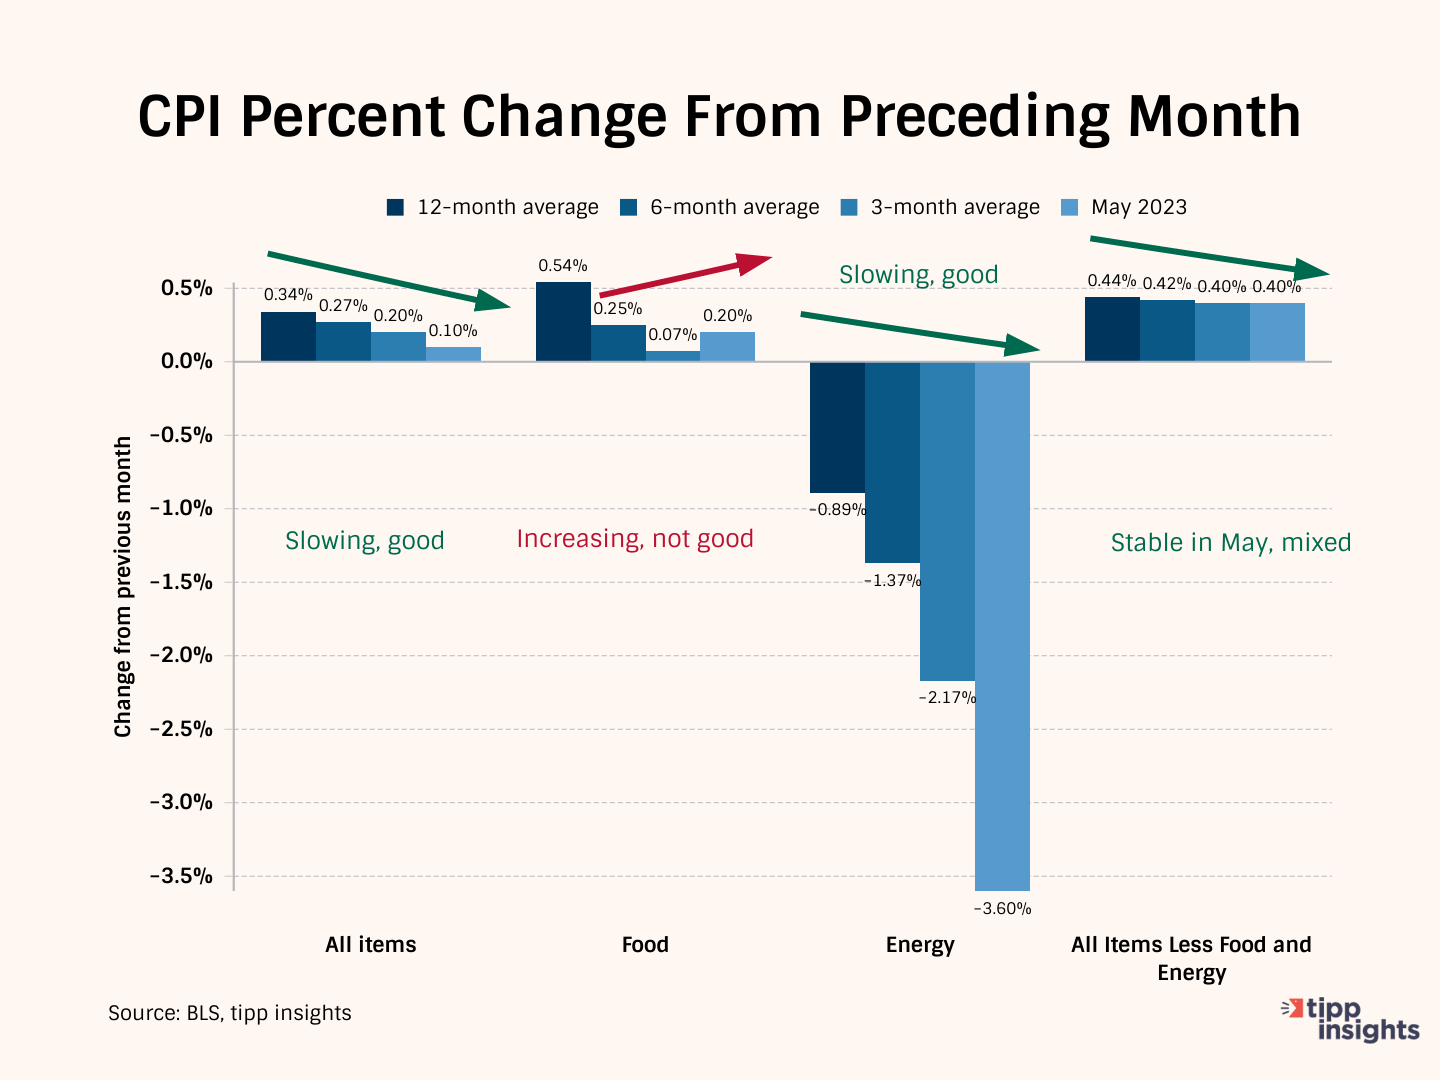
The chart below compares the 12-month average of monthly changes against the 6-month and the 3-month averages. We also show the reading for May 2023.
The 12-month average considers 12 data points and presents a long-term reference, while the six-month and three-month averages consider recent data points.
Typically, we compare the three-month average to the data from May 2023 to get a clearer picture. In May 2023, the average price increase for "All items" was 0.1%. However, the three-month average was higher at 0.20%. This means that the current reading is lower than the average of the past three months, indicating a slowdown in price increases.
Further, when we compare the three-month average of 0.20% to the average of the past six months, which was 0.27%, we can see that the longer period had slightly higher price increases. Similarly, the six-month average of 0.27% was lower than the average of the past 12 months, which was 0.34%.
Overall, this pattern suggests that price increases have been slowing down, which is a positive trend.
In May, the price increase for Food was 0.20%, higher than the 3-month average of 0.07%. This indicates that food prices have been rising recently.
The Energy situation showed improvement in May, with a decline of 3.6%. This decrease in May 2023 (-3.60%) is better than the three-month moving average of -2.17%, indicating an improvement.
“All items less food and energy” is called “core inflation,” i.e., after removing volatile food and energy components. The core inflation reading in May was 0.40%, the same as the three-month average of 0.40%. This indicates that there was neither improvement nor deterioration in inflation during that period.
Meanwhile, the three-month average of 0.40% is lower than the six-month average of 0.42%, suggesting a slowdown in inflation. Additionally, the six-month average of 0.42% is lower than the 12-month average of 0.44%.
Overall, these numbers indicate a mixed situation, where the inflation rate has been relatively stable but with a slight slowdown in recent months.
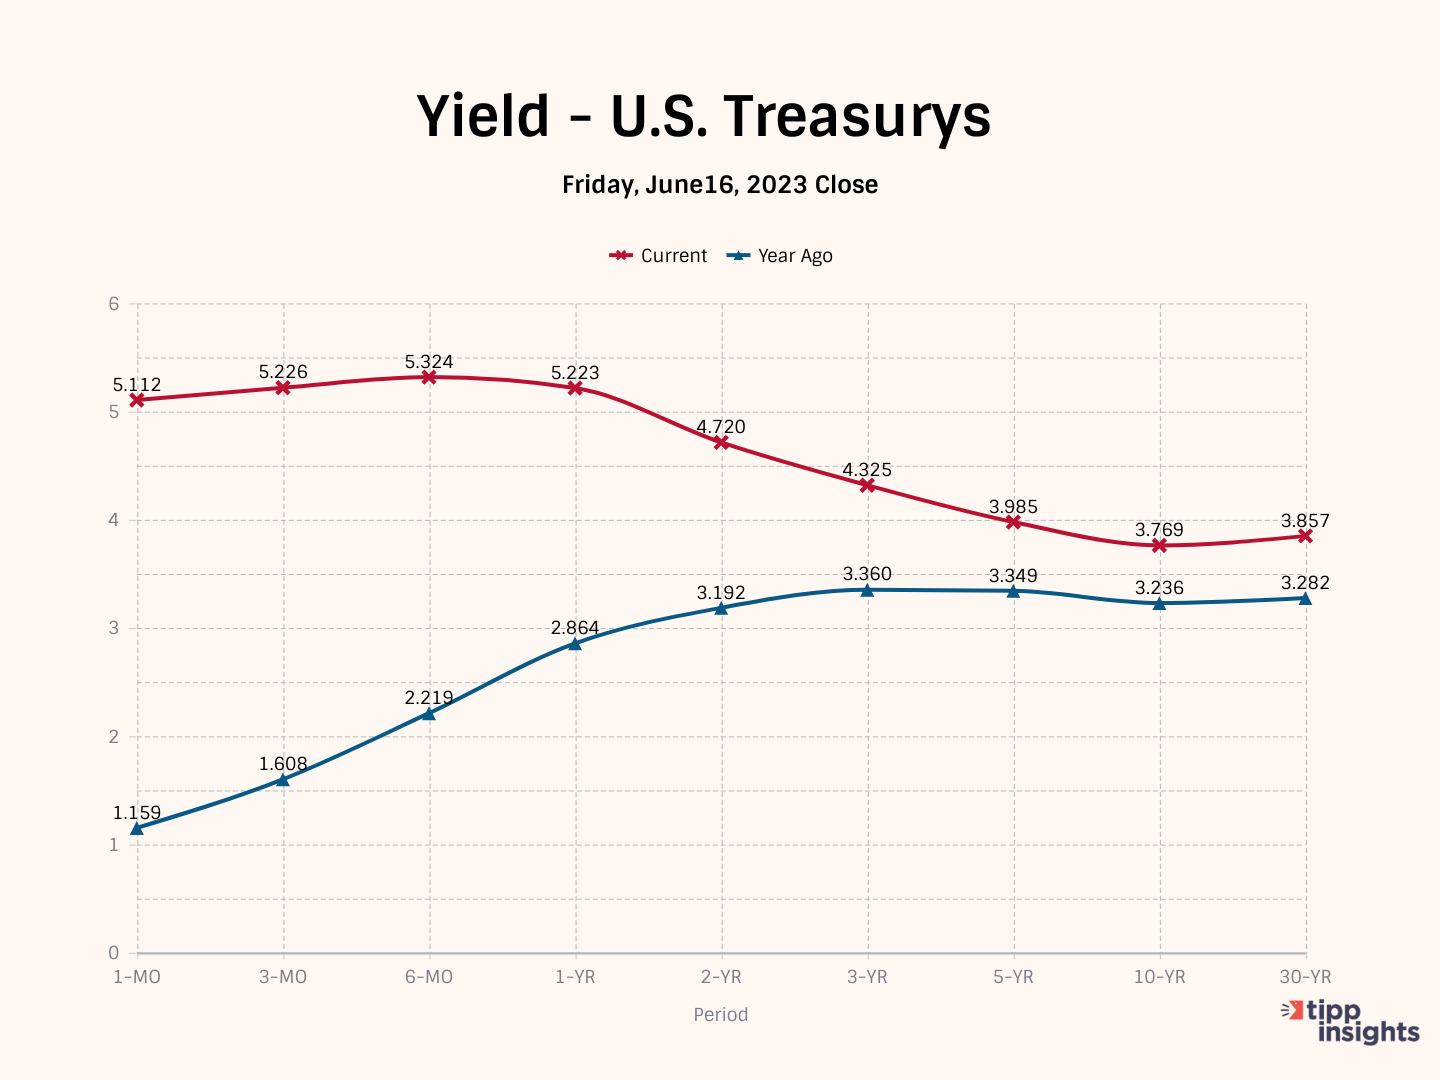
With an inverted yield curve, short-term U.S. treasuries pay higher interest rates than long-term U.S. treasuries. The closing yields on Friday were:
- 5.112% for the 1-month Treasury bill
- 5.226% for the 3-month Treasury bill
- 5.324% for the 6-month Treasury bill
- 5.223% for the 1-year Treasury bill
- 4.720% for the 2-year Treasury note
- 3.769% for the 10-year Treasury note
- 3.857% for the 30-year Treasury bond
The inverted yield curve is a leading indicator of lower inflation but also a leading indicator of recession.
Stagflation
Most Americans struggle, challenged by the high core inflation rate of 5.3%.
Last week, the Federal Reserve decided to keep interest rates unchanged, stating they need more information before making policy adjustments. However, the "dot plot," which shows predictions for future interest rates from FOMC members, indicates a significant increase. The median expectation suggests a projected interest rate of 5.6% by the end of 2023.
Higher interest rates are likely to slow down the economy further.
America’s debt burden is higher as the cost of servicing America’s deficits goes up, with inflation being so high. Each time the Federal Reserve increases interest rates to contain inflation, the U.S. government must pay higher interest rates to service its ballooning debt.
A recent IBD/TIPP Poll revealed that most Americans view the economy negatively. Over half (55%) believe we are in a recession, and an additional 62% feel that the economy is not improving.
Considering these factors, we predict that the U.S. economy will face an extended period of stagflation characterized by a recession and inflation.
To access the TIPP CPI readings each month, you can visit tippinsights.com. We'll publish the TIPP CPI and our analysis in the days following the Bureau of Labor Statistics (BLS) report. The upcoming release of TIPP CPI is on July 13, 2023. We'll also post a spreadsheet in our store for download.
Hey, want to dig deeper? Download data from our store for a small fee.
Want to understand better? We recently wrote an explainer that sixth graders could understand. Everyone can benefit from it. Milton Friedman's Priceless Lessons On Inflation
Like our insights? Show your support by becoming a paid subscriber!
TIPP Audio
Must Listen - Selected by tippinsights Editorial Board
Please email editor-tippinsights@technometrica.com