Here's what economists and the media miss when they talk about inflation: even though inflation is going down year over year, Americans continue to feel the pinch.
Why? Prices have increased by about 14% in the last two years, which is a short time, but wages have not kept up. Consumers are still getting used to the new reality, and comparing inflation from year to year doesn't show how hard it is for them.
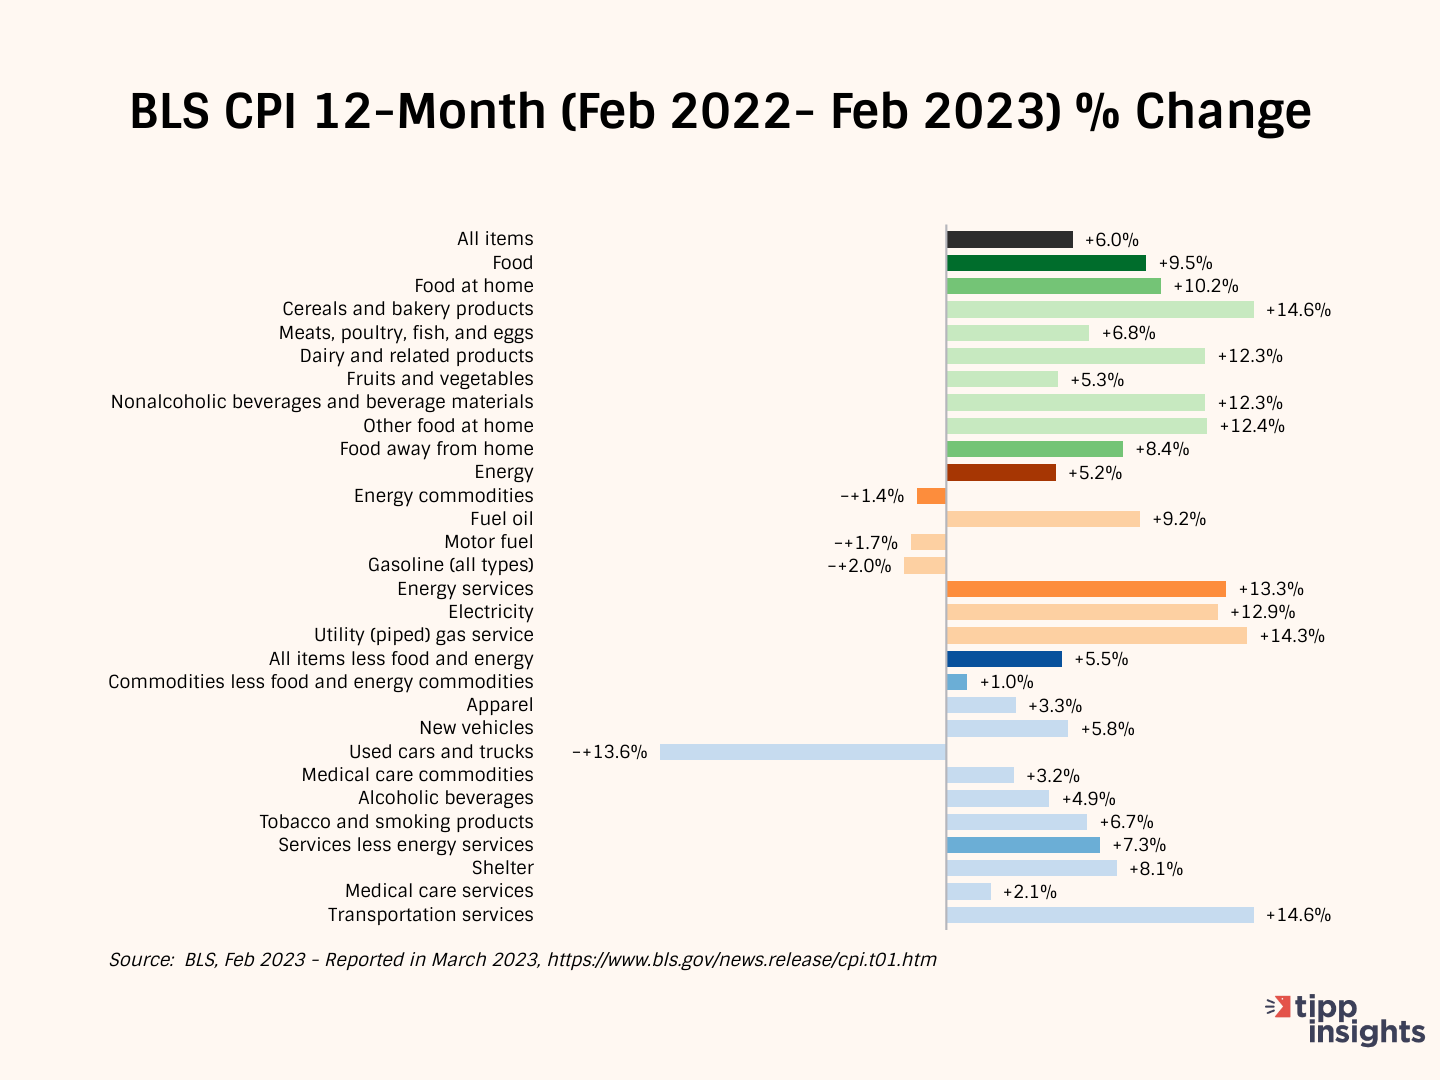
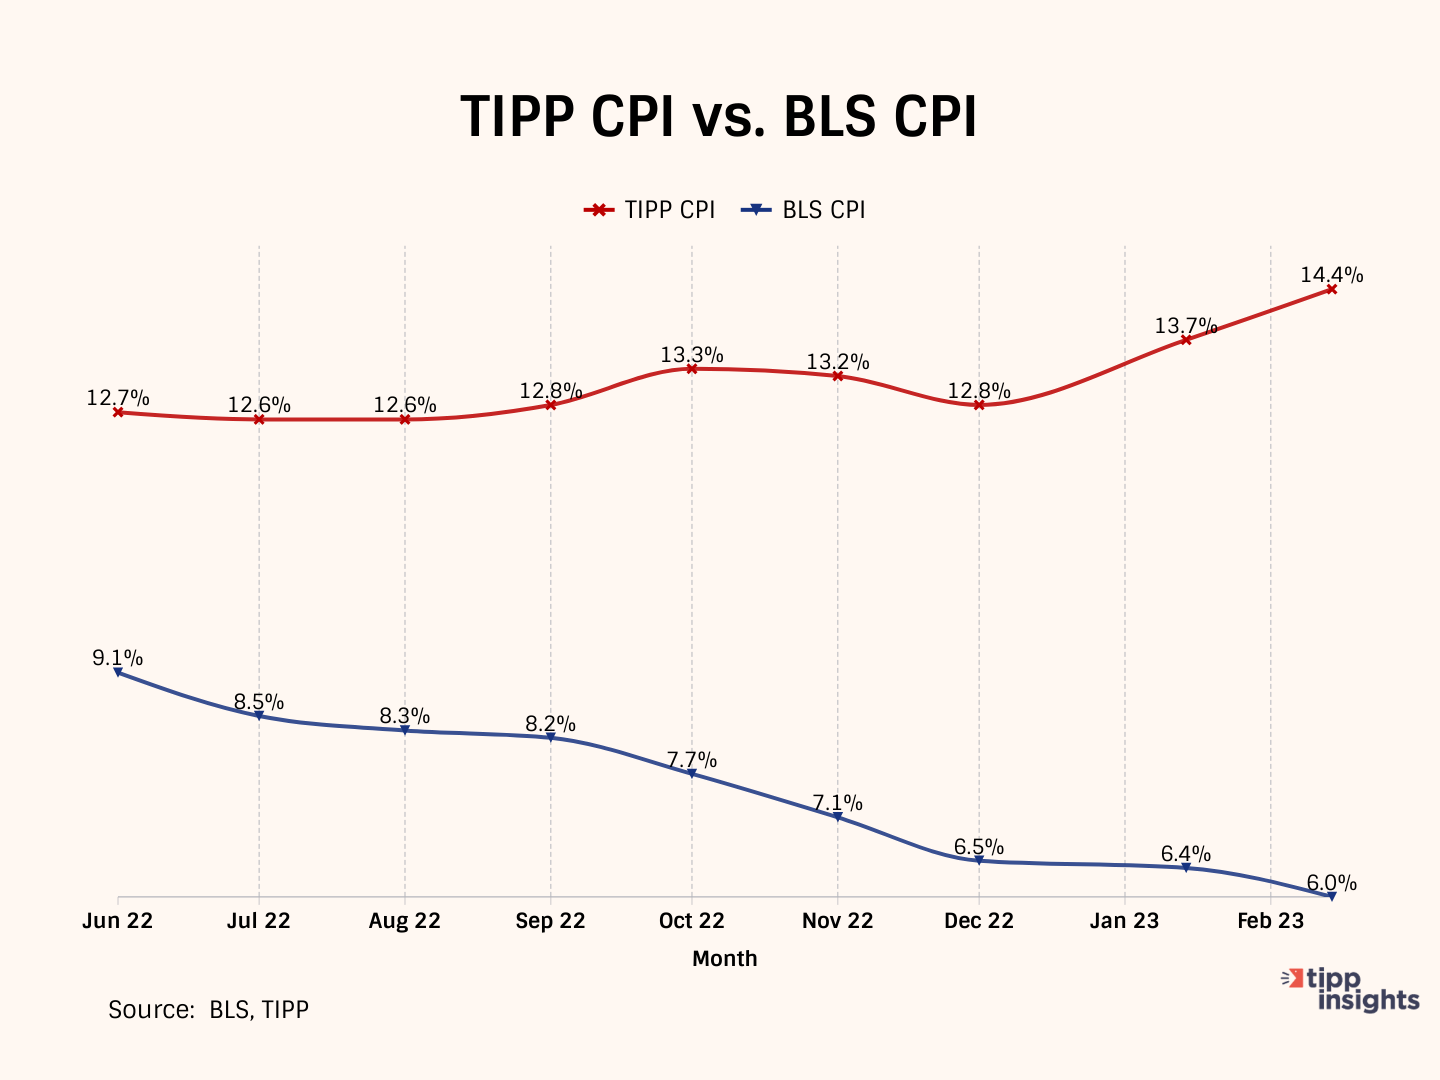
The Consumer Price Index (CPI) released by the government on Tuesday showed a 6.0% year-over-year increase in prices from February 2022 to February 2023, edging down from a rate of 6.4% in January. The CPI has declined steadily from a 40-year high of 9.1% in June to 6.0% in February.
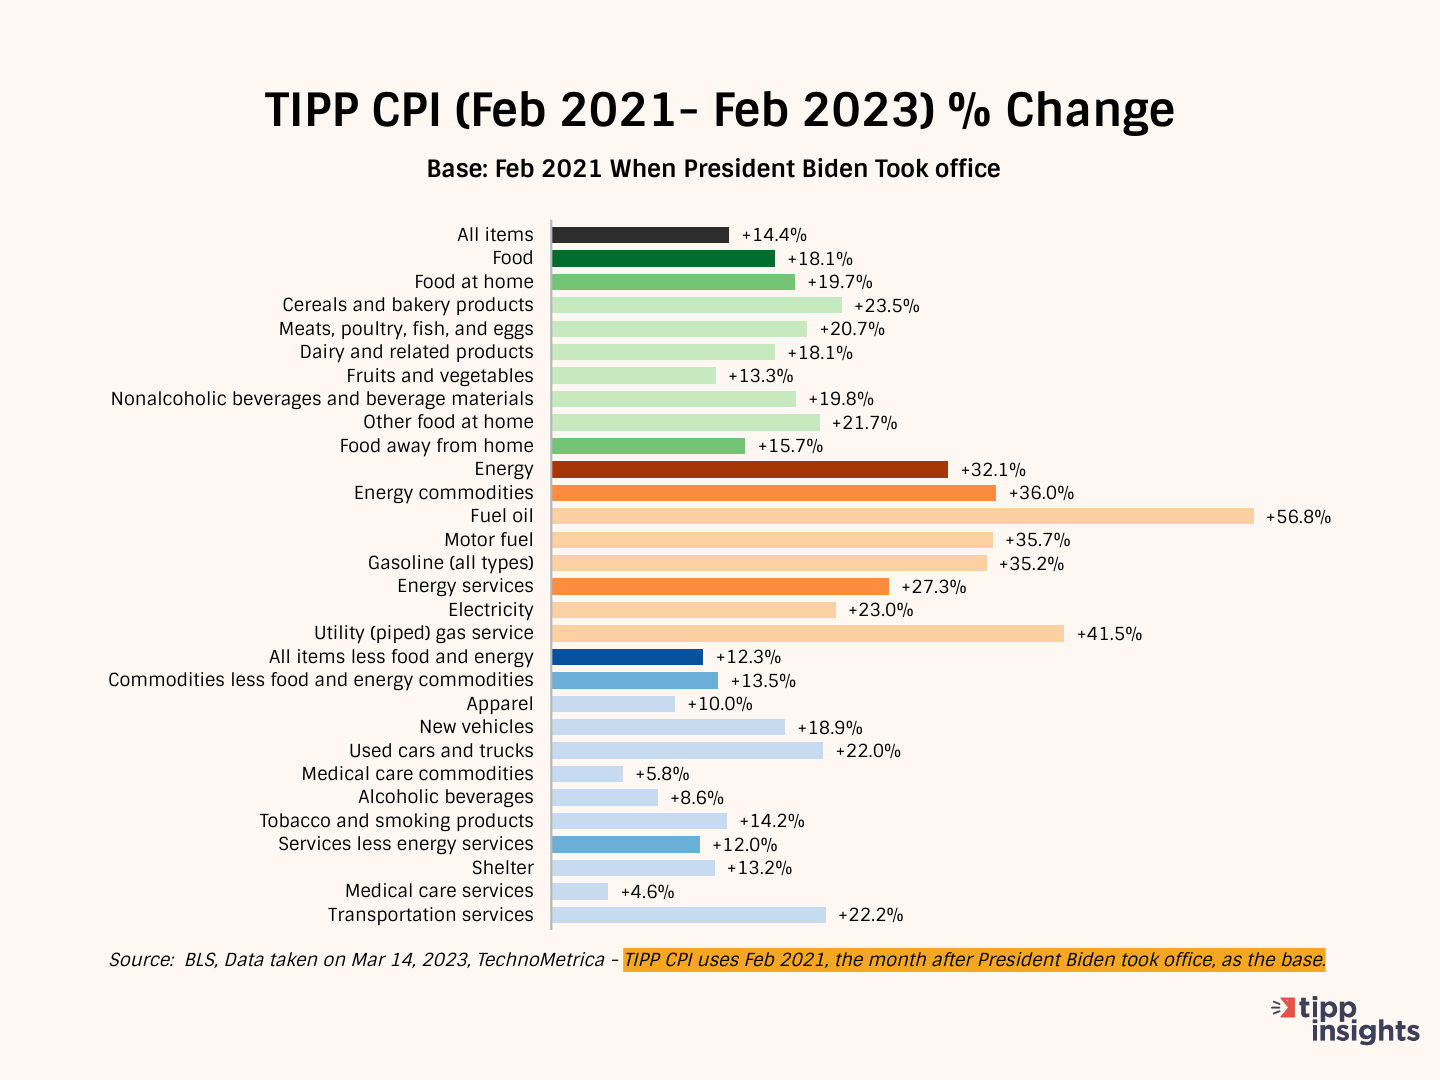
We developed the TIPP CPI, a metric that uses February 2021, the month after President Biden's inauguration, as its base and measures the rate of change.
Bidenflation, measured by the TIPP CPI using the same underlying data, stood at 14.4% in February. It was 13.7% in January, 12.8% in December, 13.2% in November, and 13.3% in October.
While we recognize that CPIs are index numbers, for common understanding, we mean percent change when we refer to TIPP CPI and BLS CPI.
All TIPP CPI measures are anchored to the base month of February 2021, making it exclusive to the economy under President Biden's watch. Please note that we use the relevant Bureau of Labor Statistics (BLS) underlying data but recalibrate it to arrive at the TIPP CPI.
Significant inflation had already set in by the middle of 2021. In February 2022, CPI inflation was 7.9 percent. The official CPI year-over-year increases will compare prices to inflated bases in the coming months. The year-over-year calculation may moderate the statistics, but you will still feel the pinch of inflation.
TIPP CPI vs. BLS CPI
The following four charts present details about the new metric.
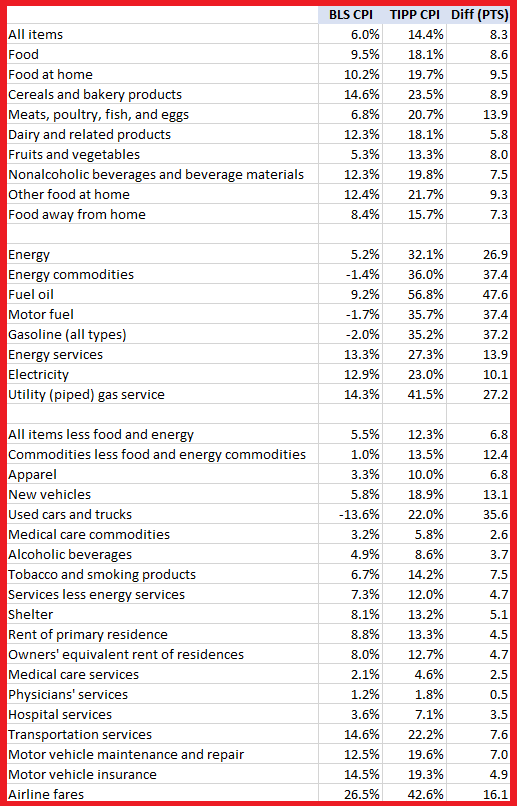
The annual CPI increase reported by BLS is 6.0% for February 2023. Compare this to the TIPP CPI of 14.4%, an 8.3-point difference. Prices have increased by 14.4% since President Biden took office.
Food prices increased by 18.1% under President Biden's watch compared to only 9.5% as per BLS CPI, a difference of 8.6 points.
Energy prices increased 32.1% per TIPP CPI compared to 5.2% according to BLS CPI, a difference of 26.9 points.
The Core CPI is the price increase for all items, excluding food and energy. The Core TIPP CPI was 12.3% compared to 5.5% BLS CPI in the year-over-year measure, a 6.8-point difference.
Further, gasoline prices have increased by 35.2% since President Biden took office. However, the BLS CPI shows that gasoline price has improved by 2.0%, a difference of 37.2 points.
Used car prices have risen by 22.0% during President Biden's term. The BLS CPI shows that the prices have dropped by 13.6%, a difference of 35.6 points.
Inflation for air tickets under President Biden is 42.6% compared to the BLS CPI finding of 26.5%, a difference of 16.1 points.
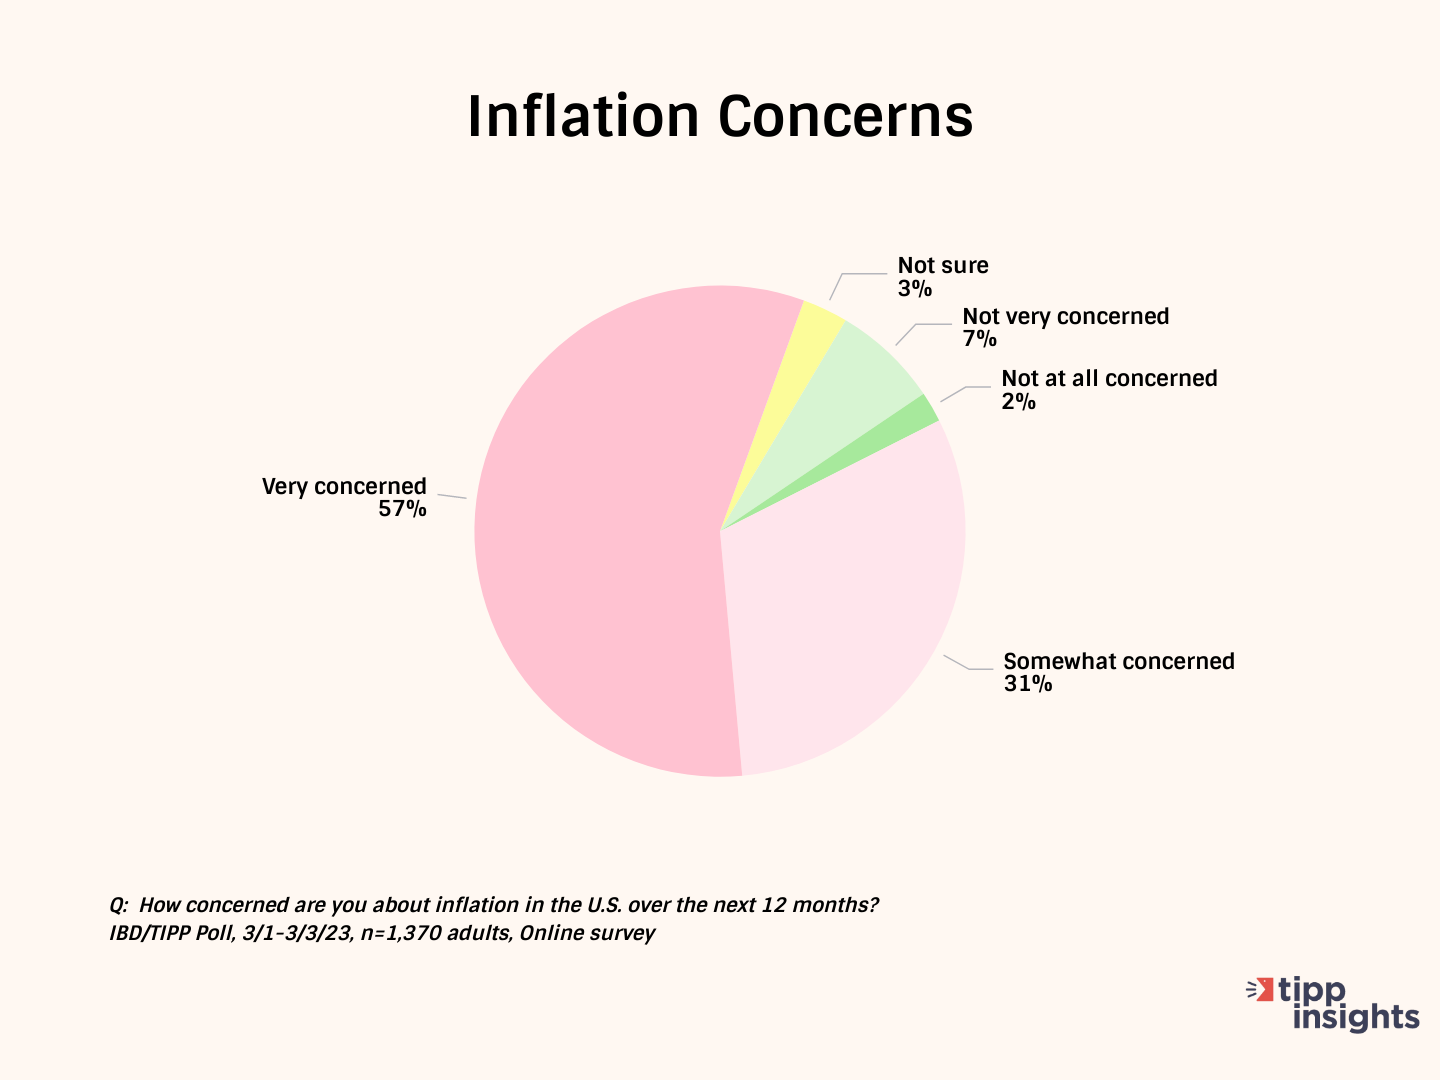
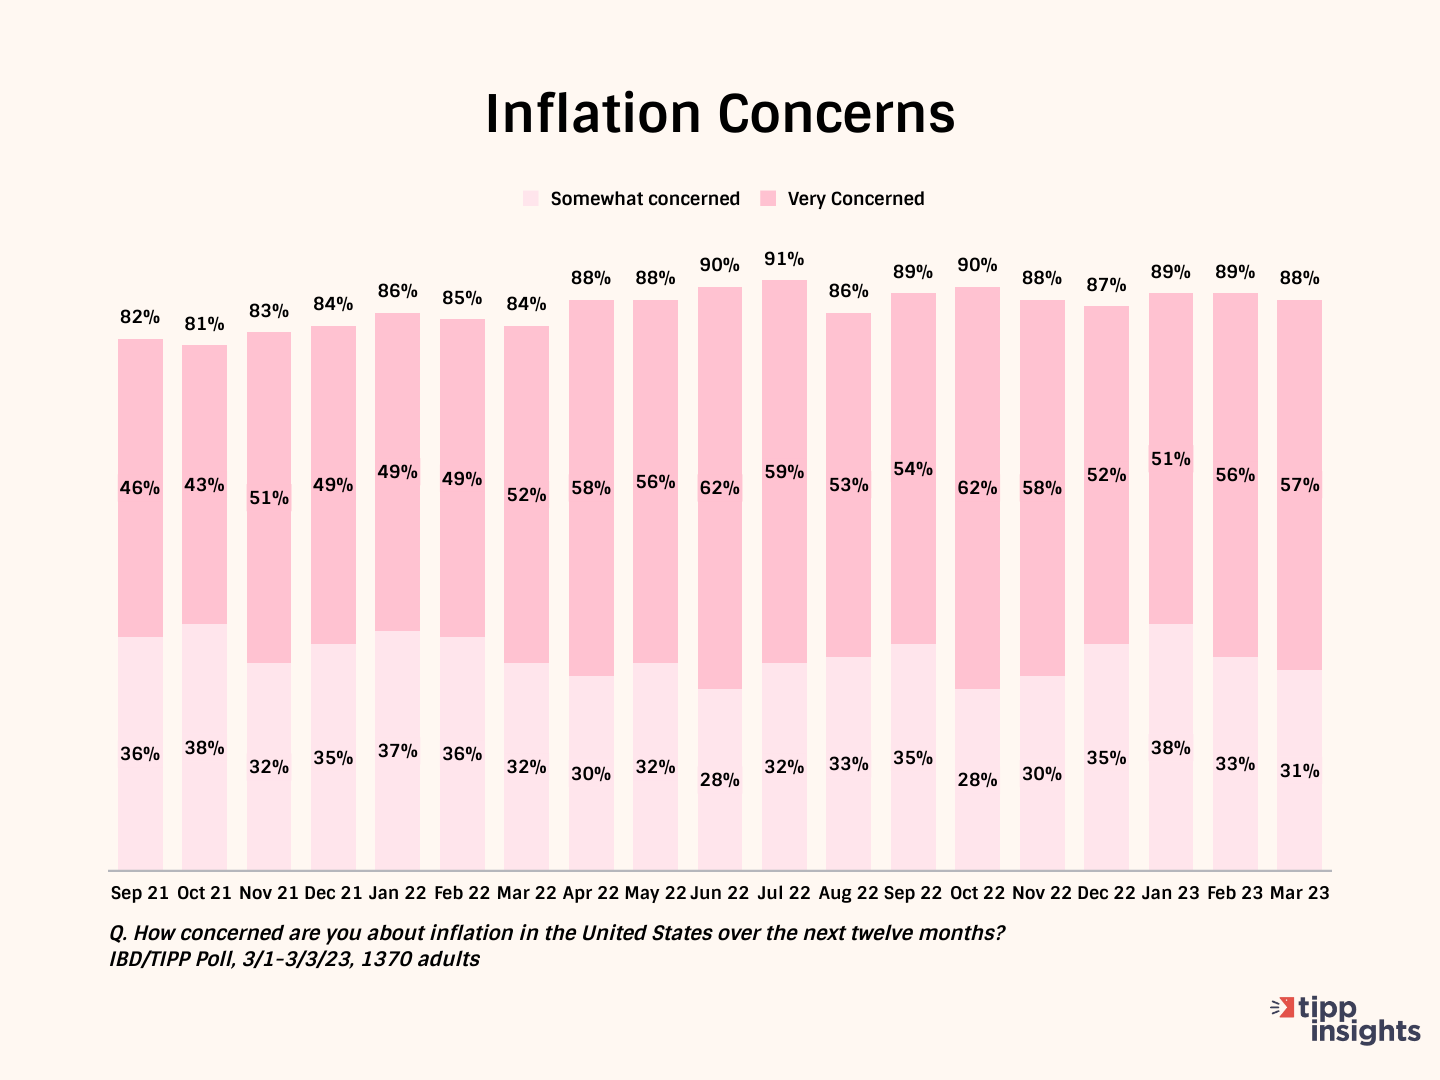
Americans' Concerns
The latest Investor's Business Daily/TIPP Poll, completed earlier this month, shows that nine in ten (88%) of survey respondents are concerned about inflation. Throughout the past year, inflation concerns have stayed above 80%. The share of "very concerned" has been over 50% for twelve consecutive months.
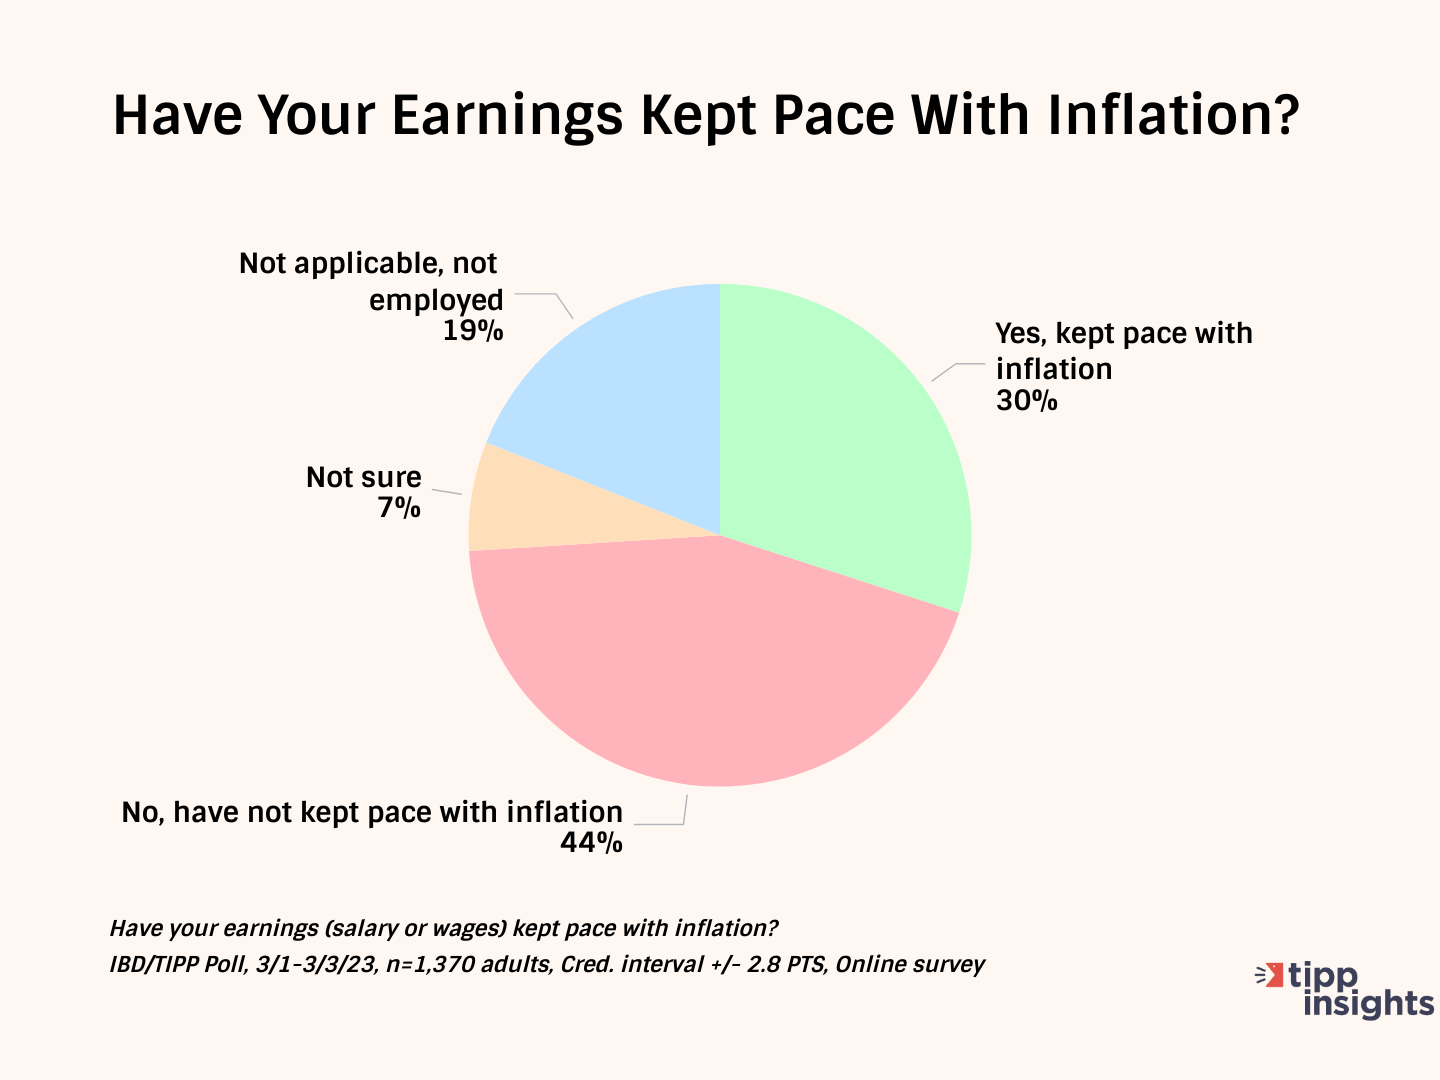
Over two in five (44%) say their wages have not kept pace with inflation. Only 30% say their income has kept pace with inflation. This statistic hovered in the low twenties for most of the last year. The positive change in the recent two months may denote the start of a new trend.
As a result of inflation, Americans are cutting back on household spending.
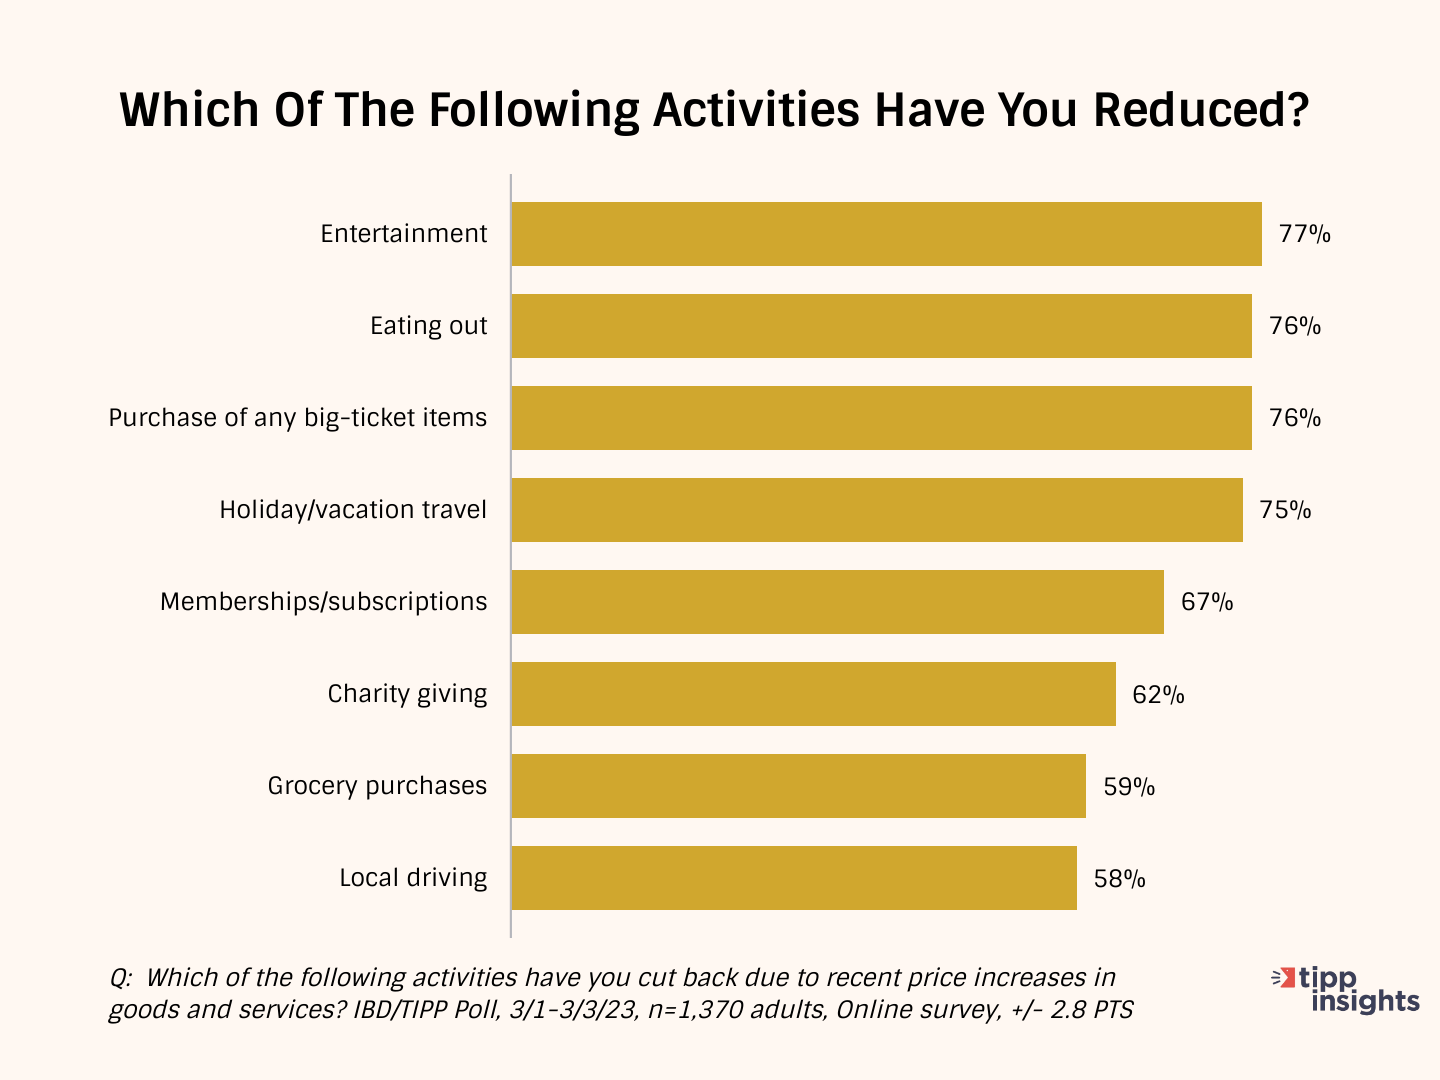
Most Americans are spending less. They are cutting back on entertainment (77%), eating out (76%), purchasing big-ticket items (76%), holiday/vacation travel (75%), and memberships/subscriptions (67%).
Many (62%) are cutting back on even good causes such as charity giving. Nearly three out of every five (59%) households spend less on groceries. The high gasoline prices forced 58% to cut back on local driving.
Inflation Direction
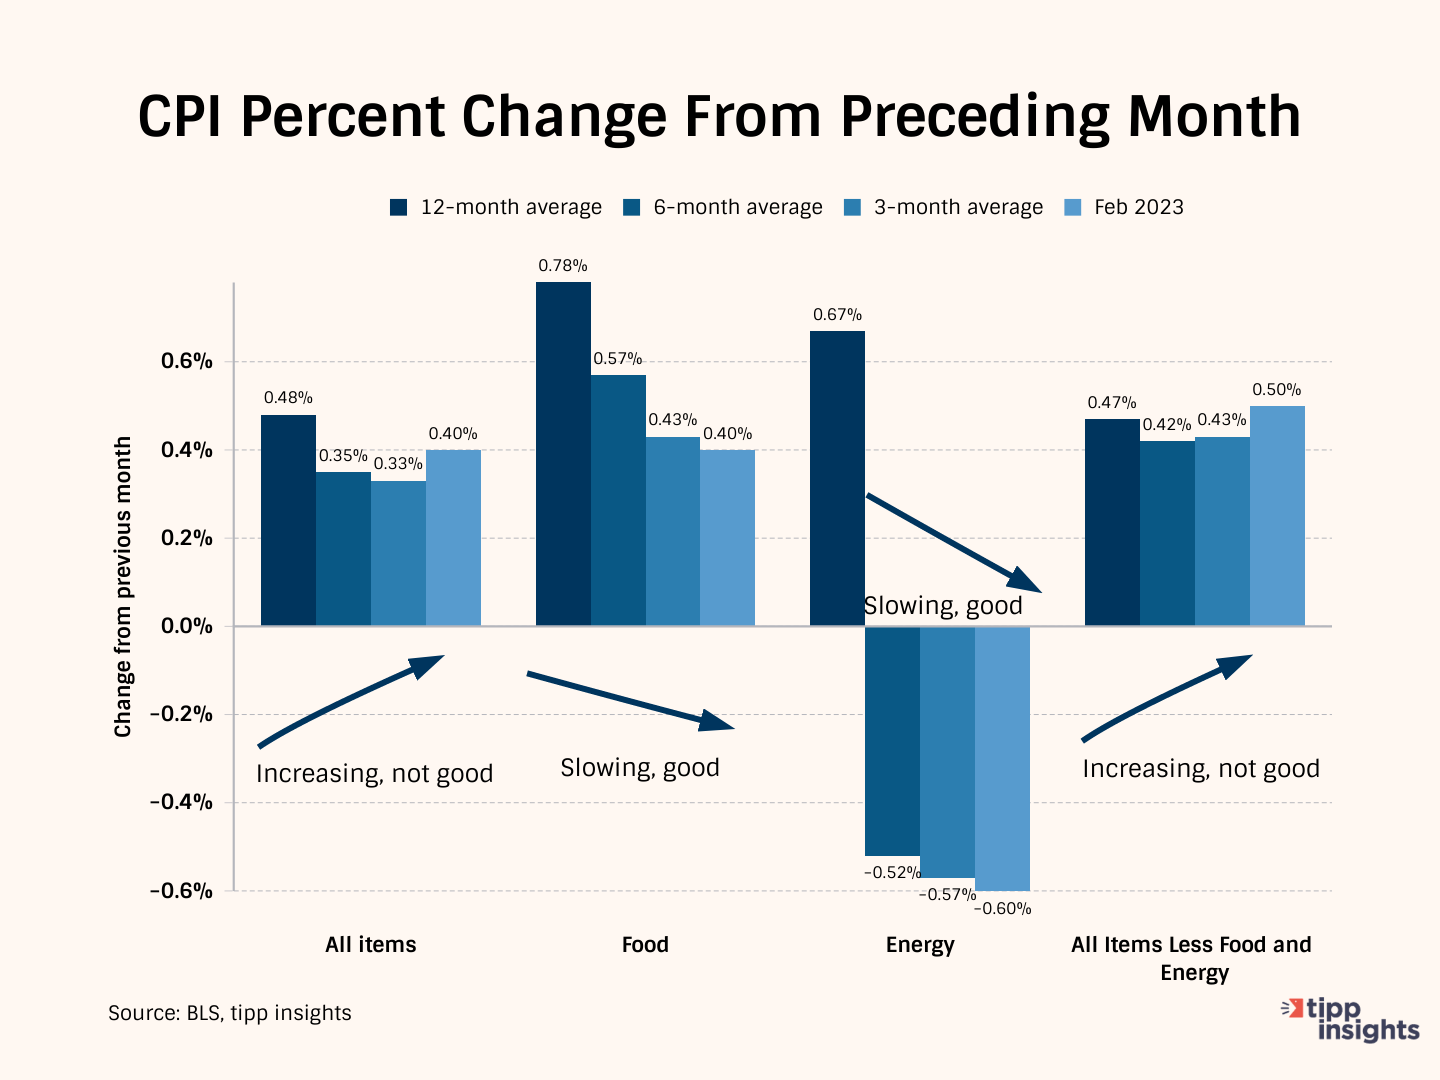
The chart below compares the 12-month average of monthly changes against the 6-month and the 3-month averages. We also show the reading for February 2023.
The 12-month average considers 12 data points and presents a long-term reference, while the six-month and three-month averages consider recent data points.
To better understand, compare the three-month average to February 2023 data. For “all items,” the three-month average was 0.33% vs. 0.4% in February 2023. It is increasing, and hence it is not good.
The February reading for Food is lower than the 3-month average of 0.43%. It shows a modest improvement. Also, notice the downward trend.
Similarly, for Energy, the rate is decreasing. The decrease in February 2023 (-0.60%) exceeded the three-month moving average of -0.57%, indicating improvement.
For “all items less food and energy,” the February reading of 0.50% is higher than the three-month average of 0.43%, indicating deterioration.
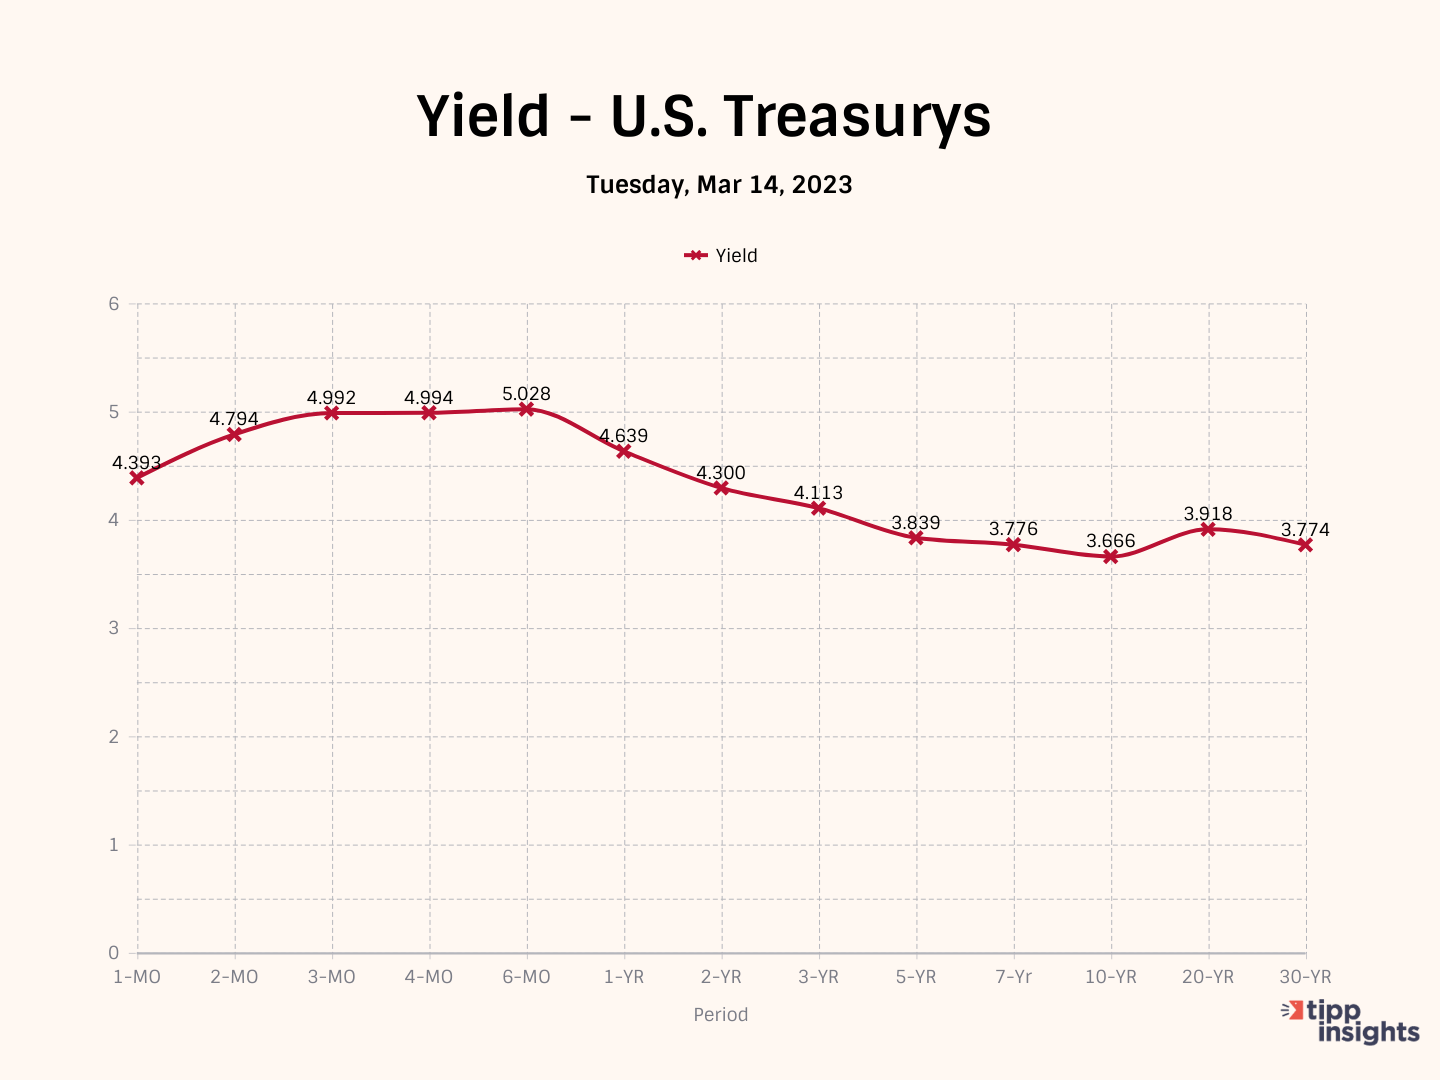
Treasury yields rose on Tuesday. With an inverted yield curve, short-term U.S. treasuries are paying higher interest rates than long-term U.S. treasuries:
- 4.992% for the 3-month Treasury bill
- 5.028% for the 6-month Treasury bill
- 4.298% for the 2-year Treasury
- 3.666% for the 10-year
- 3.774% for the 30-year
The inverted yield curve is a leading indicator of lower inflation but also a leading indicator of recession.
Most Americans (53%) believe the economy is in a recession, and another 57% think the economy is not improving.
To access the TIPP CPI readings each month, you can visit tippinsights.com. We'll publish the TIPP CPI and our analysis in the days following the Bureau of Labor Statistics (BLS) report. The upcoming release of TIPP CPI is on April 13, 2023. We'll also post a spreadsheet in our store for free download.
Hey, want to dig deeper? Download data from our store for a small fee!
Want to support our work? Become a paid subscriber!
Want to understand inflation better? We recently wrote an explainer that sixth graders could understand. Everyone can benefit from it. Milton Friedman's Priceless Lessons On Inflation


