
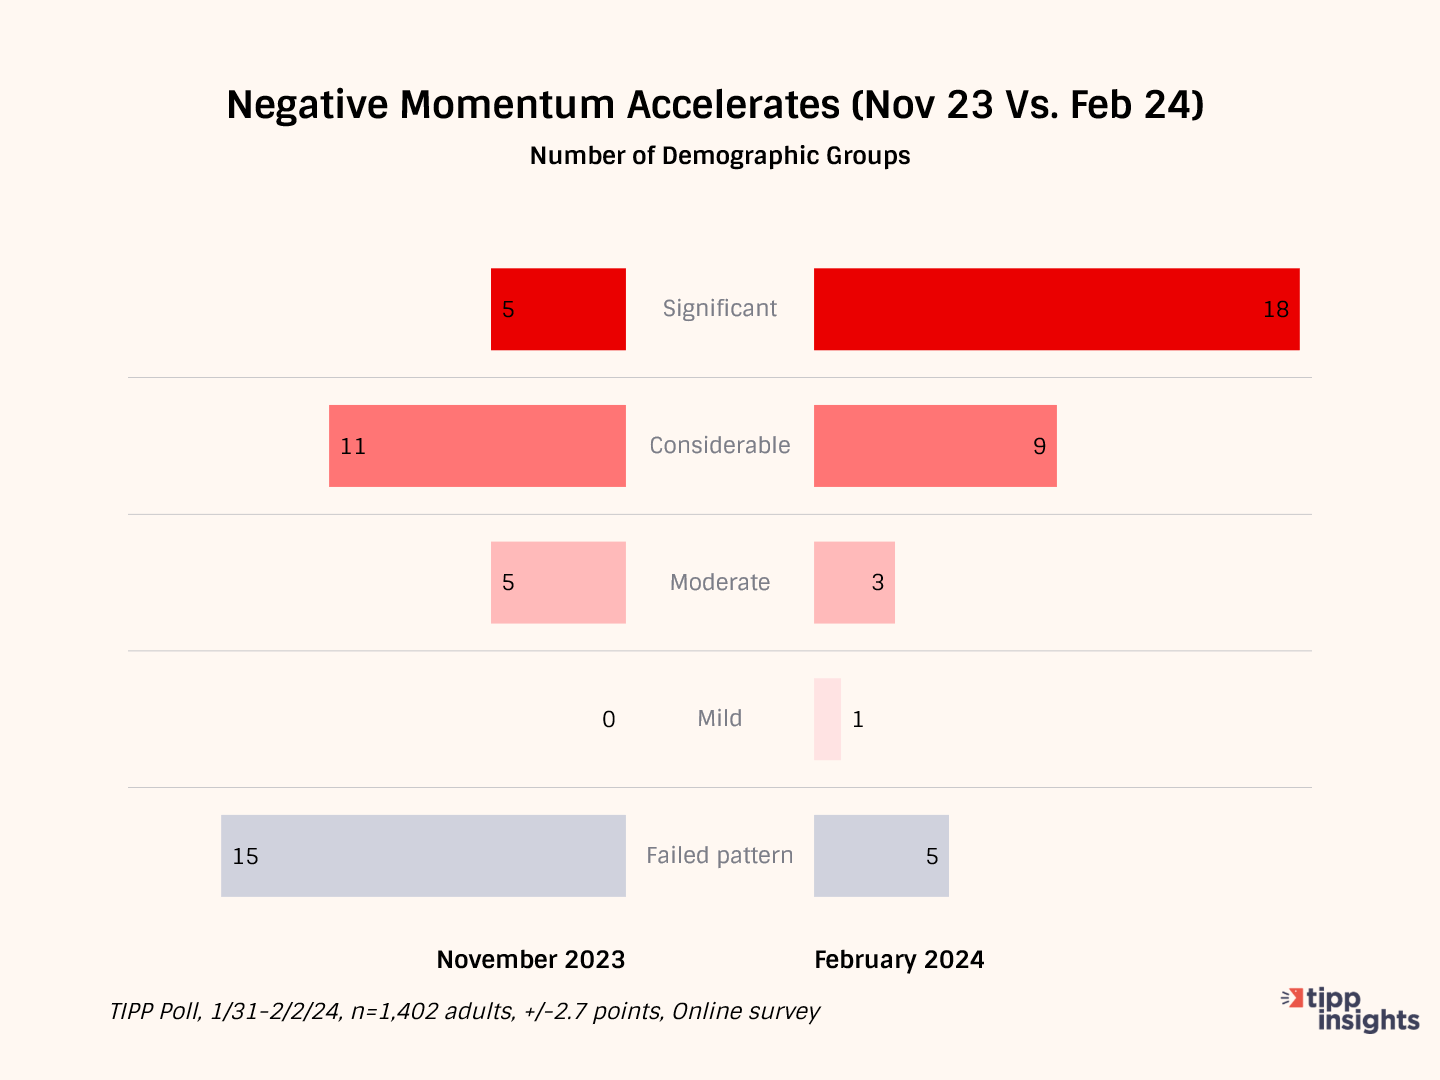
- President Biden shows ‘significant’ vulnerability in 18 critical demographic groups based on the TIPP Presidential Leadership Index
- Only five demographic groups had shown ‘significant’ vulnerability in November 2023
- RELATED: Biden’s Lackluster Report Card — An Albatross For Reelection
Using the TIPP Presidential Leadership Index, we presented our momentum analysis for 36 demographic groups in November 2023. This month, we repeated the same analysis to discover that President Biden's negative momentum has extended to a much broader range of demographic segments.
To our shock, President Biden is now vulnerable among 31 groups compared to 21 in November. We categorize four levels of vulnerability: significant, considerable, moderate, and mild. The number of demographic groups experiencing "significant" vulnerability has sharply increased from five in November to 18 this month.
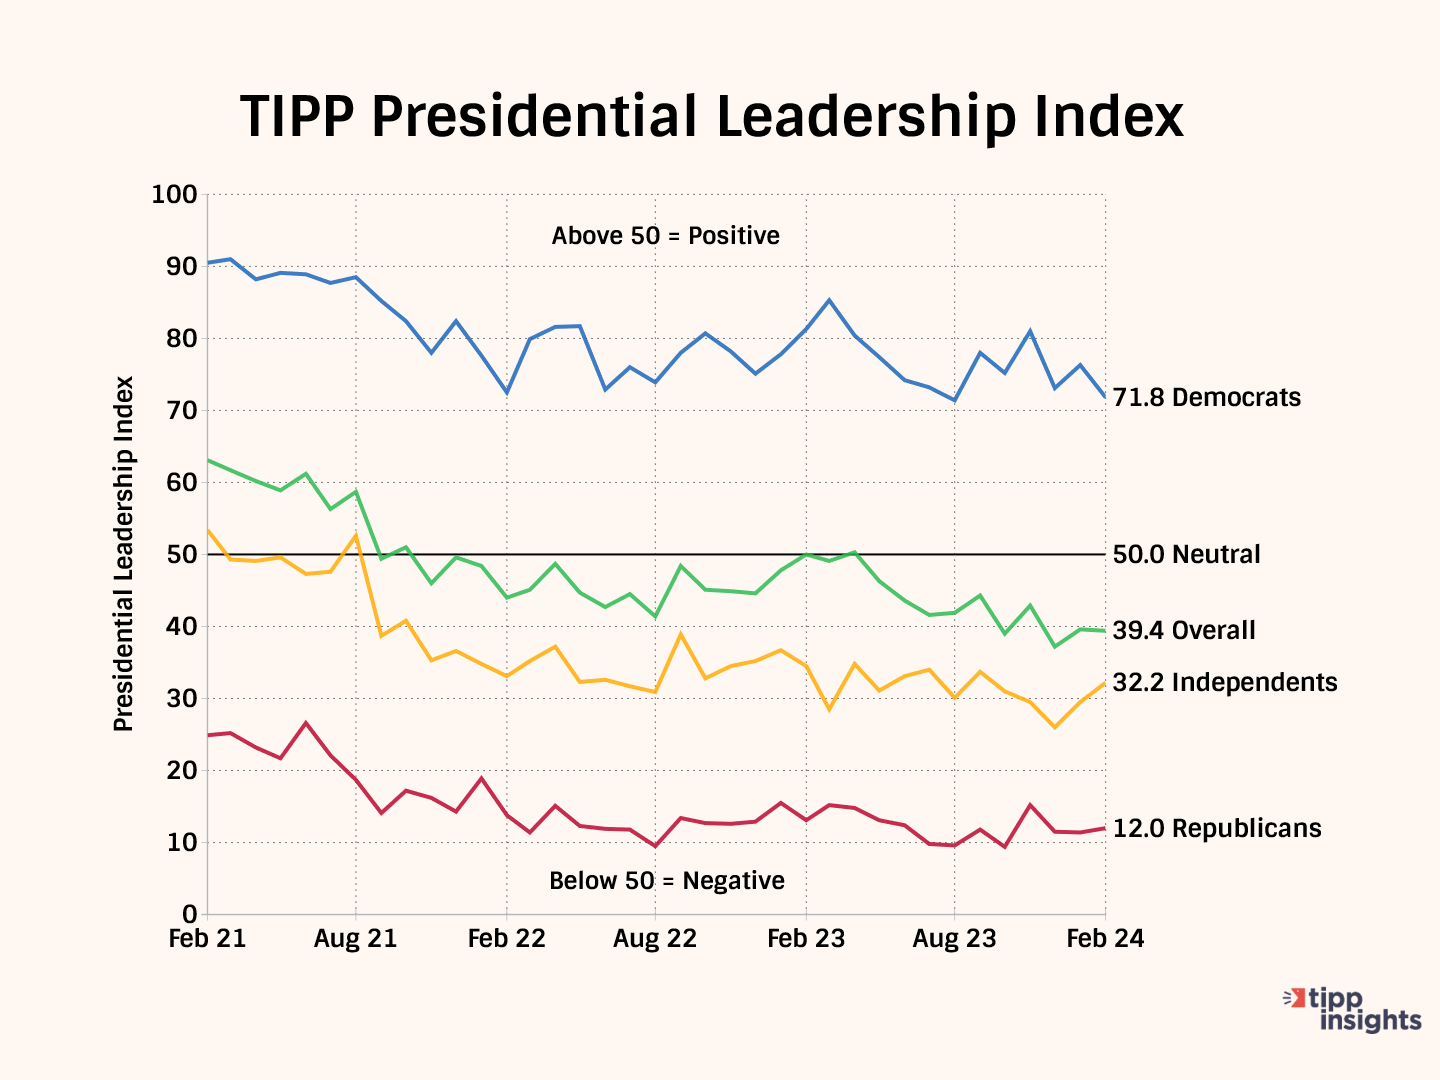
Presidential Leadership Index
Here’s what the TIPP Presidential Leadership Index is based on.
Two decades ago, we developed the Presidential Leadership Index, an innovative metric considering favorability, job approval, and Presidential Leadership of the sitting/current President.
We compute the favorability component based on the survey question, "Overall, is your opinion of the President generally favorable, generally unfavorable, or are you not familiar enough to say one way or the other?"
The basis for the index's job approval component is the question: "In general, do you approve or disapprove of the way Joe Biden is handling his job as President, or are you not familiar enough to say one way or the other?"
The question, "How would you describe the leadership that Joe Biden is providing for the country?" forms the basis for the leadership component.
The Presidential Leadership Index is the average of its three components. For the index and its components, a reading above 50.0 signals optimism, and below 50.0 indicates pessimism.
Negative Momentum
We define negative momentum as follows. First, for each demographic, we compute four averages of the Presidential Leadership Index:
- 37-month average for Biden's presidency (February 2021 to February 2024)
- 12-month average (March 2023 to February 2024)
- 6-month average (September 2023 to February 2024)
- 3-month average (December 2023 to February 2024)
We compare the long-term 37-month average and the short-term three-month average. Negative momentum is defined as a decrease in the three-month average compared to the 37-month average.
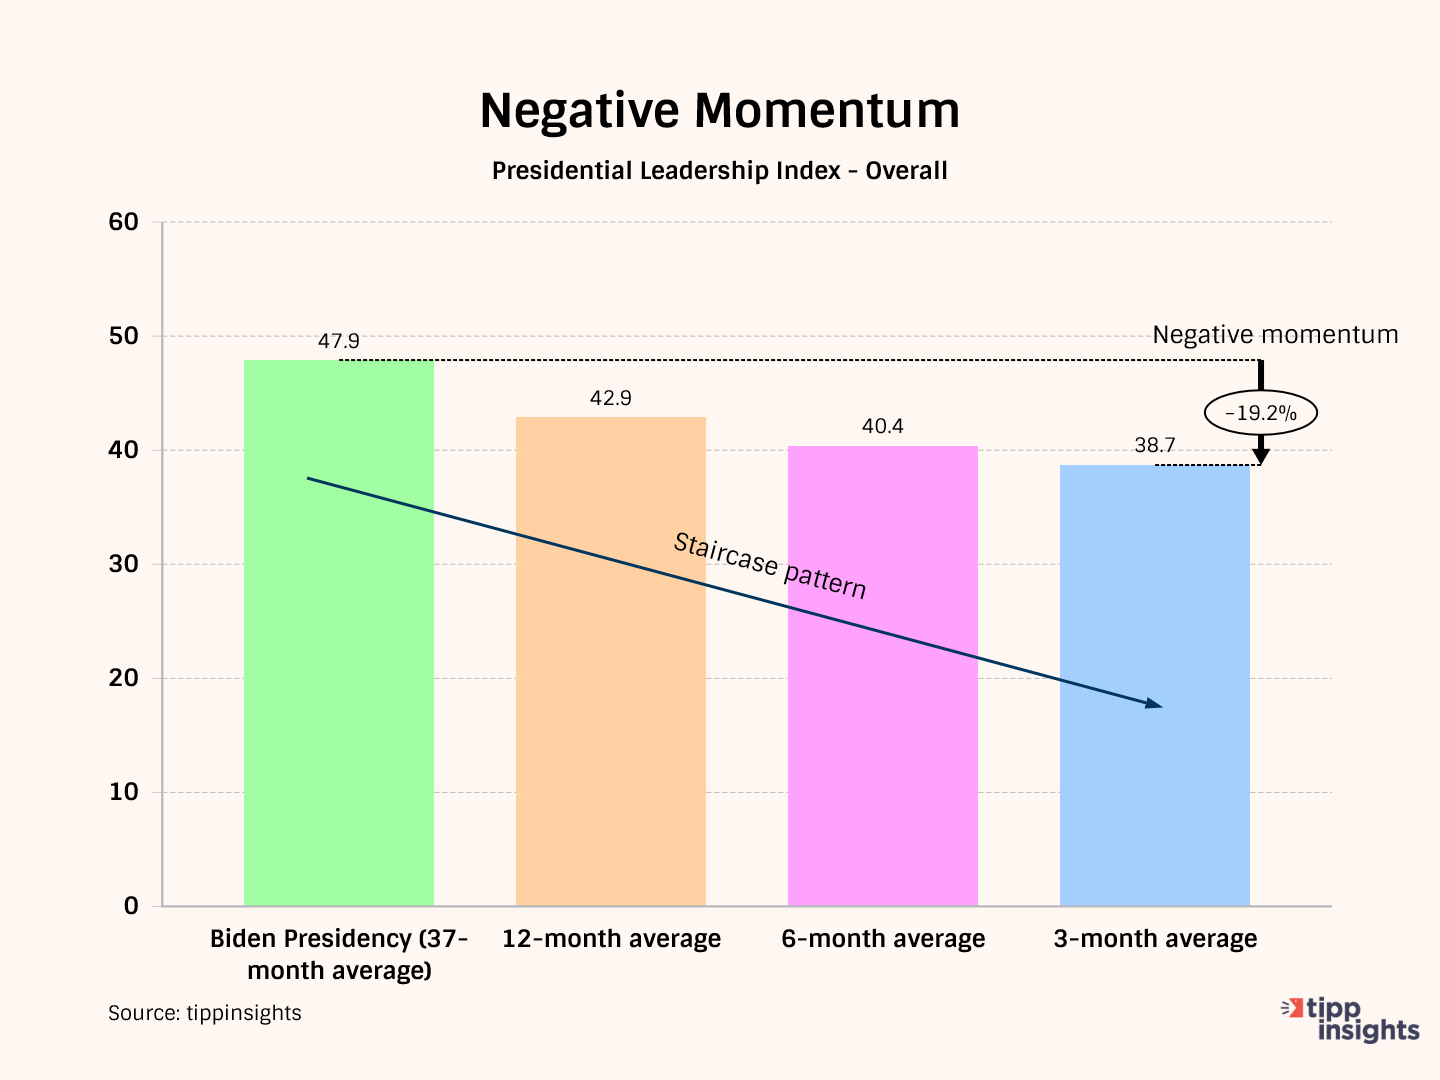
To ensure a clear indication of negative momentum and to err on the conservative side, we want to see gradual degradation over the period—a “stair-step pattern” where the 12-month average is lower than the 37-month average, the six-month average is lower than the 12-month average, and the three-month average is lower than the six-month average.
Take, for example, Biden’s overall approval:
- 47.9 - 37-month average for Biden's presidency (February 2021 to February 2024)
- 42.9 - 12-month average (March 2023 to February 2024)
- 40.4 - 6-month average (September 2023 to February 2024)
- 38.7 - 3-month average (December 2023 to February 2024)
Notice that the data follows a staircase pattern. The 12-month average of 42.9 is less than the 37-month long-term average of 47.9. Furthermore, the most recent six-month average of 40.4 is lower than the 12-month average of 42.9, indicating that Americans viewed Biden’s leadership less favorably in the past six months than in the past 12 months. Additionally, his recent three-month average of 38.7 falls below the six-month average of 40.4.
We compute negative momentum as the percentage decline from the 37-month long-term average of 47.9 to his most recent three-month average of 38.7, representing a 19.2% decline.
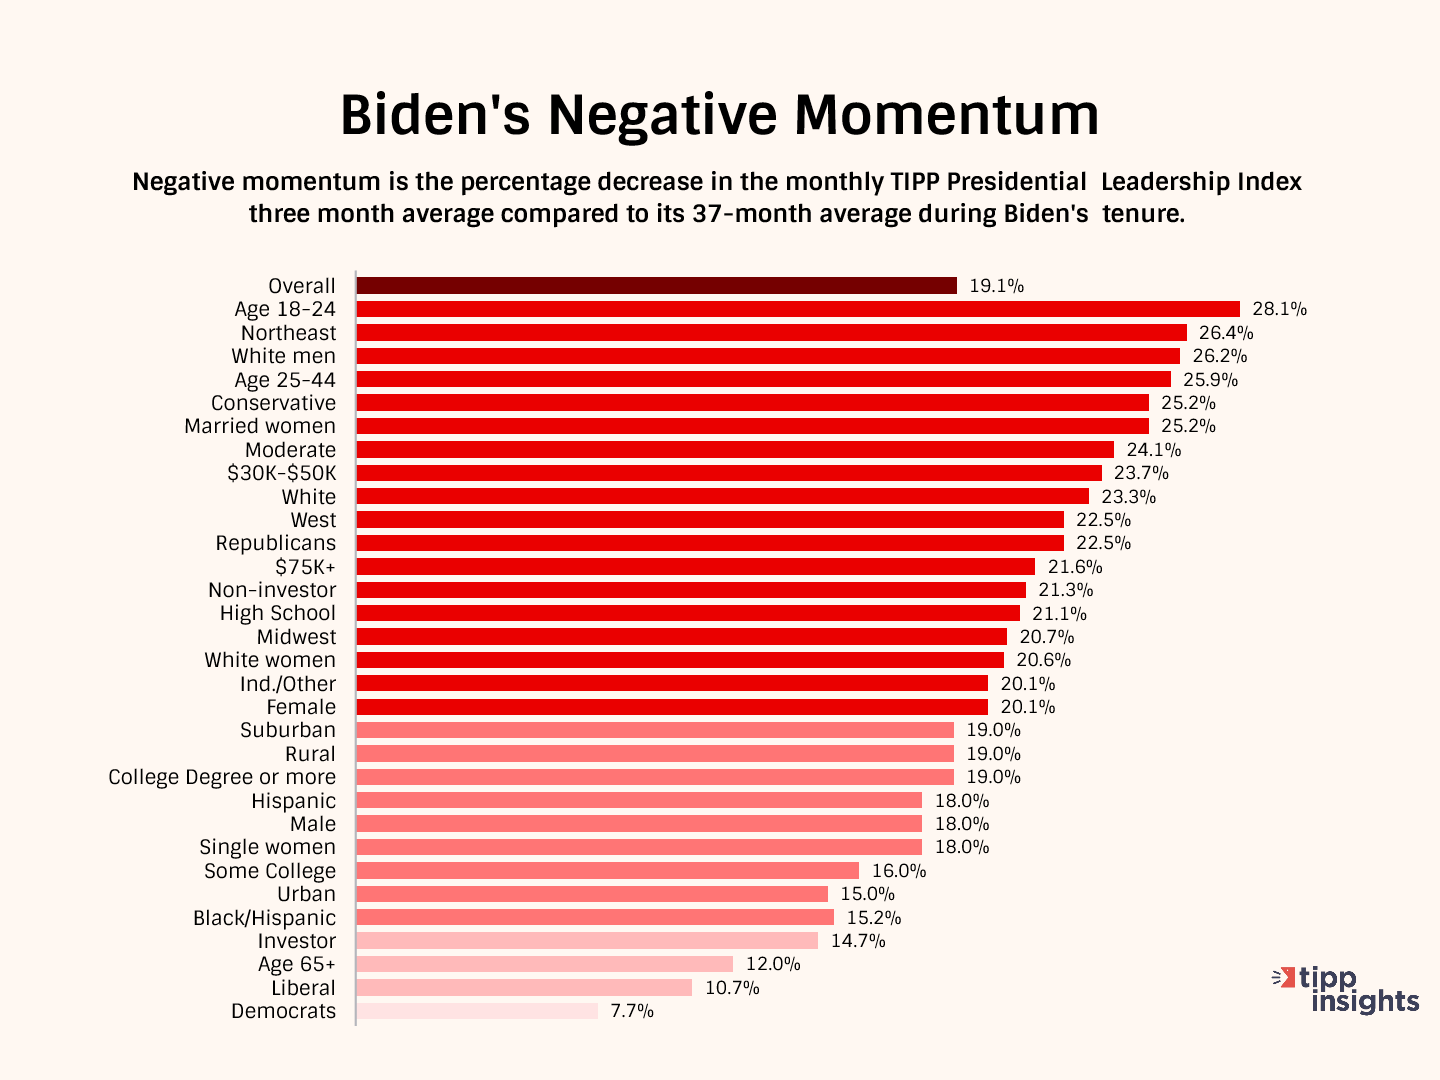
We performed the analysis for 36 demographic groups. Thirty-one of the 36 followed the staircase pattern. The chart below shows the 31 groups sorted from high to low by negative momentum score.
Notably, no single group had a higher short-term average than its long-term average. Five groups failed to have a staircase pattern and are designated “Failed pattern” even though they have double-digit negative momentum scores.
- $50K-75K (18.9%)
- Under $30K (14.0%)
- Black (12.9%)
- South (11.7%)
- Age 45-64 (11.7%)
In November, 15 groups did not have the staircase pattern, compared to five this month.
Based on the negative momentum scores, we grouped the demographic categories into four groups:
- Significant negative momentum (score 20% or more)
- Considerable negative momentum (score in the 15% to 20% range)
- Moderate negative momentum (score in the 10% to 15% bracket)
- Mild (under 10%)
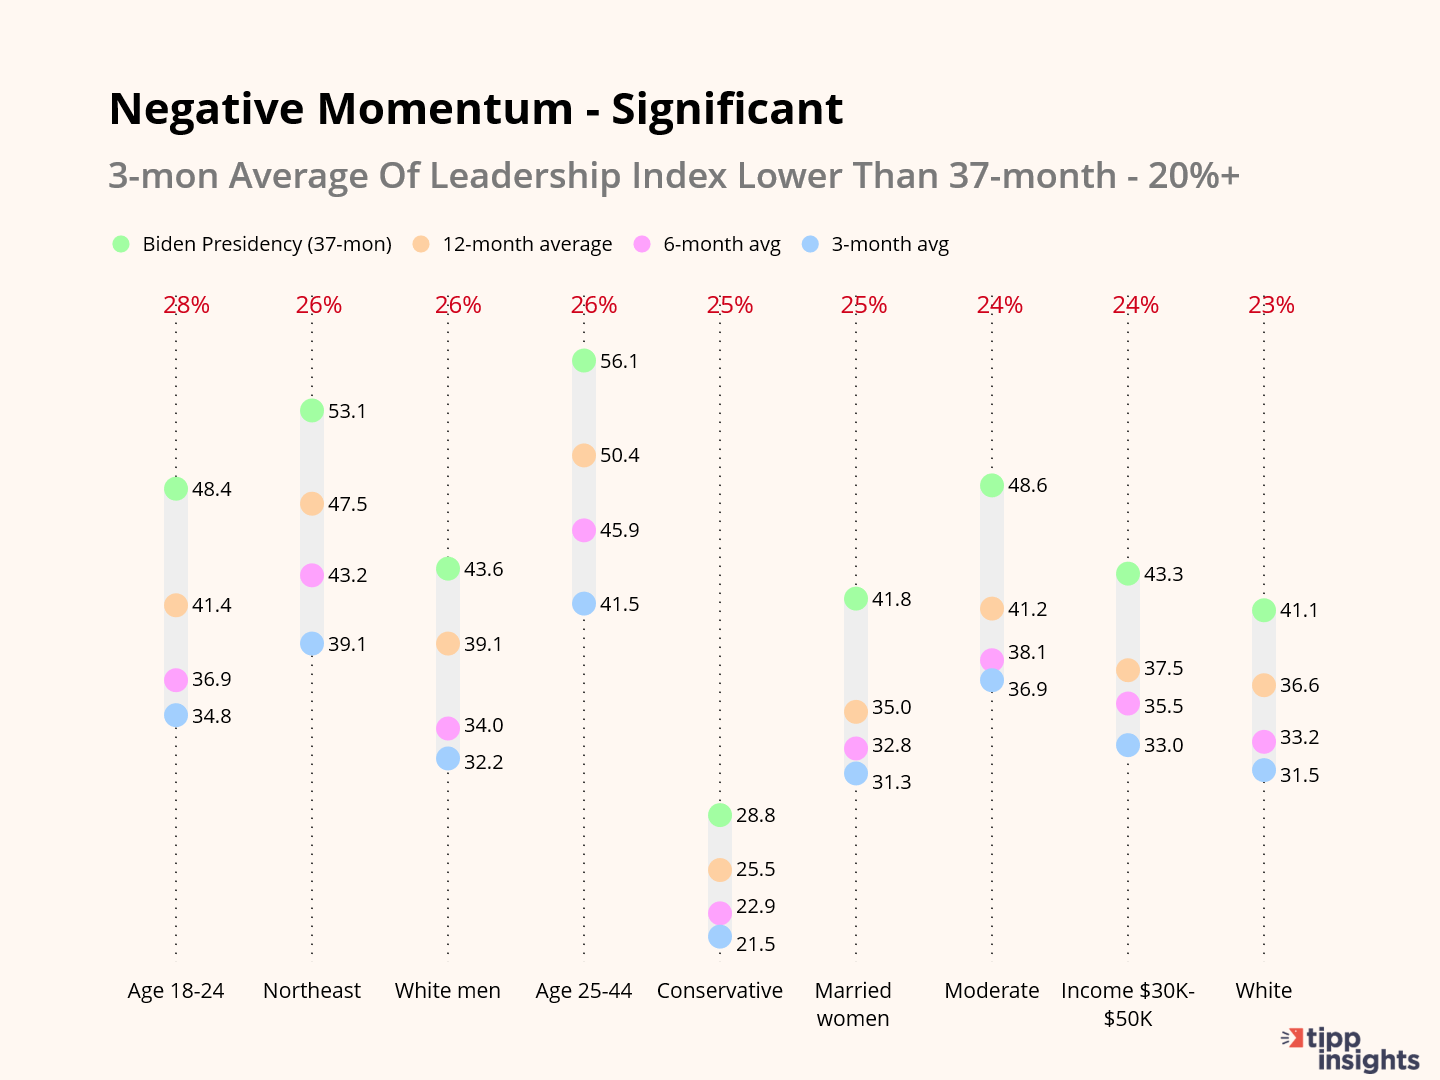
Significant Negative Momentum
President Biden faces significant negative momentum among 18 groups. Within the parenthesis is our measure of negative momentum, the drop in the short-term three-month average compared to the long-term 37-month average.
Statistically speaking, these groups present a significant challenge for reelection. To win reelection, President Biden must address their concerns. For example, the top five concerns of the age 18-24 segment are the Economy (33%), Gun violence/Gun control (27%), Abortion (21%), Homelessness (21%), and Home affordability (19%).
We have intentionally included conservatives and Republicans for completeness in our analysis despite their unlikely support for Biden.
- Age 18-24 (28%)
- Northeast (26%)
- White men (26%)
- Age 25-44 (26%)
- Conservative (25%)
- Married women (25%)
- Moderate (24%)
- Income $30K-$50K (24%)
- White (23%)
- West (22%)
- Republicans (22%)
- Income 75K+ (22%)
- Non-investors (21%)
- High School (21%)
- Midwest (21%)
- White women (21%)
- Ind./Other (20%)
- Female (20%)
The two charts below present these 18 vulnerable groups, their four averages, and the negative momentum score.
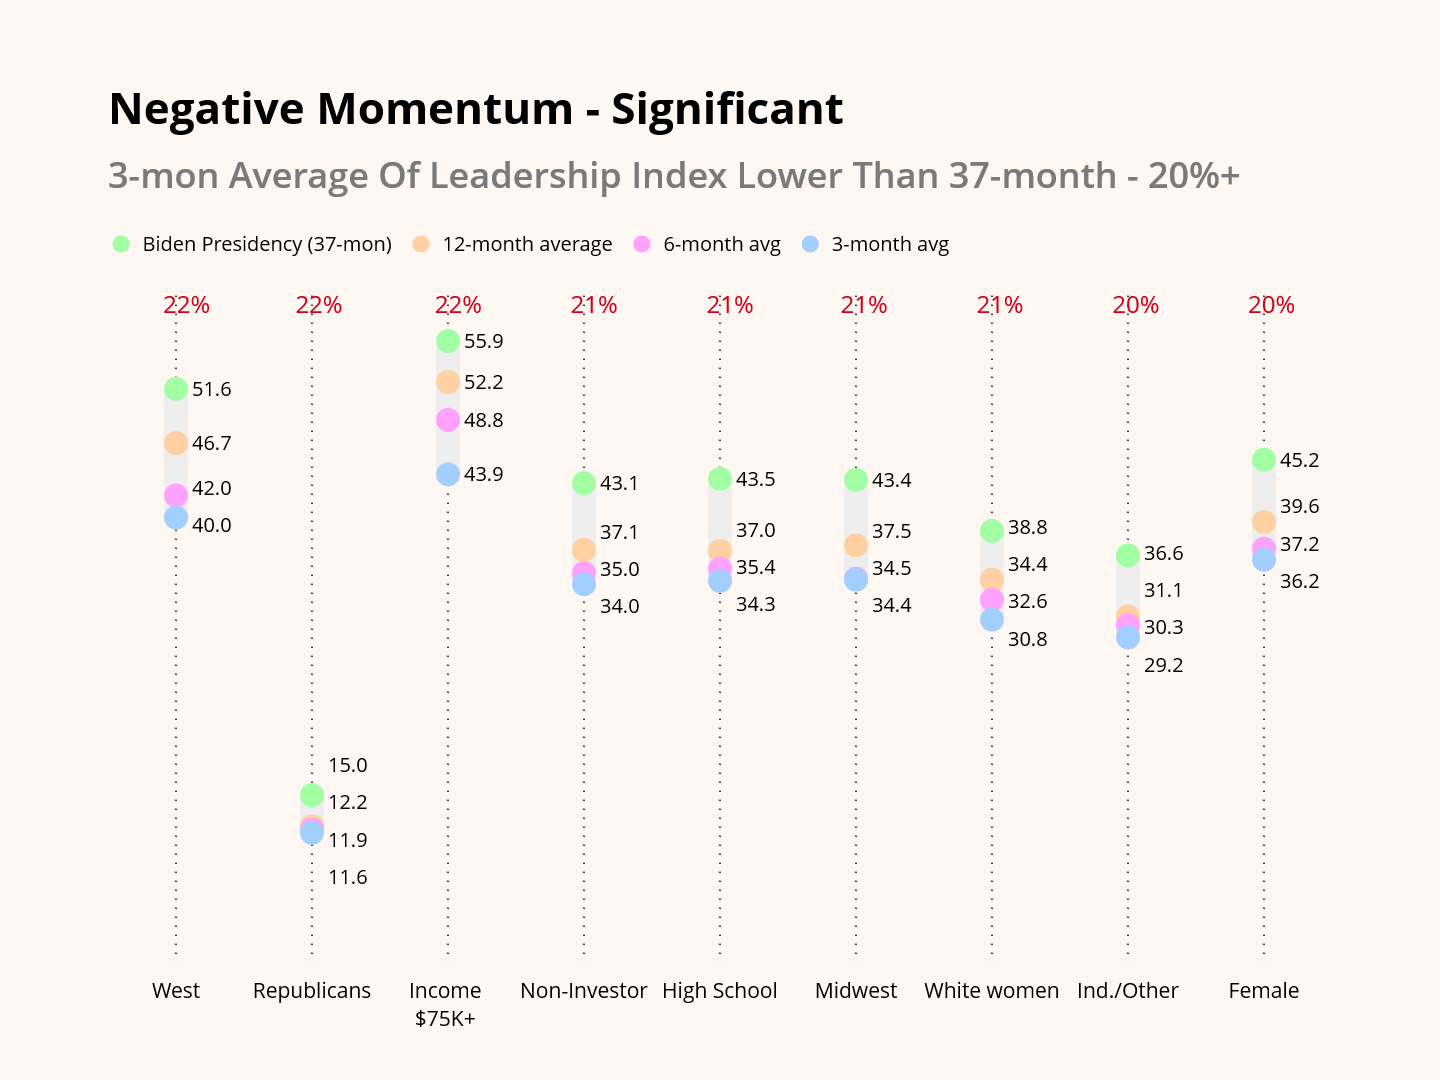
We recently highlighted the disillusionment among the younger age group in our editorial: 18-24-Year-Olds Could Swing 2024 To Trump. Low-income (under $30K) Americans have struggled to cope with the 17% Bidenflation.
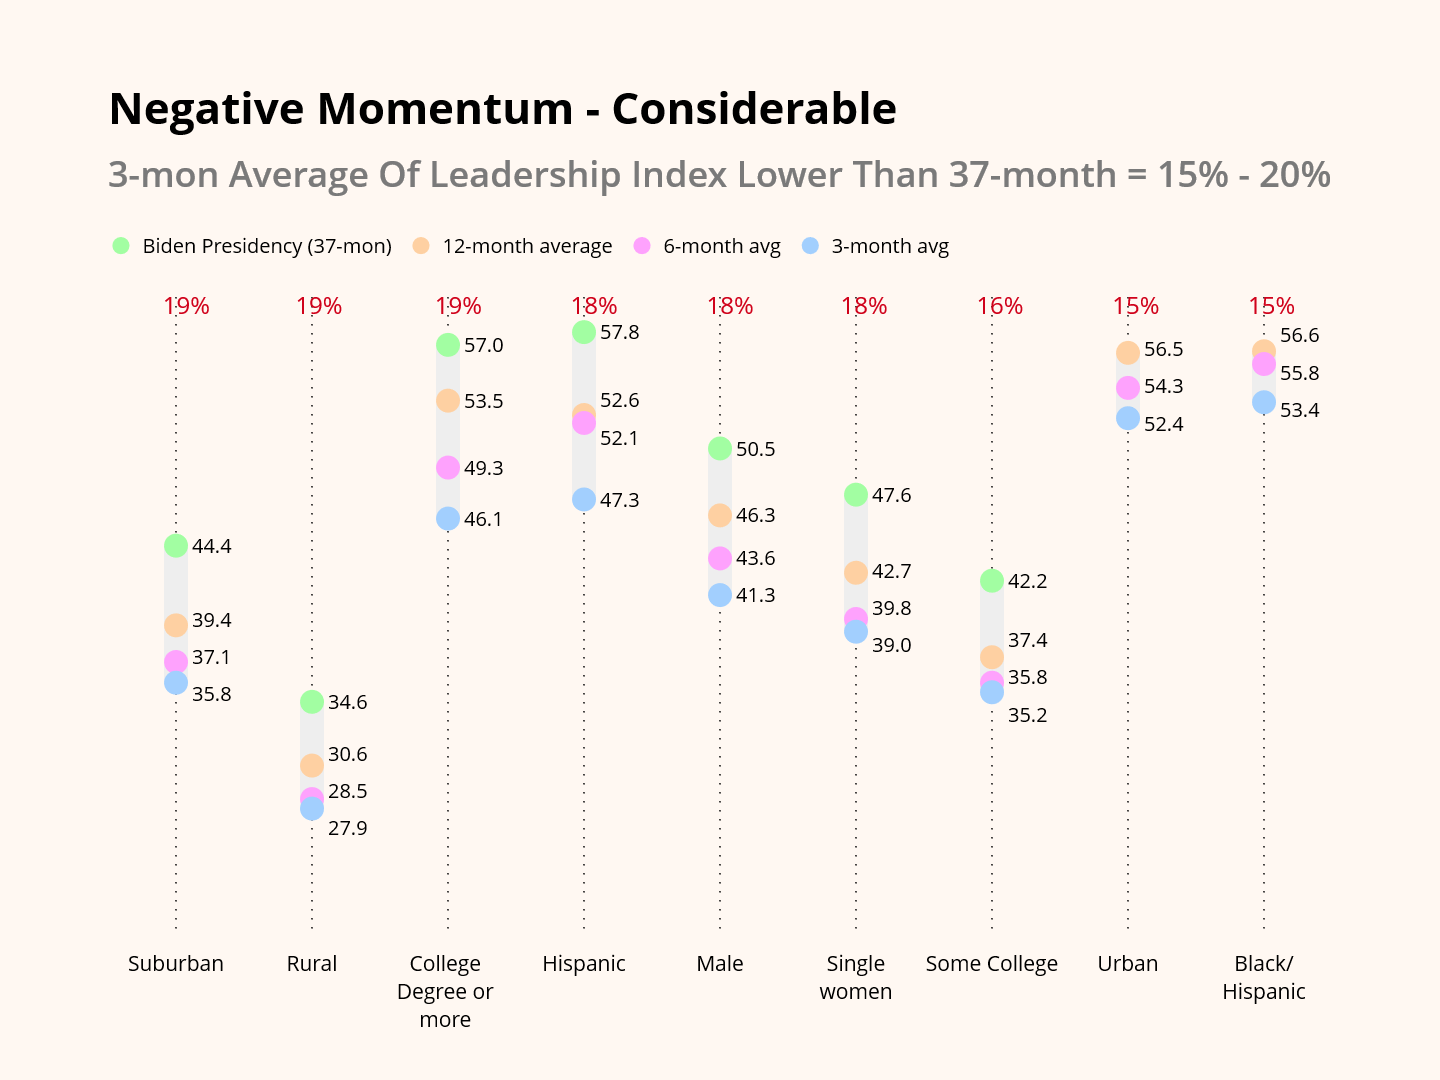
Considerable Negative Momentum
President Biden faces considerable negative momentum among the following nine demographic groups. They all follow the staircase pattern; the negative momentum score is between 15% and 20%.
- Suburban (19%)
- Rural (19%)
- College Degree or more (19%)
- Hispanic (18%)
- Male (18%)
- Single women (18%)
- Some College (16%)
- Urban (15%)
- Black/Hispanic (15%)
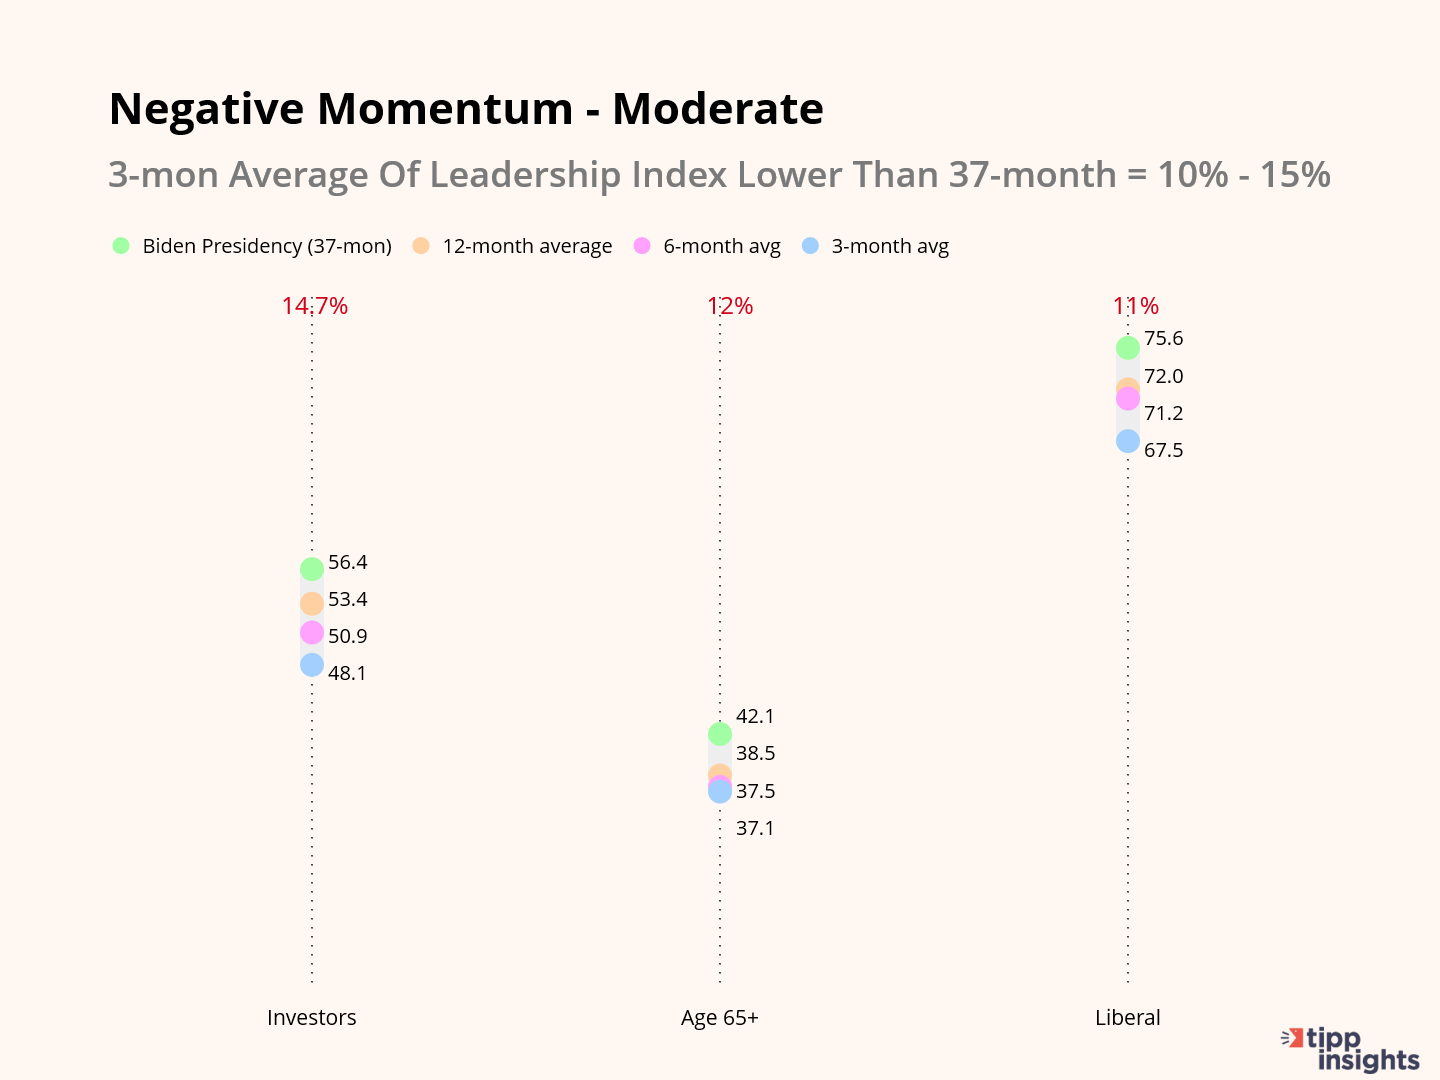
Moderate Negative Momentum
President Biden faces moderate negative momentum among the following three demographic groups. They follow the staircase pattern; the negative momentum score is 10% to 15%. The three groups are:
- Investors (14.7%)
- Age 65+ (12%)
- Liberal (11%)
Mild Negative Momentum
The only group under this category is Democrats, with a negative momentum score of 7.7%. Their 37-month average is 79.9, 12-month 76.4, 6-month 75.9, and 3-months 73.7.
State Of The Race
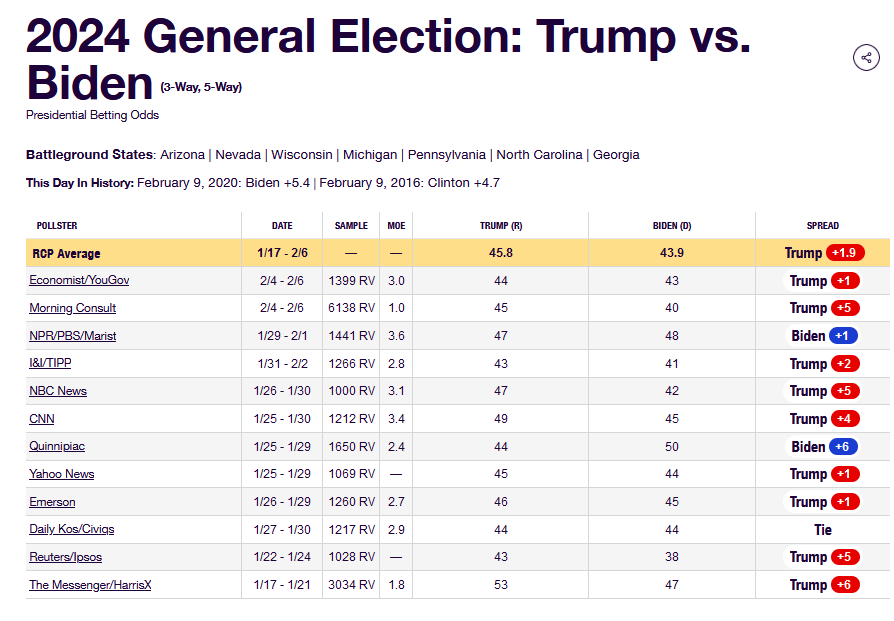
In the recent I&I/TIPP Poll, Trump led by two points within the poll’s margin of error, as noted in the RealClearPolitics dashboard below. Notice that Trump leads in nine polls, Biden two, and one is tied.
Our momentum analysis shows that Biden’s standing among Americans has weakened significantly in the past three months. He faces headwinds among a broad spectrum of Americans. If Biden is the Democratic Party's candidate, the incumbency does not work to his advantage, and the chances of returning to the White House look slim at best.

TIPP Presidential Leadership Index
Unlock the power of the TIPP Presidential Index with an annual license and conduct your own in-depth analysis. Get access today and dive into valuable insights!
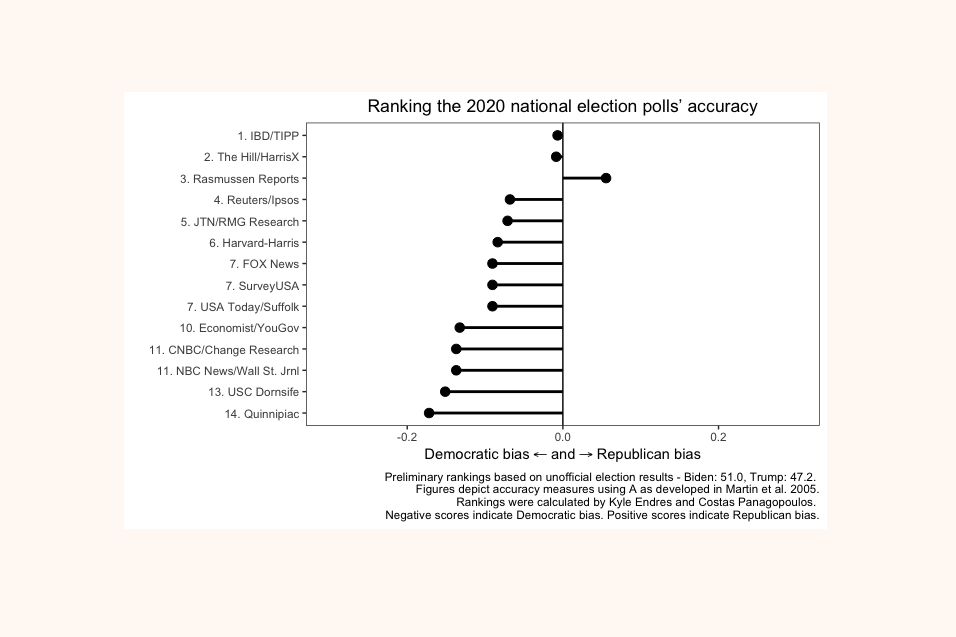
Our performance in 2020 for accuracy as rated by Washington Post:


