
In this article, we examine the leadership of 50 states and the District of Columbia during the pandemic. The basis for comparison is unemployment and death rates.
Our analysis shows that Vermont, Utah, Nebraska, Wisconsin, and New Hampshire emerge as the best on our metrics.
New York is the worst for unemployment and death rates, followed by N.J., Massachusetts, Connecticut, Rhode Island, and Illinois.
We agree that there may be other factors such as population density. But our analysis is limited to the world of the metrics we are using.
First, let us look at it from the standpoint of unemployment.
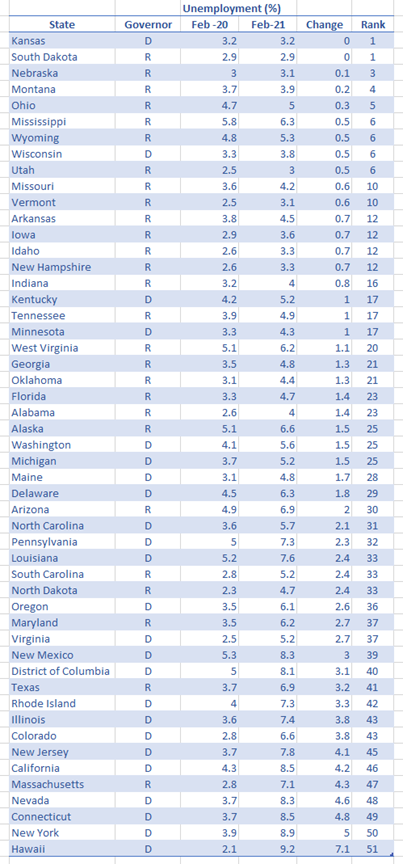
We divided the states into four quadrants based on their pre-pandemic unemployment in February 2020 and February 2021. To define four quadrants, we used the national unemployment rate of 3.5 percent in February 2020 and 6.2 percent in February 2021.
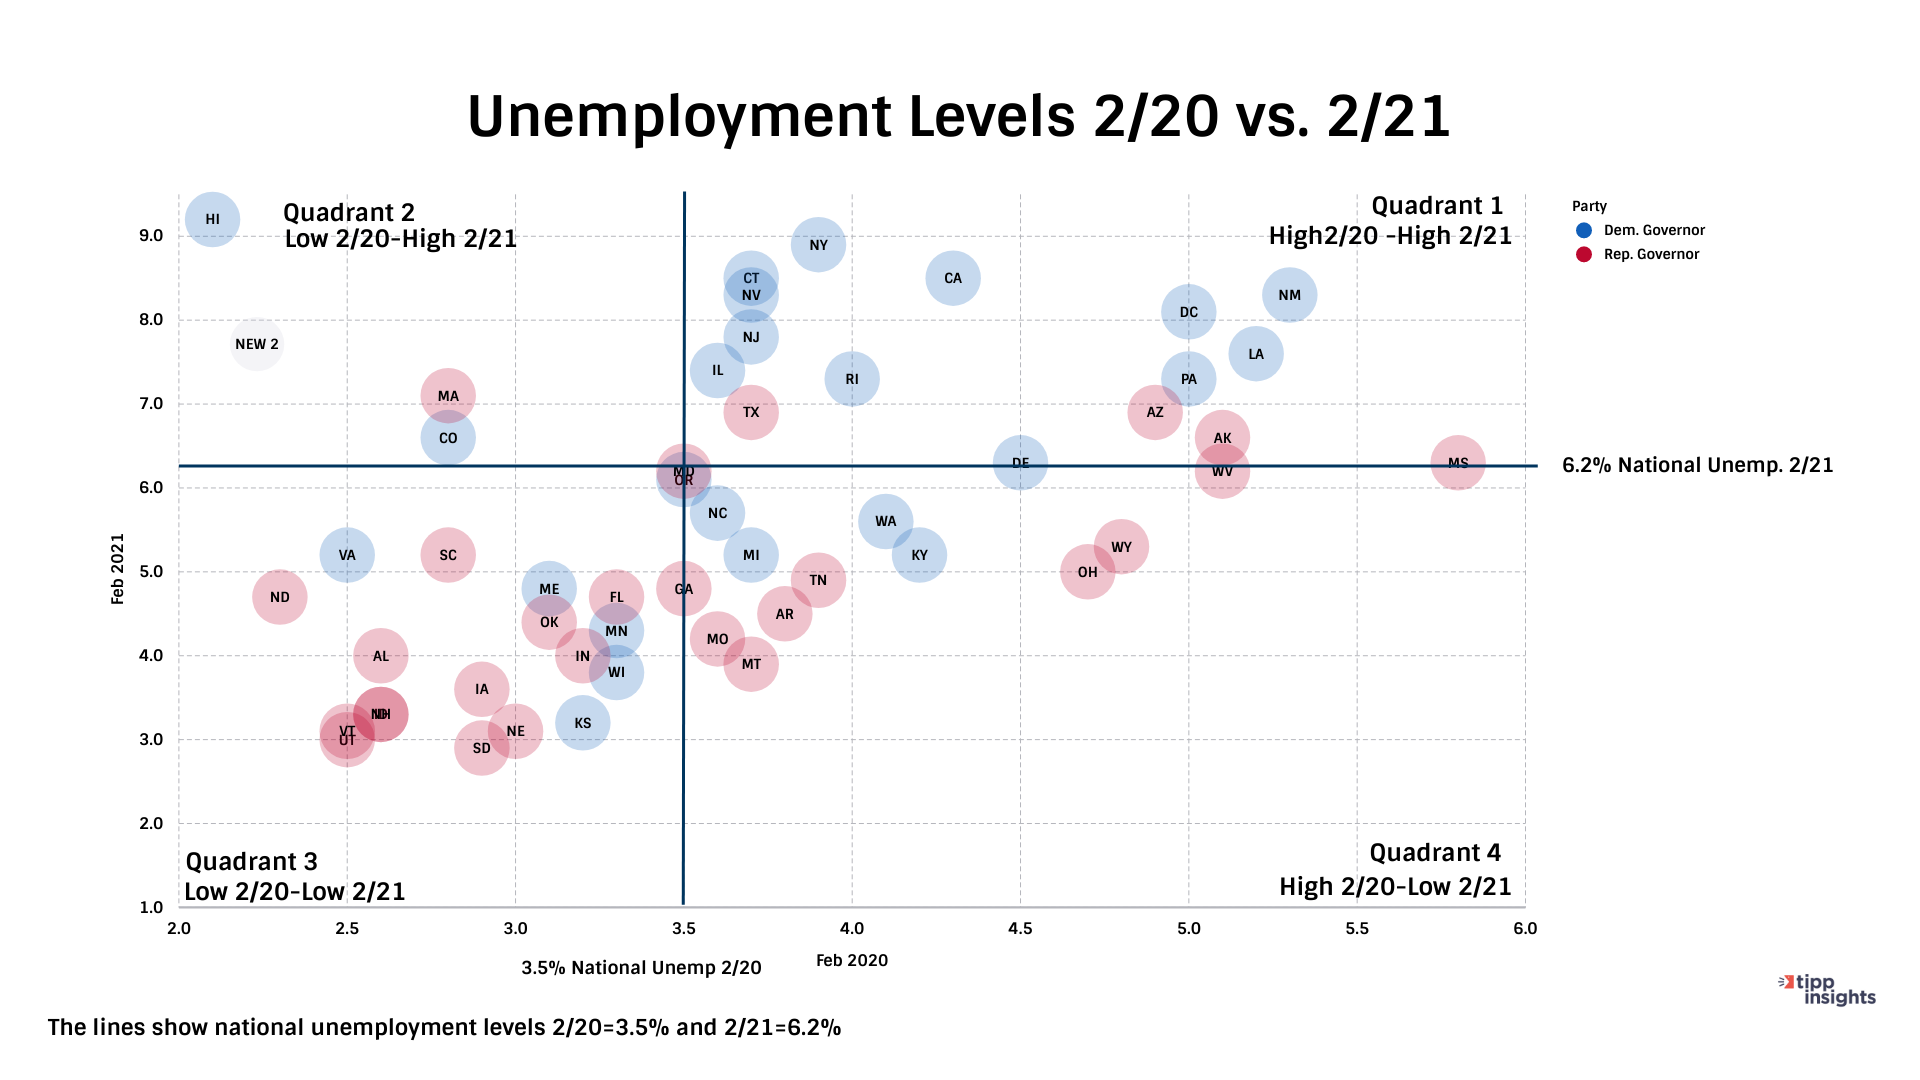
In February 2021, unemployment in Quadrants 1 and 2 was higher than the national average of 6.2 percent.
Quadrant 1 (high unemployment in Feb 2020 and high in Feb 2021)
- It is the worst category and includes seventeen states as well as Washington, D.C.
- Democratic governors govern Delaware, Pennsylvania, Louisiana, New Mexico, Rhode Island, Illinois, New Jersey, California, Nevada, Connecticut, and New York, and the District of Columbia has a Democratic mayor.
- Republicans control six states in this category: Mississippi, West Virginia, Alaska, Arizona, Maryland, and Texas.
Quadrant 2 (low unemployment in Feb 2020 and high in Feb 2021)
- Three states are in this quadrant. Hawaii and Colorado are Democratic states, and Massachusetts has a Republican governor.
- The lack of tourism has Hawaii caused its unemployment to rocket from 2.1% to 9.2%.
Quadrant 3 and Quadrant 4 in February 2021 had unemployment below the national level of 6.2%.
Quadrant 3 (low unemployment in Feb 2020 and low in Feb 2021)
- It is the best category and eighteen states are in this quadrant.
- Democrats govern six states in this category: Kansas, Wisconsin, Minnesota, Maine, and Virginia.
- The 12 states with Republican governors are South Dakota, Nebraska, Utah, Vermont, Iowa, Idaho, New Hampshire, Indiana, Oklahoma, Florida, Alabama, South Carolina, and North Dakota.
- South Dakota and Kansas deserve credit for achieving a zero percentage point change in unemployment.
Quadrant 4 (higher than national unemployment in Feb 2020 and lower than national in Feb 2021)
Democrats govern the five states (Kentucky, Washington, Michigan, North Carolina, and Oregon) in this category, Republicans control seven (Montana, Ohio, Wyoming, Missouri, Arkansas, Tennessee, and Georgia).
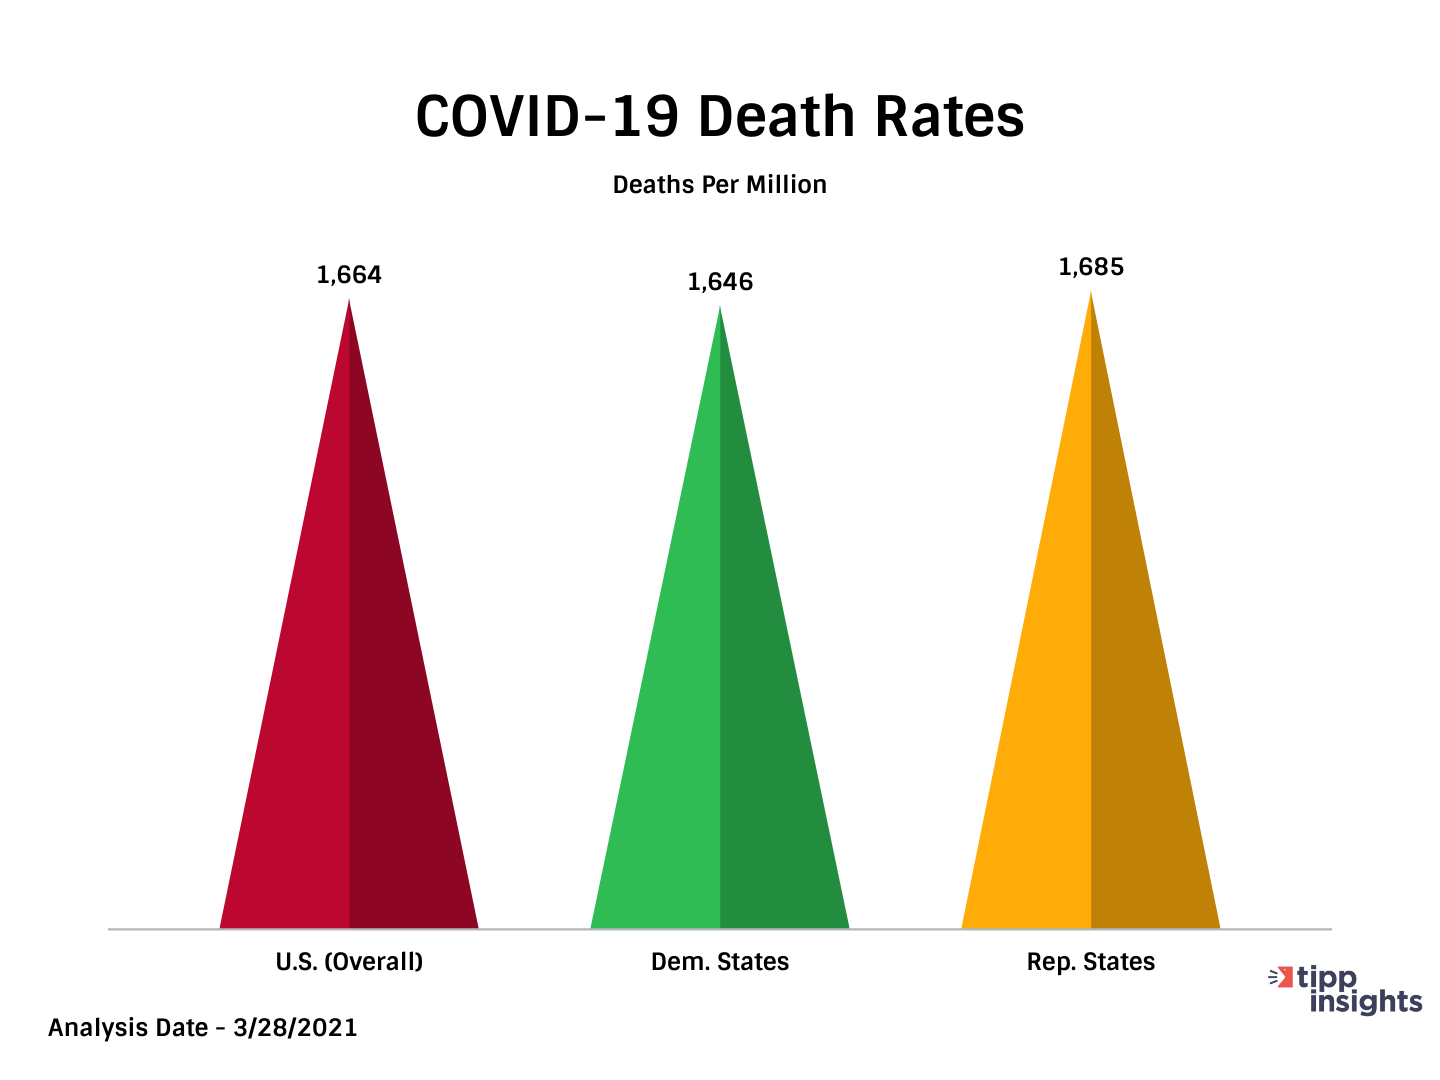
Death Rates
The death rate is a measure of leadership in the pandemic's management.
The overall death rate in the United States is 1,664 per million people, with Democratic-controlled states having a rate of 1,646 and Republican-controlled states having a rate of 1,685.
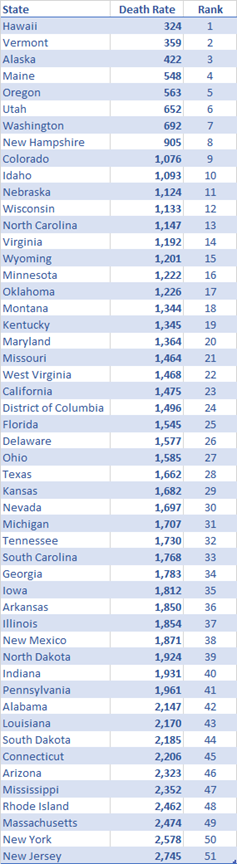
Using the death rates, we ranked states and DC from 1 to 51. Being number 1 in this listing indicates the lowest death rate per million or the best performance.
The states with the lowest death rates are Hawaii (324), Vermont (359), Alaska (422), Maine (548), and Oregon (563).
New Jersey (2,745), New York (2,578), Massachusetts (2,474), Rhode Island (2,462), and Mississippi (2,352) have the highest death rates.
Unemployment and Death Rates Combined
The chart below combines unemployment and death rates. On the horizontal axis is the rank of unemployment change ( 1 to 51) between February 2020 and February 2021. The vertical axis is the rank for death rate from 1 to 51. The size of the bubbles in the chart is proportional to the state's death rate.
The states in the third quadrant are the best. Vermont, Utah, Nebraska, Wisconsin, and New Hampshire emerge as the best on our metrics.
New York is the worst for unemployment and death rates, followed by N.J., Massachusetts, Connecticut, Rhode Island, and Illinois.
Of course, we acknowledge that there are other factors to consider, such as population density, the timing of infection spread, the availability of PPE, and so on. Our analysis has a limitation in that it only considers two dimensions.


