
Of the 21 demographic groups the RCM/TIPP Economic Optimism Index tracks each month, spanning age, gender, race, income, party, and investor status, 20 declined in April. Only independents bucked the trend by a barely perceptible 0.2 points.
It was the most sweeping downturn the Index has registered in months, and it arrived amid escalating U.S.–Iran tensions that have unsettled Americans regardless of where they sit on the political, economic, or generational spectrum.
The RealClearMarkets/TIPP Economic Optimism Index, the first monthly read on U.S. consumer confidence, fell from 47.5 in March to 42.8 in April, a 4.7-point drop, or 9.9%. The Index has now stayed below the neutral 50 mark for eight consecutive months, keeping the nation firmly in the pessimistic zone.
April’s reading of 42.8 sits 12.8% below the 303-month historical average of 49.1 and lands in the bottom 12% of all readings since tracking began in February 2001. Among the 302 month-over-month changes on record, the 4.7-point decline ranks in the top 6%, placing it in the company of shock-driven drops that followed Hurricane Katrina in September 2005 (–9.7 points), the onset of COVID in March 2020 (–5.9), and the October 2013 government shutdown (–7.6).
Geopolitical crises have left their mark on this dataset. They hit hard, they hit fast, and they hit across party lines. The April 2026 decline fits that mold.
The Components: All Three Declined
The RCM/TIPP Economic Optimism Index is the first monthly measure of consumer confidence. It has established a strong track record of foreshadowing the confidence indicators issued later each month by the University of Michigan and The Conference Board. (From February 2001 to October 2023, TIPP released this monthly Index in collaboration with its former sponsor and media partner, Investor’s Business Daily.)
RCM/TIPP surveyed 1,464 adults for the April Index from March 31 to April 2. The online survey was conducted using TIPP’s panel network. Results range from 0–100, with readings above 50 indicating optimism, below 50 signaling pessimism, and 50 indicating neutrality.
The Index has three key components. In April, all three fell, and the declines were not subtle.
Confidence in Federal Economic Policies, a proprietary RCM/TIPP measure of views on the effectiveness of government economic policies, took the hardest hit, tumbling to 39.8 from 45.1 in March — an 11.8% drop. With the administration navigating a military confrontation in the Middle East alongside rising energy costs at home, Americans’ faith in the policy apparatus is eroding.
The Six-Month Economic Outlook, which measures consumers’ perception of the economy’s prospects over the next six months, fell 10.5%, from 43.0 in March to 38.5 in April. This is the component most sensitive to forward-looking anxiety and reflects current trepidation.
The Personal Financial Outlook, a measure of how Americans feel about their own finances over the next six months, dropped 7.6% from 54.3 in March to 50.2 — barely clinging to the neutral line. For months, personal finances had been the lone bright spot, holding comfortably above 50 even as the other two components flagged. That cushion is now razor-thin.
Explore the data in real time: Track the RCM/TIPP Economic Optimism Index on RealClearMarkets. View monthly trends, compare components, and analyze shifts across demographics.
Party Dynamics: A Rare Bipartisan Decline
One of the most telling features of April’s data is that the decline cut across party lines, a hallmark of event-driven downturns.
Republicans dropped 5.2 points to 62.4, their lowest reading since November 2025. Democrats plunged to 26.6, the lowest level of the Trump-47 administration. Independents, who had briefly shown signs of hope in February at 45.4, settled at 36.9.
The Democrat–Republican gap stands at 35.8 points, enormous by any measure. But the notable story this month is not the gap; it’s the direction. Both sides moved down together. When Katrina hit in 2005, when COVID arrived in 2020, and when the government shut down in 2013, the pattern was the same: external shocks suppressed confidence across the board. April 2026 follows that pattern.
For context, President Trump’s 15-month average of 48.2 still sits above President Biden’s full-term average of 45.4, though well below President Trump’s first-term average of 53.1 — a reflection of the headwinds this administration has faced - from inflation’s aftermath to the latest geopolitical conflict.
Investor Confidence: Nowhere to Hide
Respondents are considered “investors” if they currently have at least $10,000 invested in the stock market, either personally or jointly with a spouse, directly or through a retirement plan. Thirty-four percent of respondents met this criterion; 61% were classified as non-investors.
Investor confidence fell 11.1% (6.6 points) to 53.0 in April, its lowest reading in 12 months, while non-investor confidence dropped 7.8% (3.2 points) to 37.8. The confidence gap shrank from 18.6 to 15.2 points. But the gap closed from the top down, not the bottom up. Investors fell faster.
For much of the past year, investors had remained comfortably in optimistic territory, buoyed by market performance and personal portfolio gains. April’s plunge suggests that the geopolitical uncertainty and perhaps the market volatility have pierced even the most financially insulated segment of the population.
Demographic Analysis: The Optimism Map Is Nearly Empty
Only three of the 21 demographic groups we track are in positive territory this month, with scores above 50: adults ages 25–44 (52.3), Republicans (62.4), and investors (53.0). For comparison, there were six in March, eight in February, and seven groups in January. In the immediate aftermath of the November 2024 election, 18 of the 21 groups had been optimistic, a reflection of the post-election surge that has now almost entirely evaporated.
Just one group improved month-over-month — independents, who edged up a statistically negligible 0.2 points compared to seven in March, 18 in February, and nine in January.
The declines were steepest among groups that might seem to have little in common. Young adults ages 18–24 cratered 15.2 points, from 52.0 to 36.8, the single largest decline of any group. Seniors (aged 65+) fell 9.5 points to 34.5, their most pessimistic reading in recent memory. Democrats dropped 8.4 points. Households earning $75,000 or more, typically the most confident income cohort, fell 8.0 points to 48.6, slipping below the neutral line for the first time in over a year.
The breadth of the decline underscores that this is not a story about one anxious corner of the population. It is the national mood.
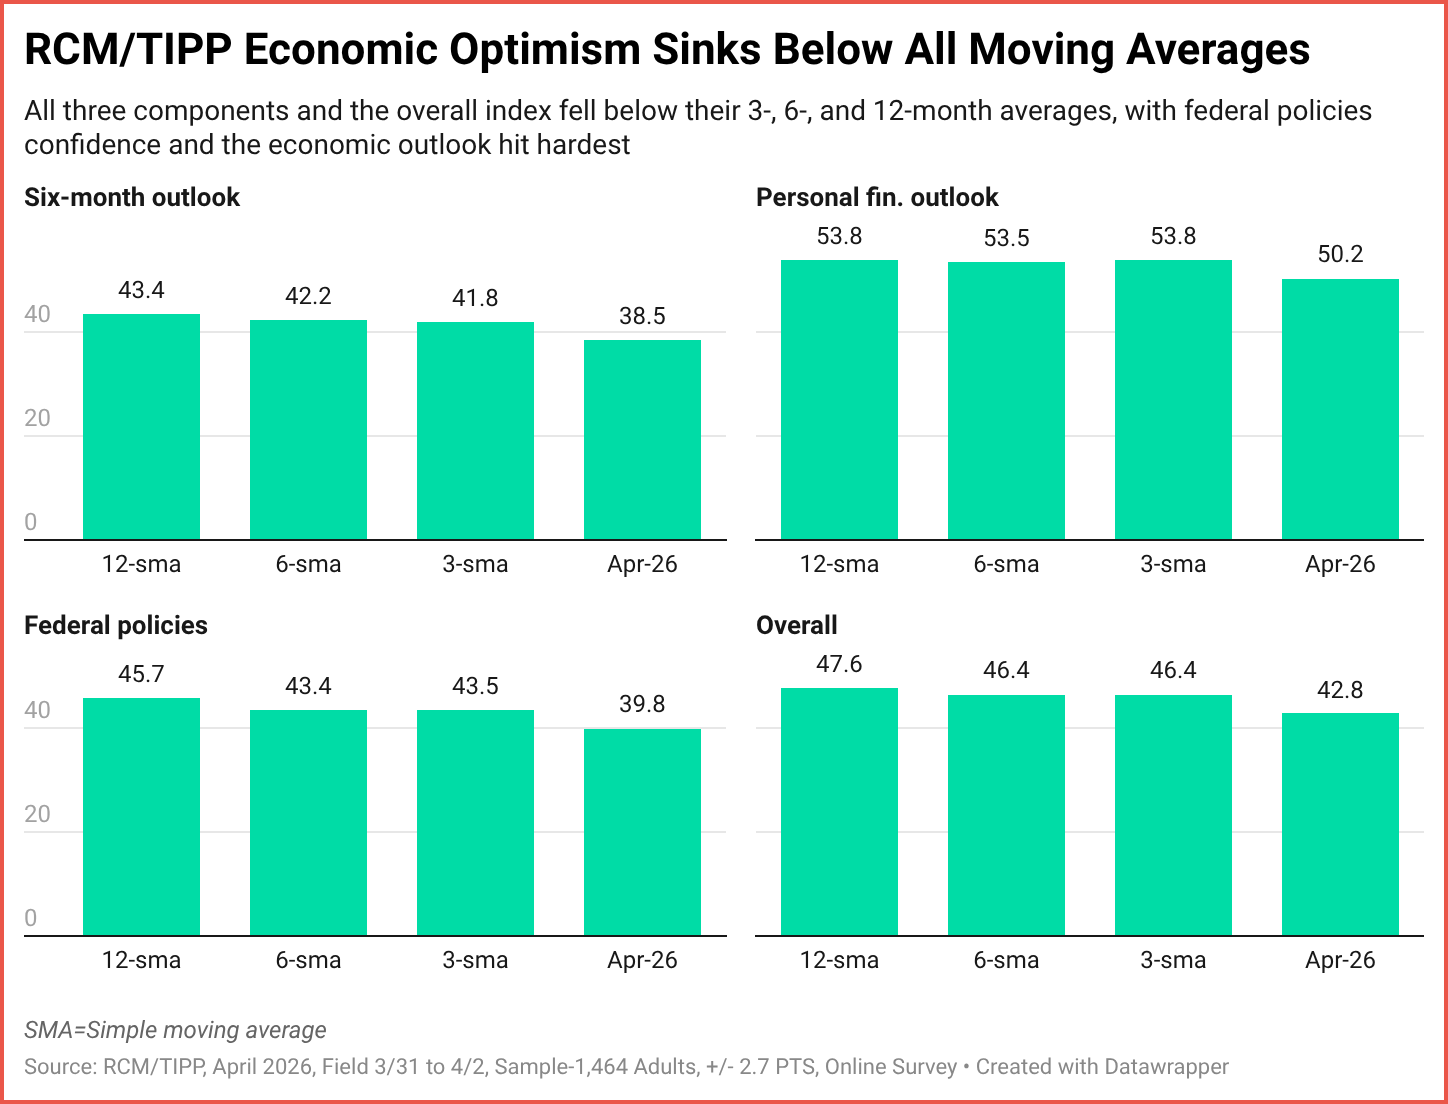
Momentum: Reversal
The RCM/TIPP Economic Optimism Index dropped to 42.8 in April, falling below its three-month average (46.4), six-month average (46.4), and twelve-month average (47.6). As recently as February, the Index had been tracking above all three benchmarks, suggesting that a fragile recovery was taking shape. That recovery has now been interrupted.
The Six-Month Outlook fell to 38.5, below its three-month (41.8), six-month (42.2), and twelve-month (43.4) averages, the weakest positioning among the components.
Personal Financial Outlook, at 50.2, sits below its three-month (53.8), six-month (53.5), and twelve-month (53.8) averages for the first time in the current cycle.
Confidence in Federal Policies, at 39.8, dropped below its three-month (43.5), six-month (43.4), and twelve-month (45.7) averages — underscoring the toll that geopolitical uncertainty has taken on public confidence in economic stewardship.
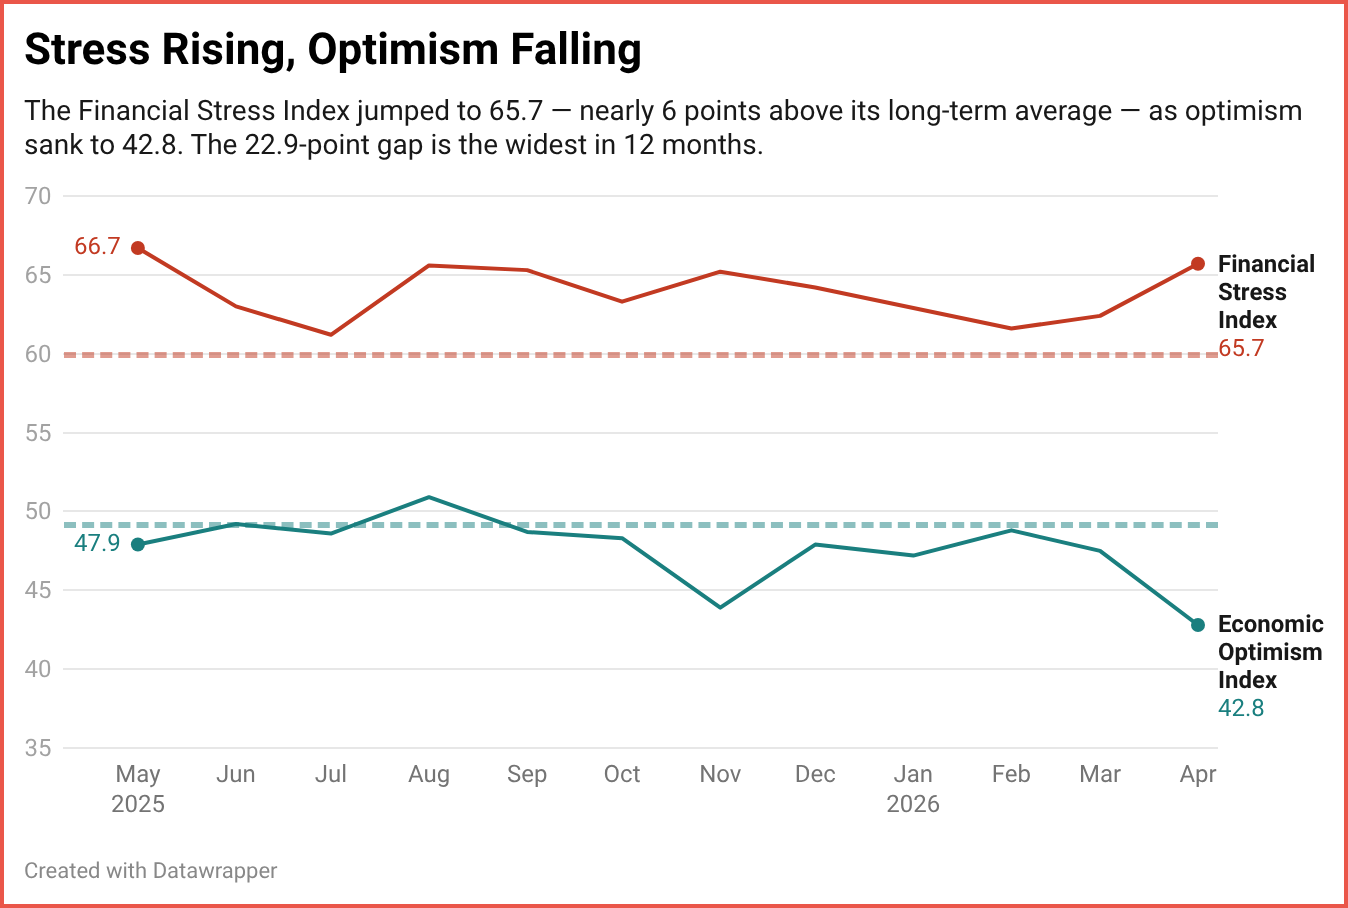
Financial Stress: The Other Side of the Coin
RCM/TIPP also releases a companion index, the RCM/TIPP Financial-Related Stress Index — the only metric that tracks Americans’ financial stress on a monthly basis. The higher the number, the more stress. Readings above 50 signal increased stress; those below 50 indicate lower stress.
The Stress Index rose 3.3 points (5.3%) from 62.4 in March to 65.7 in April, signaling a sharp increase in financial strain. This reading exceeds the long-term average of 60.5 by 8.6%. The last time the Index posted below 50.0 was before the onset of the pandemic in February 2020, when it stood at 48.1.
The 22.9-point gap between the Stress Index (65.7) and the Optimism Index (42.8) is the widest in 12 months. Americans are not just less hopeful about the economy; they are equally anxious—if not more worried—about their finances. And that is not good news for the incumbents in the wake of the midterms.
RealClearMarkets will release the next report at 10 a.m. EST on Tuesday, May 5.
Catch up on the latest highlights, handpicked by the News Editor at TIPP Insights.
1. Why Is Iran Pushing Rial Payments In Hormuz
2. Bombardment Casts Doubt On Israel-Lebanon Negotiations
3. Iran Sets Conditions For Talks With U.S.
4. China Warns Against Taiwan Independence
5. China, North Korea Deepen Ties Amid Global Tensions
6. How Does China's Transport Aircraft Y-30 Compare To U.S. C-130
7. UN Warns Of Growing Humanitarian Crisis As Israel Bombards Lebanon
8. Why Are Chinese Firms Worried About Hungary's Elections
9. Iran Denies Ceasefire Breach Amid Gulf Attack Claims
10. Mythos AI Sparks Cybersecurity Talks In Washington
11. Strait Closure Keeps Oil Markets On Edge
12. U.S. Inflation Hits Two-Year High As Gas Prices Surge
14. How Is The Iran War Impacting Consumer Confidence
editor-tippinsights@technometrica.com


