
Warning: If you believe the economy is hunky-dory, please skip this article.
Bidenomics is a complete and utter failure that has led to stagflation in the United States. No amount of sugarcoating can hide the truth. Americans are struggling with high prices. You need $1,000 in earnings today to buy what $862 could buy when Biden took office. Alternatively, if you needed $50K yearly for household expenses before Biden took office, you now need $58K.
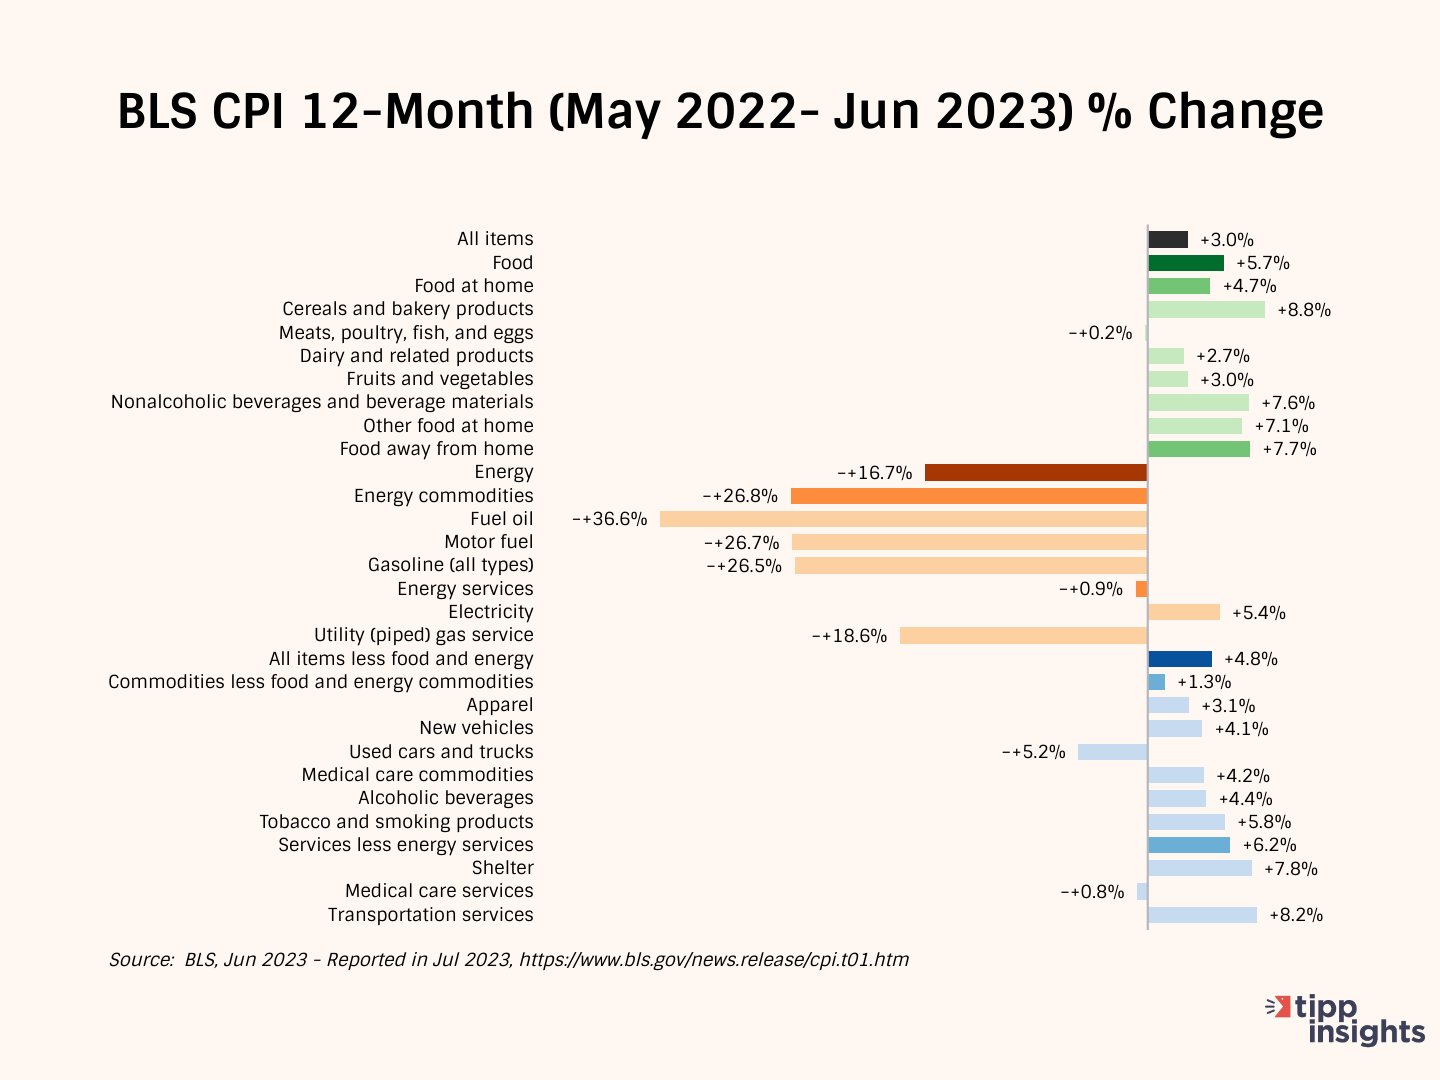
The Consumer Price Index (CPI) released by the government last Wednesday showed a 3.0% year-over-year increase in prices from June 2022 to June 2023, declining from a rate of 4.0% in May, 4.9% in April, 5.0% in March, and 6.0% in February. The CPI rate has declined steadily from a 40-year high of 9.1% in June 2022 to 3.0% in June 2023. However, the CPI rose 0.2% last month after adjusting for seasonality and 0.3% on an unadjusted basis.
Following the CPI release, a media headline read:
U.S. economy shifts into disinflation mode; consumer prices rise modestly
Wow! Disinflation mode? We wondered if the headline writer deliberately wants readers to think of deflation (negative inflation or actual price decreases). Disinflation means a decrease in the inflation rate, while deflation means actual price decreases.
Few media outlets provided context, partly because doing so would place the Biden administration in a terrible light, which does not fit the narrative. But numbers do not lie, so we are happy to oblige and fill in the gaps.
Our conclusion: The Biden economy continues to be the worst-performing going back to President Carter. Since February 2021, the first full month of President Biden's term, the prices of various commodities, including food, gasoline, used cars, and air tickets, have consistently increased. Although the rate of increase has slowed, prices are still rising monthly.
As we have noted numerous times, President Biden's reckless spending has resulted in inflation levels not seen for 40 years. The U.S. economy will experience an extended period of stagflation characterized by a recession and inflation.
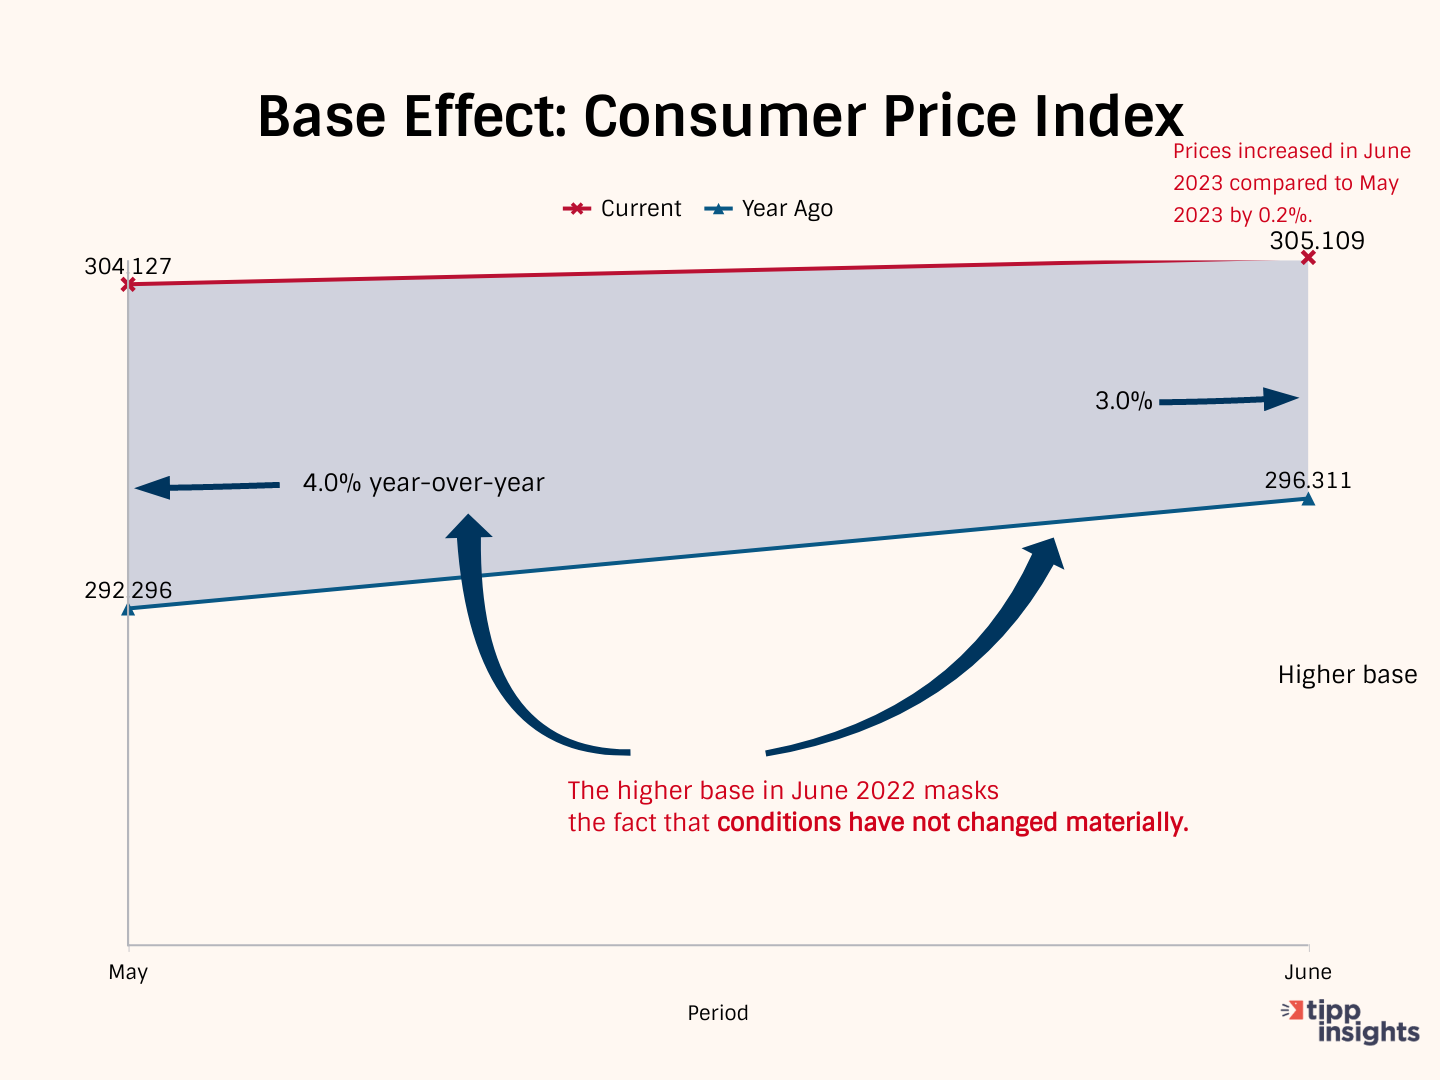
The CPI inflation rate measures how much more expensive things are getting over time. The government calculates the increase in the CPI rate over 12 months, so the base for June 2023 is June 2022, and for May 2023 is May 2022.
In June 2023, the CPI index was 305.109, 3.0% higher than its base of 296.311 for June 2022. And in May 2023, the CPI index was 304.127, 4.0% higher than its base of 292.296 for May 2022.
Between May 2022 and June 2022, the base increased sharply by 4.015 points or 1.37%. Even though the CPI index increased by 0.2% between May and June 2023, the headline CPI rate dropped from 4.0% to 3.0% because of the "base effect."
In other words, the rate seemed lower than it actually was because the base was higher in June 2022. Things were getting more expensive but more expensive at a slower rate than the previous year. Only in Washington is this good news.
TIPP CPI
The White House press release stated: The June Consumer Price Index: Disinflation, Deflation, and Buying Power in the U.S. Economy.
Ultimate irony! The statement's first paragraph had a sentence: "Since monthly data can be noisy and obscure underlying trends, economists often look at inflation over longer periods as well."
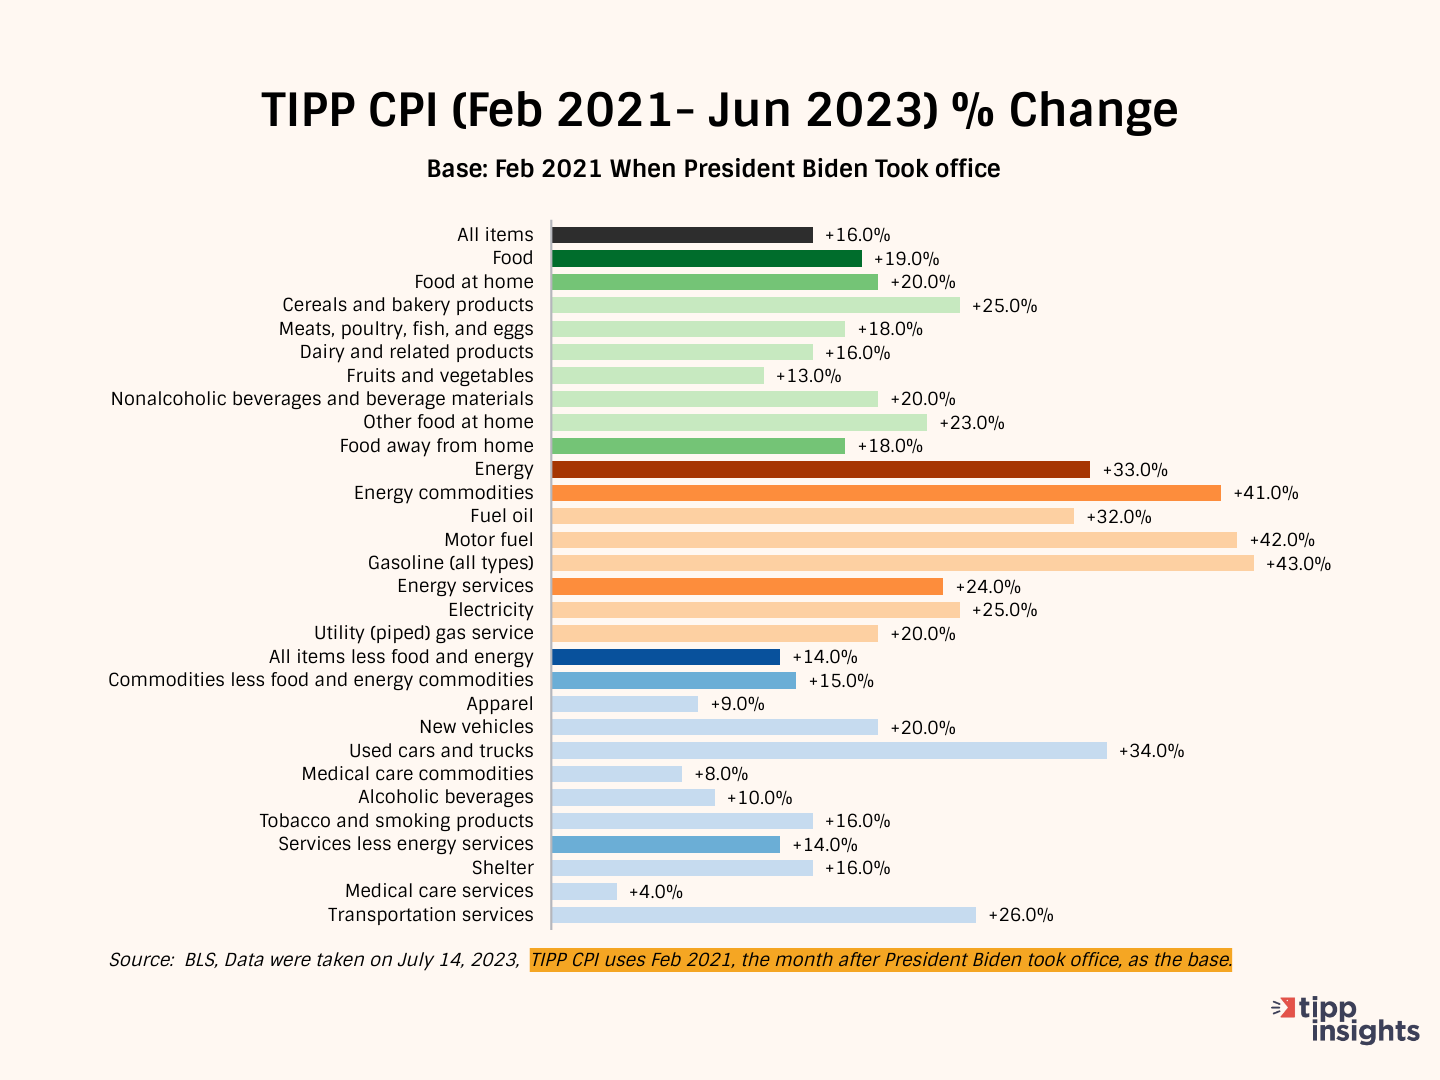
Well, we developed the TIPP CPI, a metric that uses February 2021, the month after President Biden's inauguration, as its base. We measure the rate of change in the economy from this base. All TIPP CPI measures are anchored to the base month of February 2021, making it exclusive to the economy under President Biden's watch.
We use the relevant data from the Bureau of Labor Statistics (BLS) to calculate the TIPP CPI, but we adjust the period to Biden's tenure. CPIs are like index numbers that show how prices affect people's lives, similar to how the Dow Jones Industrial Average reflects the stock market.
When discussing the TIPP CPI and the BLS CPI, we convert the index numbers into percentage changes to better understand and compare them.
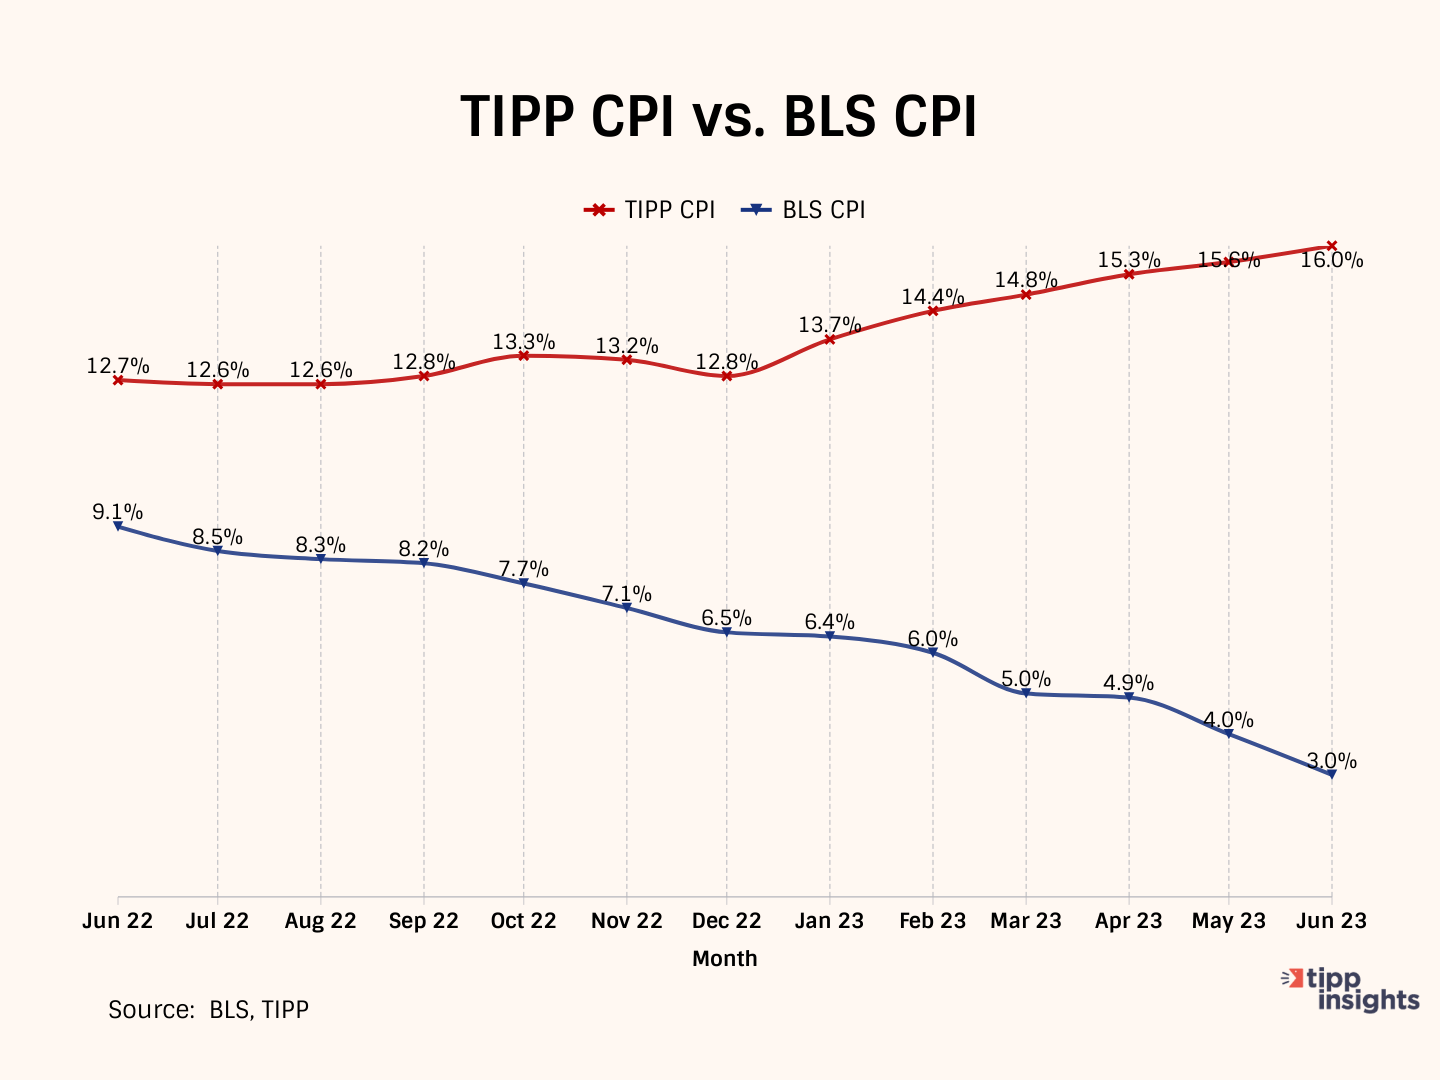
Bidenflation, as measured by the TIPP CPI using the same underlying data, reached 16.0% in June. It was 15.9% in May, 15.3% in April, and 14.8% in March 2023.
By the middle of 2022, significant inflation had already taken hold. In May 2022, CPI inflation stood at 8.6 percent. While the official BLS CPI year-over-year increases will compare prices to already inflated bases in the coming months, these statistics might mask the full impact. Americans continue to feel the effects of inflation and face challenges with their expenses.
TIPP CPI vs. BLS CPI
The following four charts present details about the new metric.
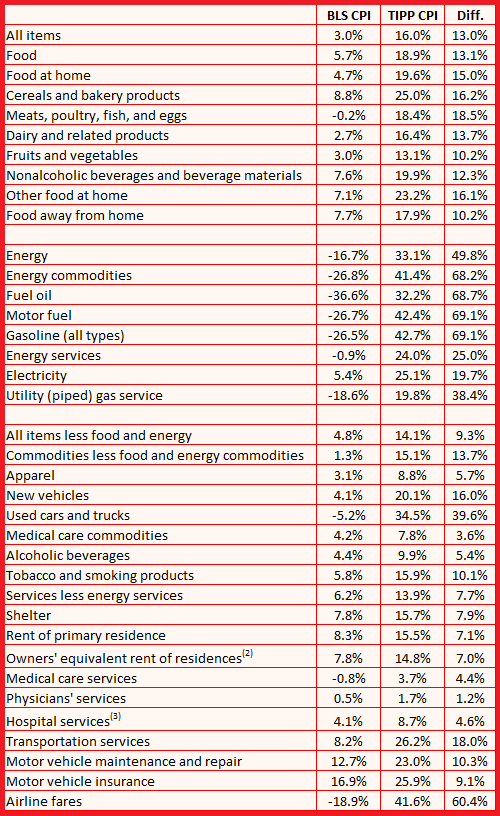
The annual CPI increase reported by BLS is 3.0% for June 2023. Compare this to the TIPP CPI of 16.0%, a 13.0-point difference. Prices have increased by 16.0% since President Biden took office. On an annualized basis, TIPP CPI is 6.6%.
Food prices increased by 18.9% under Biden compared to only 5.7% as per BLS CPI, a difference of 13.1 points.
TIPP CPI data show that Energy prices increased by 33.1%. But, according to the BLS CPI, energy prices declined by 16.7%. The difference between the two is a whopping 49.8 points.
The Core CPI is the price increase for all items, excluding food and energy. The Core TIPP CPI was 14.1% compared to 4.8% BLS CPI in the year-over-year measure, a 9.3-point difference.
Further, Gasoline prices have increased by 42.7% since President Biden took office, whereas the BLS CPI shows that gasoline price has improved by 26.5%, a difference of 69.1 points.
Used car prices have risen by 34.5% during President Biden's term. The BLS CPI shows that the prices have dropped by 5.2%, a difference of 39.6 points.
Inflation for air tickets under President Biden is 41.6% compared to the BLS CPI’s finding of improvement of 18.9%, a difference of 60.4 points.
Americans' Concerns
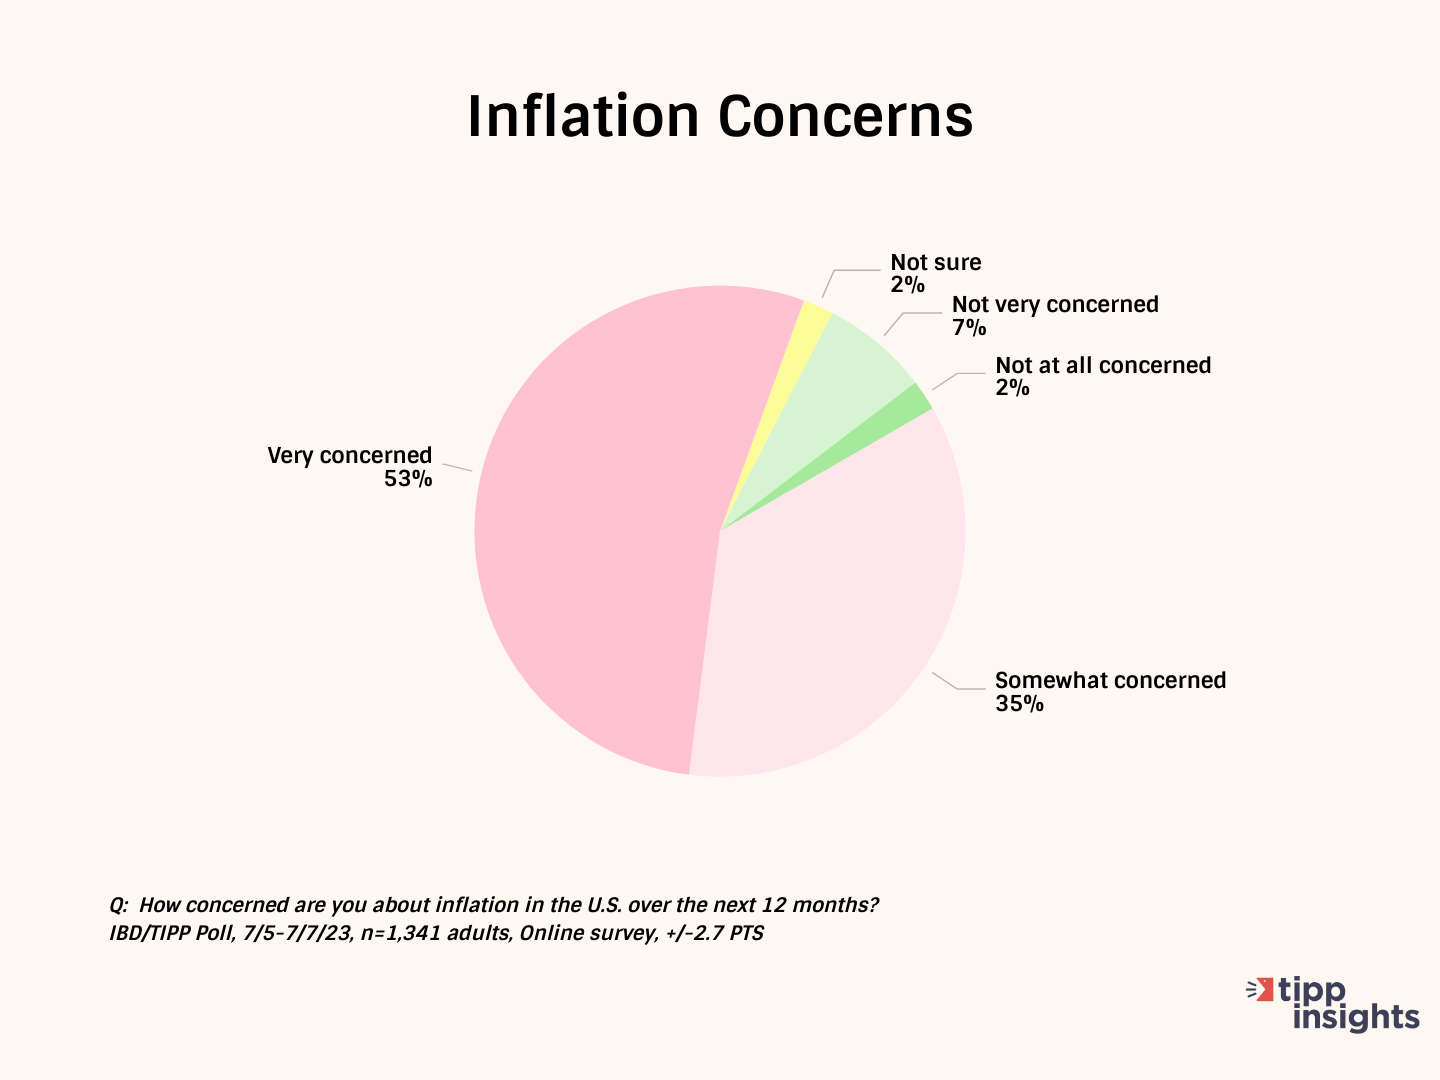
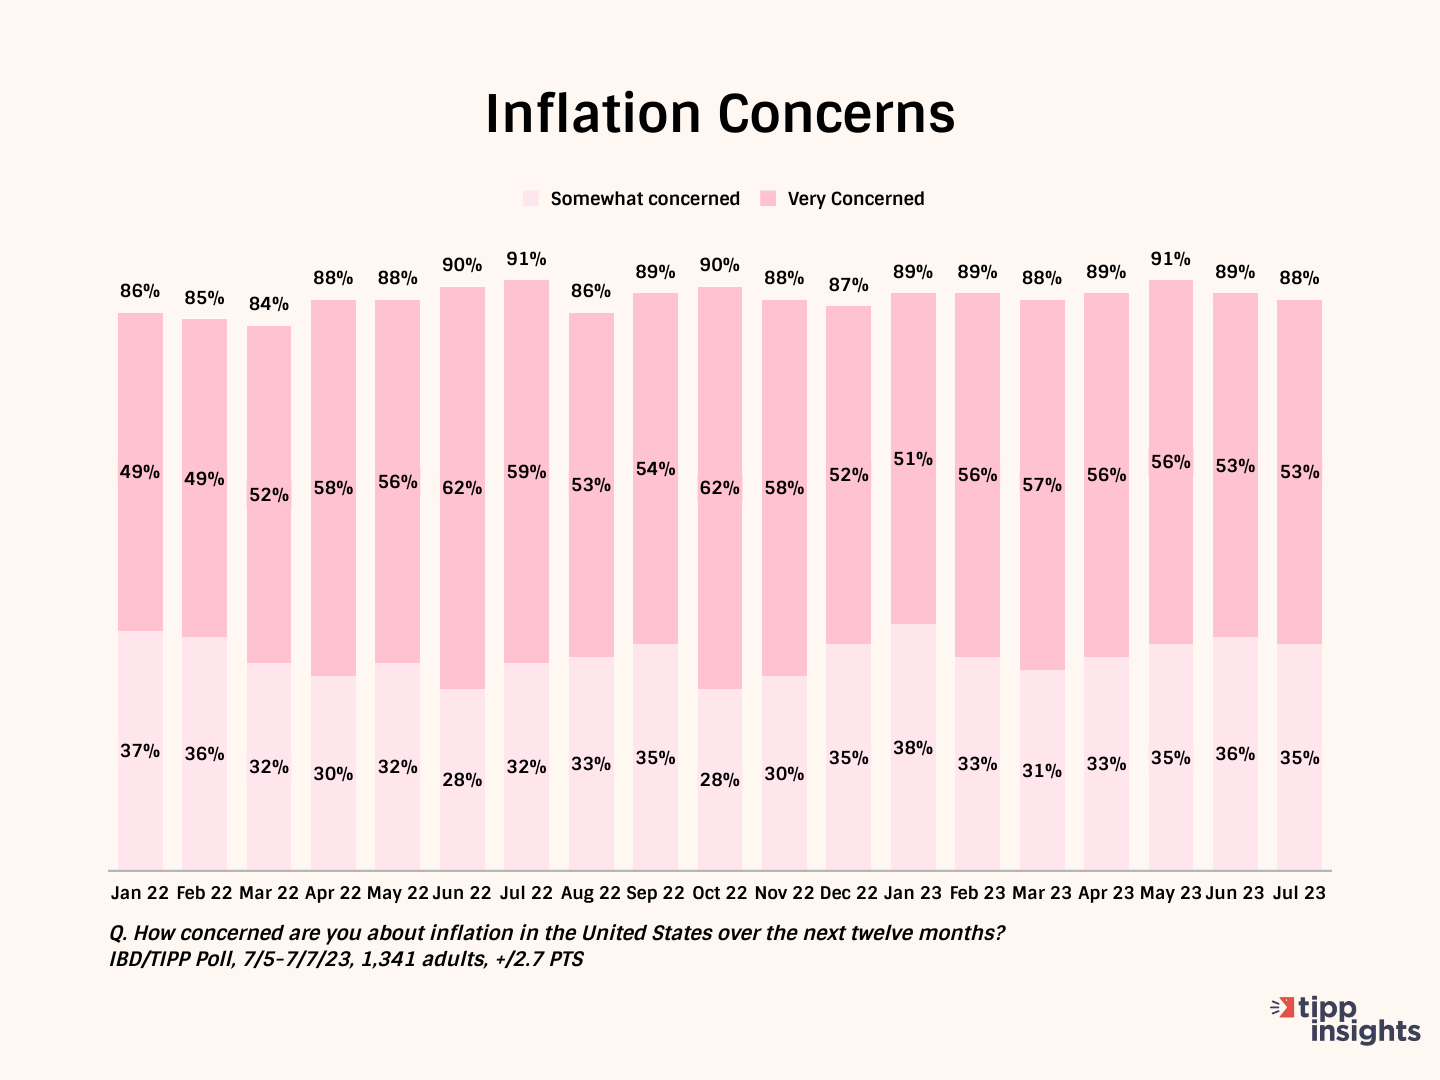
The latest Investor's Business Daily/TIPP Poll, completed earlier this month, shows nine in ten (88%in July, 89% in June) survey respondents are concerned about inflation. Throughout the past year, inflation concerns have stayed above 85%. The "very concerned" share has been over 50% for seventeen consecutive months.
Over half (55%, 52% in May) say their wages have not kept up with inflation. Only 20% (23% in May) say their income has kept pace with inflation.
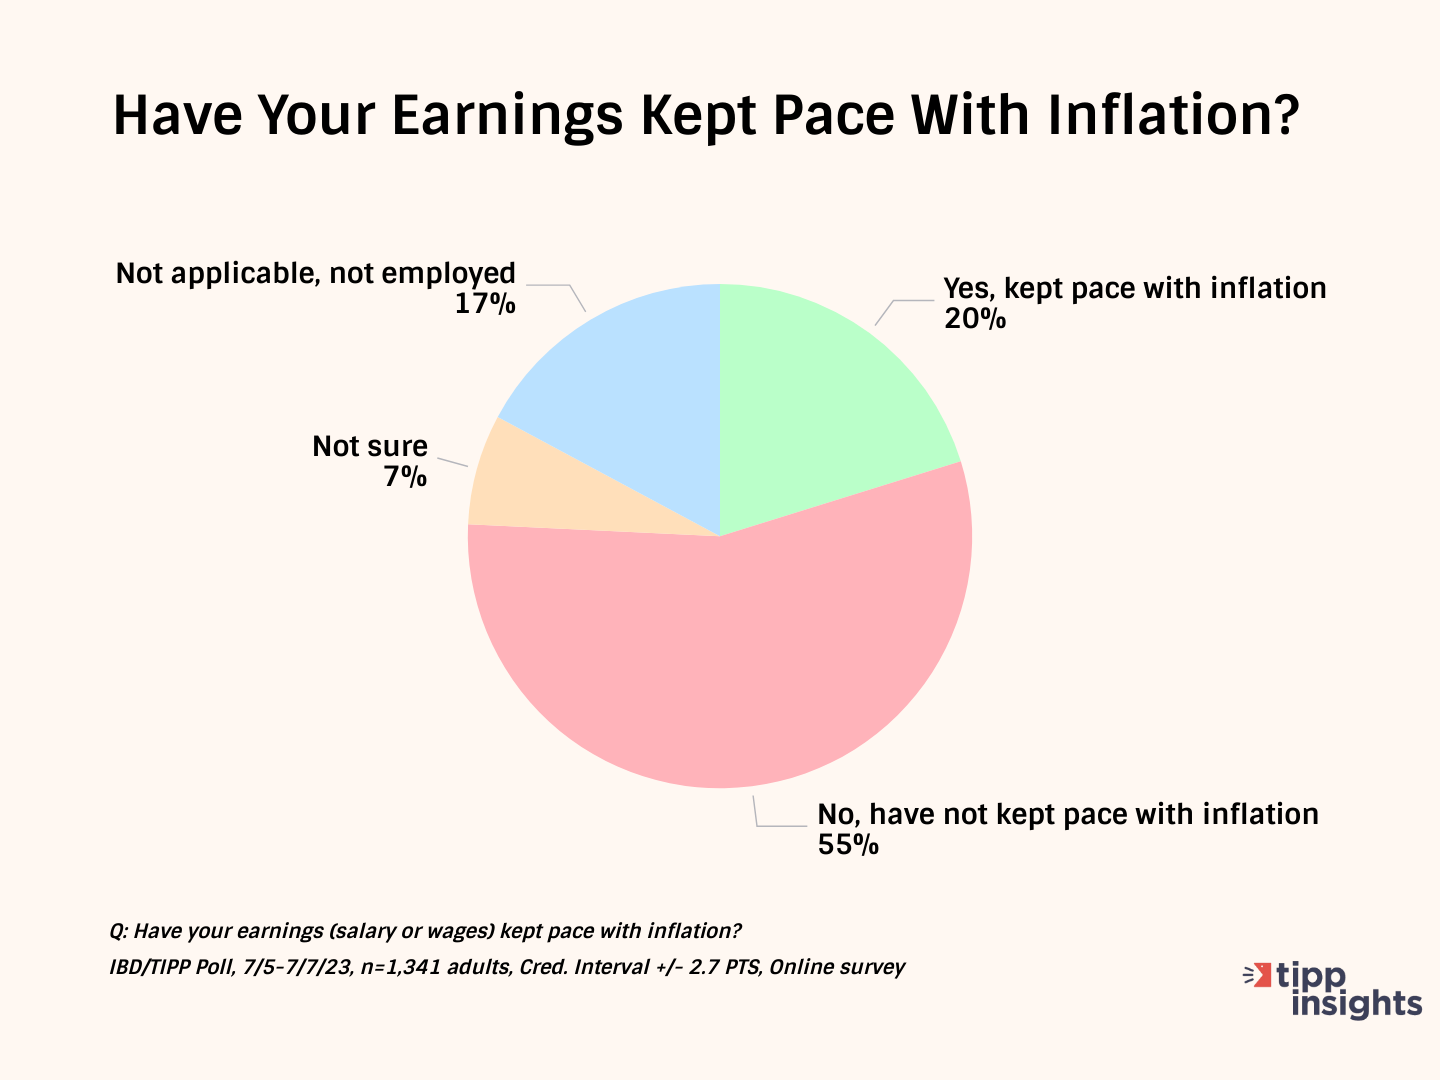
This statistic hovered in the low twenties for most of the last year. The positive change between February and April has petered out since May.
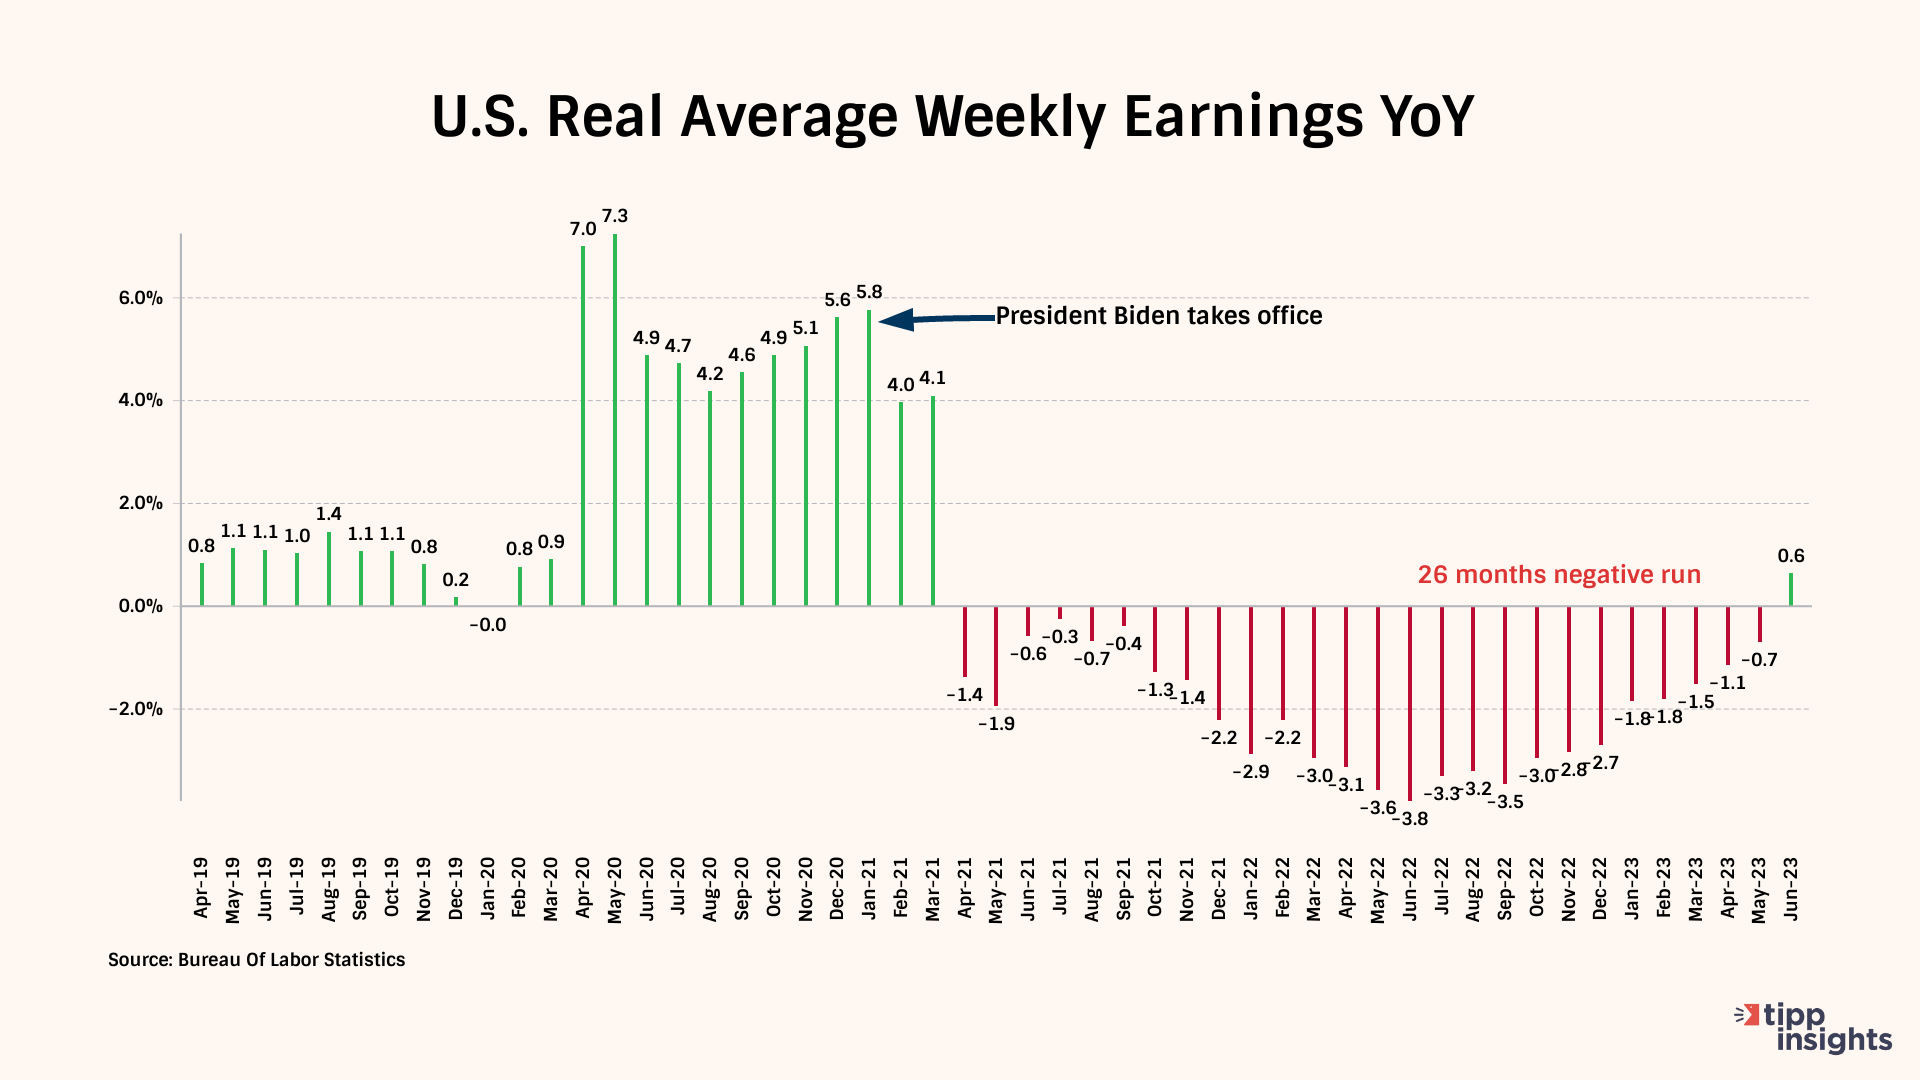
Nominal wages represent the amount of money one earns without considering changes in the cost of living. On the other hand, real wages consider inflation and measure your wages' purchasing power. By factoring in the changes in the cost of living, real wages provide a more accurate reflection of how much you can actually afford with your income.
For example, $1,000 in nominal wages you earn today with a Bidenflation rate of 16% can purchase goods that could be purchased for $862 when Biden took office.
Real weekly wages measured year-over-year have dropped for 26 of the 29 months of the Biden presidency. On a positive note, it broke a 26-month negative run in June.
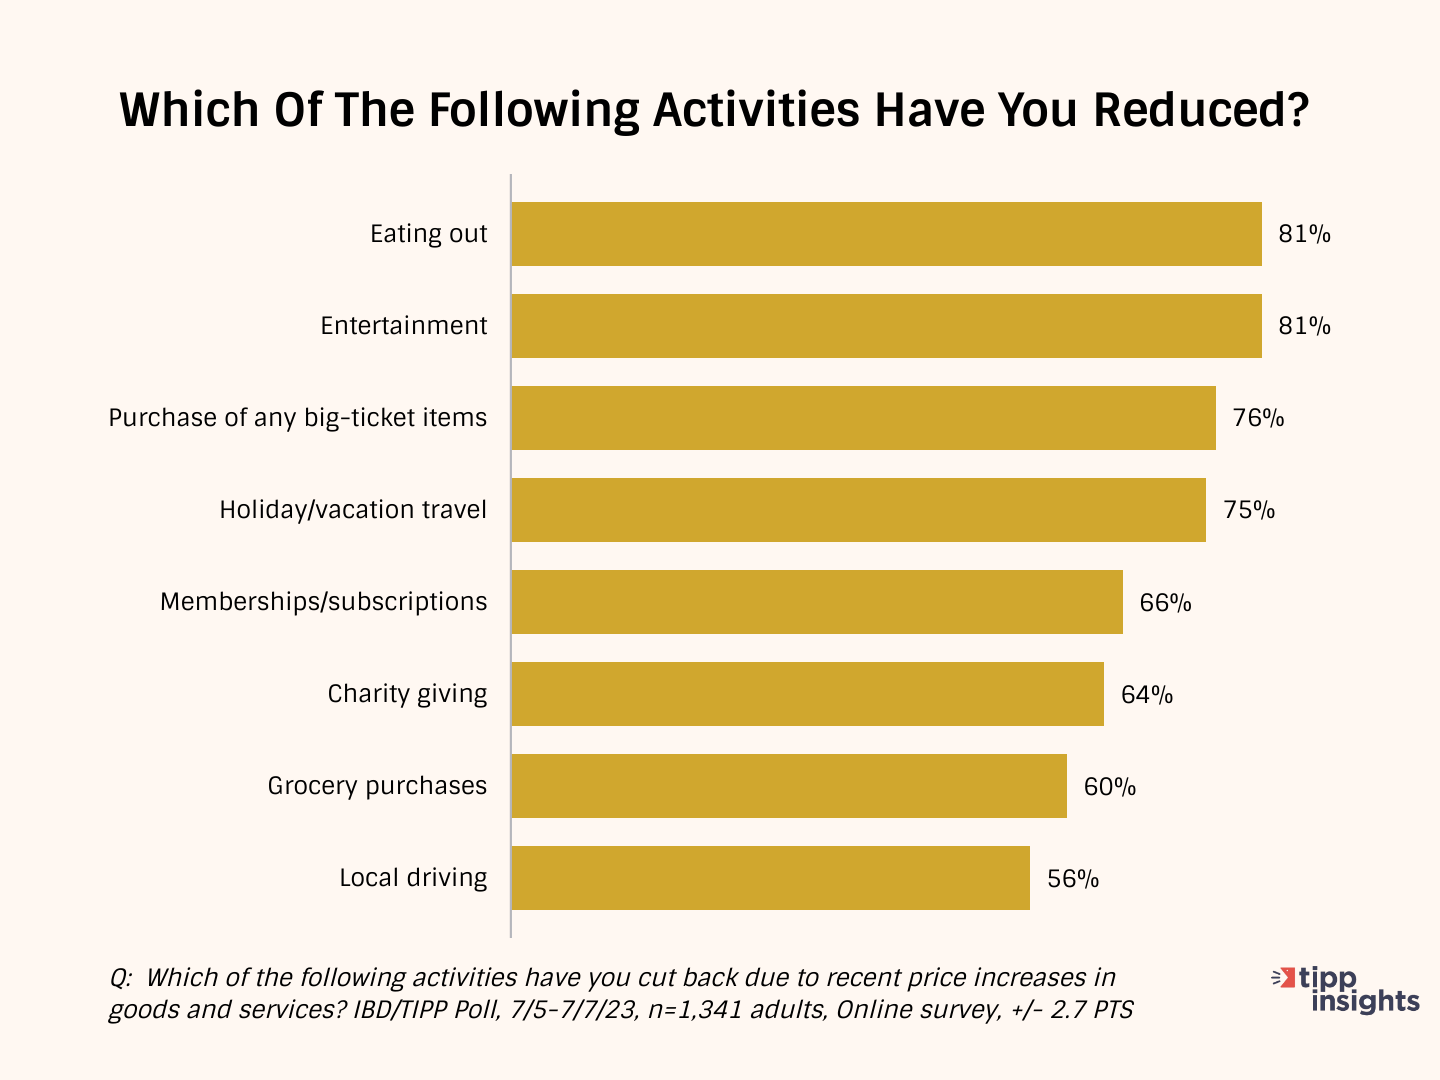
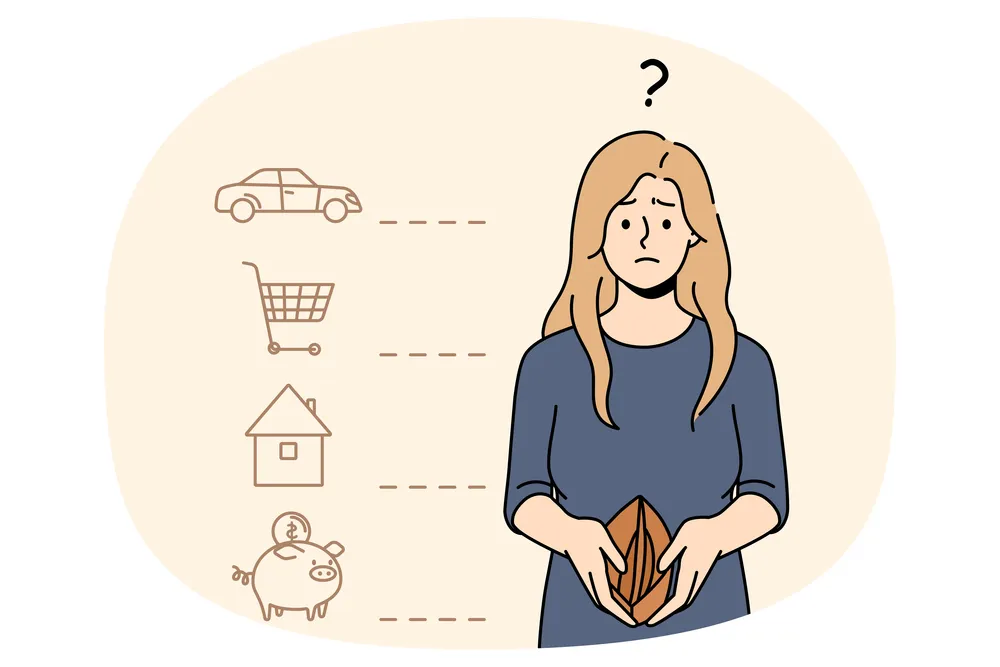
As a result of inflation, Americans are cutting back on household spending.
They are cutting back on eating out (81%), entertainment (81%), purchasing big-ticket items (76%), holiday/vacation travel (75%), and memberships/subscriptions (66%).
Many (64%) are cutting back on even good causes such as charity giving. Three out of every five (60%) households spend less on groceries. The high gasoline prices forced 56% to cut back on local driving.
Inflation Direction
The chart below compares the 12-month average of monthly changes against the 6-month and the 3-month averages. We also show the reading for June 2023.
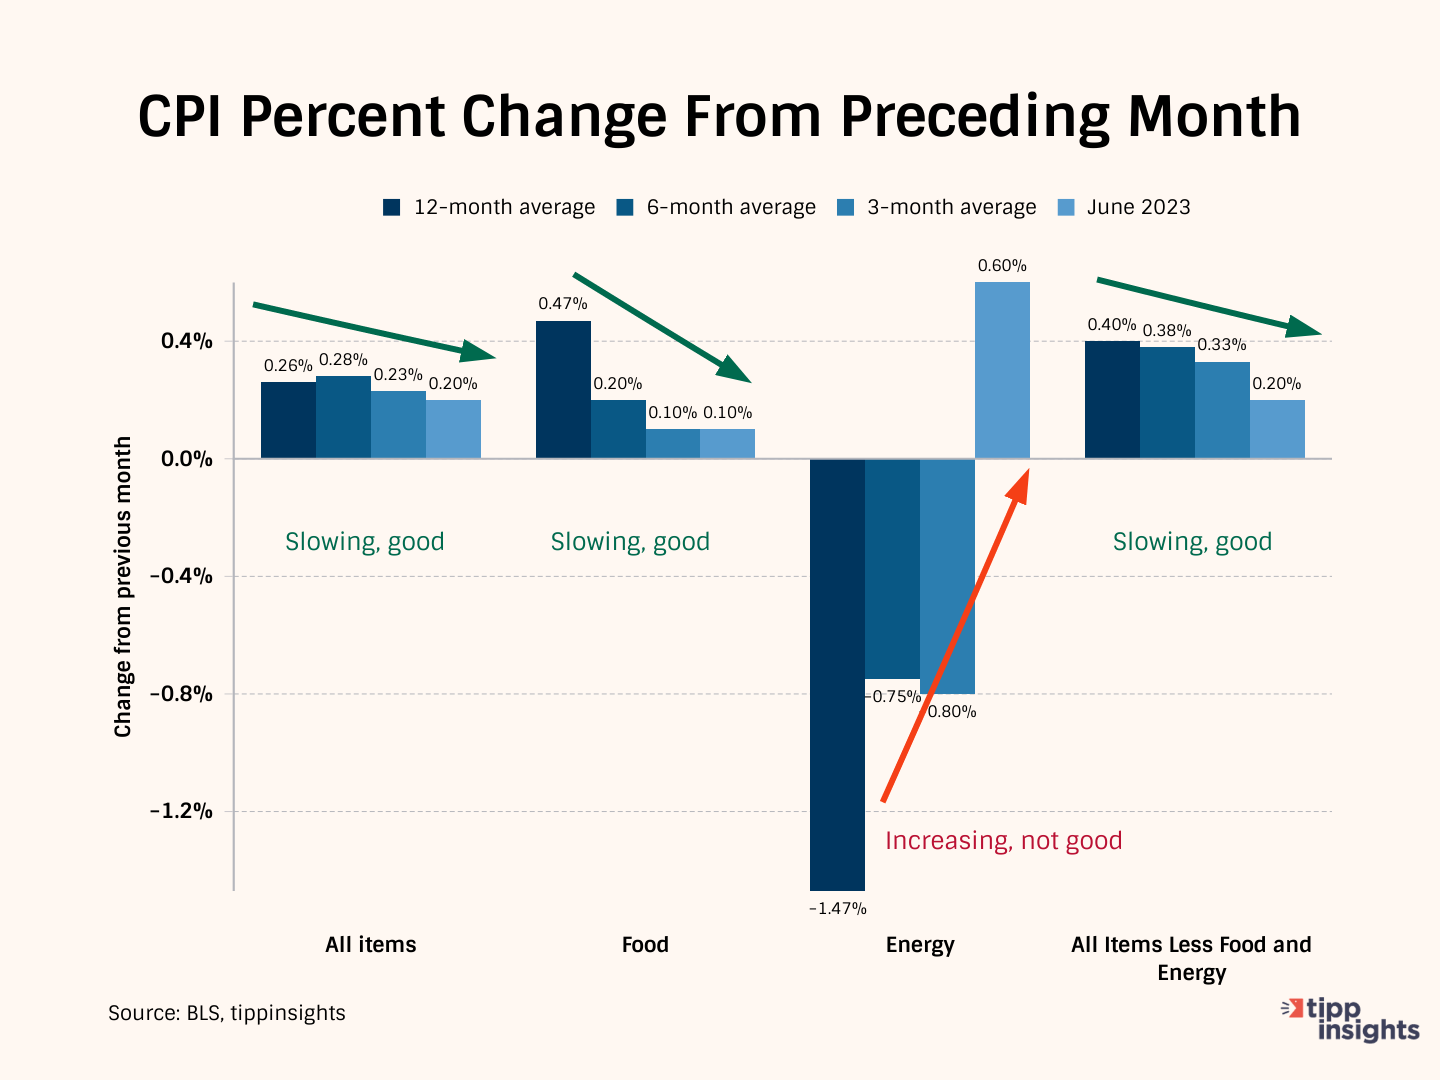
The 12-month average considers 12 data points and presents a long-term reference, while the six-month and three-month averages consider recent data points.
Typically, we compare the three-month average to the data from June 2023 to get a clearer picture. In June 2023, the average price increase for "All items" was 0.2%. However, the three-month average was higher at 0.23%. This means that the current reading is lower than the average of the past three months, indicating a slowdown in price increases.
Further, when we compare the three-month average of 0.23% to the average of the past six months, which was 0.28%, we can see that the longer period had slightly higher price increases. However, the six-month average of 0.28% was higher than the average of the past 12 months, which was 0.26%.
Overall, this pattern suggests that price increases have been slowing down, which is a positive trend.
In June, the price increase for Food was 0.10%, the same as the 3-month average of 0.10%. This indicates that food prices have stayed stable recently. Further, when we compare the three-month average of 0.10% to the average of the past six months, which was 0.20%, we can see that the longer period had slightly higher price increases. Also, the twelve-month average was 0.47%, much higher than the six-month (0.20%) and three-month (0.10%) averages. The data is very encouraging for Food.
The Energy situation sharply deteriorated last month, with a spike of 0.6%. This increase in June 2023 (0.60%) is worse than the three-month moving average of -0.80%, indicating deterioration.
"All items less food and energy" is called "core inflation," i.e., after removing volatile food and energy components. The core inflation reading in June was 0.20%, lower than the three-month average of 0.33%. This indicates that there was improvement during that period.
Meanwhile, the three-month average of 0.33% is lower than the six-month average of 0.38%, suggesting a slowdown in inflation. Additionally, the six-month average of 0.38% is lower than the 12-month average of 0.40%.
These numbers indicate a positive situation where the core inflation rate has improved recently.
In summary, directionally speaking, everything looks good except Energy.
Inverted Yield Curve
In normal circumstances, longer-term investments offer higher yields than shorter-term investments due to the higher risk associated with longer durations. However, an inverted yield curve can occur during periods of economic turbulence, such as the current times. This happens because investors expect higher yields in the short term to compensate for the potential short-term uncertainties in the economy. As a result, the yields on shorter-term bonds become higher than those on longer-term bonds of the same credit quality.
The presence of an inverted yield curve is an indication that investors anticipate economic instability or a possible economic downturn. The inverted yield curve is a leading indicator of lower inflation and recession.
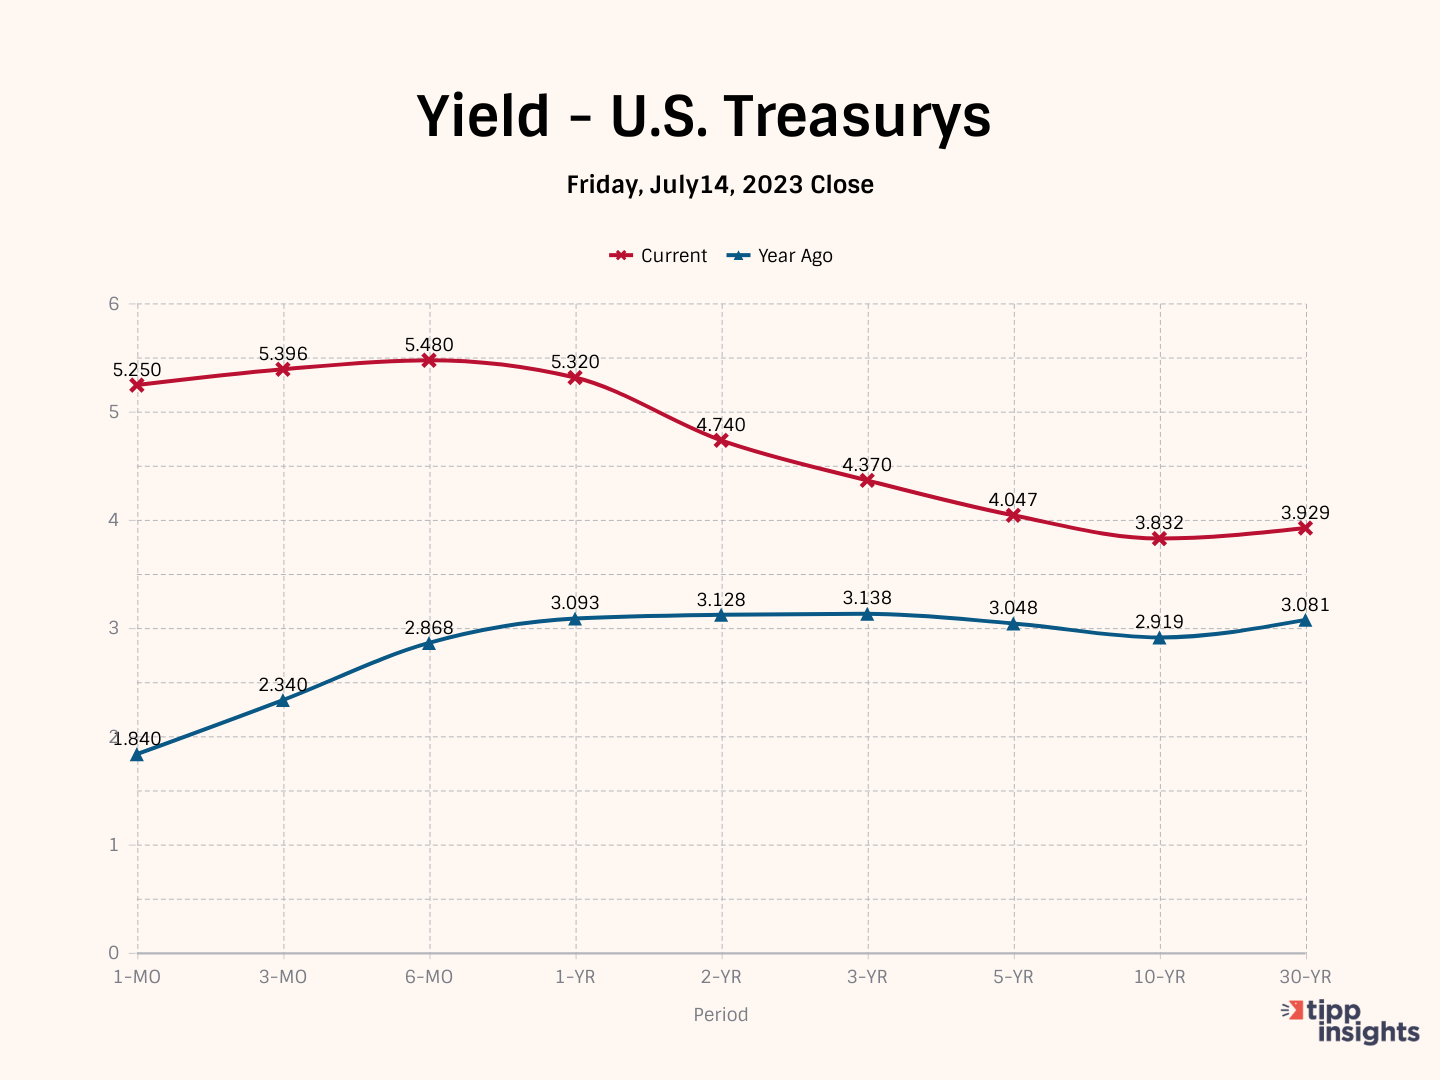
The closing yields on Friday were:
- 5.250% for the 1-month Treasury bill
- 5.396% for the 3-month Treasury bill
- 5.480% for the 6-month Treasury bill
- 5.320% for the 1-year Treasury bill
- 4.740% for the 2-year Treasury note
- 4.047% for the 3-year Treasury note
- 3.832% for the 10-year Treasury note
- 3.929% for the 30-year Treasury bond
Stagflation
Most Americans struggle, challenged by the high core inflation rate of 4.83%. Stagflation refers to a combination of stagnant economic growth and high inflation.
Since March 2022, the Fed has raised interest rates by five percentage points. Even though the Fed chose to forego a rate increase in June, most expect two more increases by the end of 2023.
We expect a rate increase later this month at the Fed meeting, bringing the rate to 5.25%. Higher interest rates are likely to slow down the economy further.
Each time the Federal Reserve increases interest rates to contain inflation, the U.S. government must pay higher interest rates to service its ballooning debt. A rising debt-to-GDP ratio limits the ability to fund essential government services.
The July IBD/TIPP Poll revealed that most Americans view the economy negatively. Over half (55%) believe we are in a recession, and an additional 63% feel that the economy is not improving.
Considering these factors and the numbers, we predict that the U.S. economy will face an extended period of stagflation characterized by a recession and inflation.
To access the TIPP CPI readings each month, you can visit tippinsights.com. We'll publish the TIPP CPI and our analysis in the days following the Bureau of Labor Statistics (BLS) report. The upcoming release of TIPP CPI is on August 10, 2023. We'll also post a spreadsheet in our store for download.
Hey, want to dig deeper? Download data from our store for a small fee!
Want to understand better? We recently wrote an explainer that sixth graders could understand. Everyone can benefit from it. Milton Friedman's Priceless Lessons On Inflation.


