Which is the bigger cover-up—Biden’s frailties or Bidenflation?
The so-called experts, Nobel laureates, and leftist media elites have the chutzpah to hoodwink Americans into believing inflation is ‘under control’ just because CPI dropped from its 9.1% peak under Biden. But ask any hardworking family, and they’ll tell you the truth—prices didn’t go back down; they just stopped rising as fast. Americans are still hurting and will continue to hurt in the coming years. That’s the disconnect. Wages haven’t kept up, grocery bills are still painful, and homeownership is a pipe dream for millions. While the experts cheered a “cooling” inflation rate, voters felt the real cost of Bidenflation—and that’s why Democrats suffered at the ballot box. Washington ignored the pain, and Americans made sure they paid the price.
When Biden took office, inflation was at just 1.4%. Since March 2021, inflation has consistently remained above the Federal Reserve's 2% target (46 consecutive months).
Under Biden, the federal debt has increased by $8.4 trillion. To finance the President’s spending spree, the Federal Reserve printed money from nothing. The increased money supply, without a corresponding increase in goods and services, reduced the value of each dollar, causing prices to rise quickly and leading to high inflation, effectively acting as a hidden tax on everyone.
Prices have increased by 20%, while real wages have declined by 3.2%. Average weekly earnings for all employees dropped 3.2% to $385.34 in December 2024 from $397.9 in January 2021, when Biden-Harris took office.
Think of it as the 20% hidden tax Americans pay yearly.
According to the government’s CPI inflation calculator, an American now needs an additional $206.52 to cover the same $1,000 in family expenses as in January 2021. A middle-class family making $75,000 today has the same buying power as someone earning $62,500 in 2021. For millions, that means less food on the table, delayed homeownership, and a future filled with financial anxiety.
Biden’s Inflation Legacy: A Stark Contrast to Past Presidents
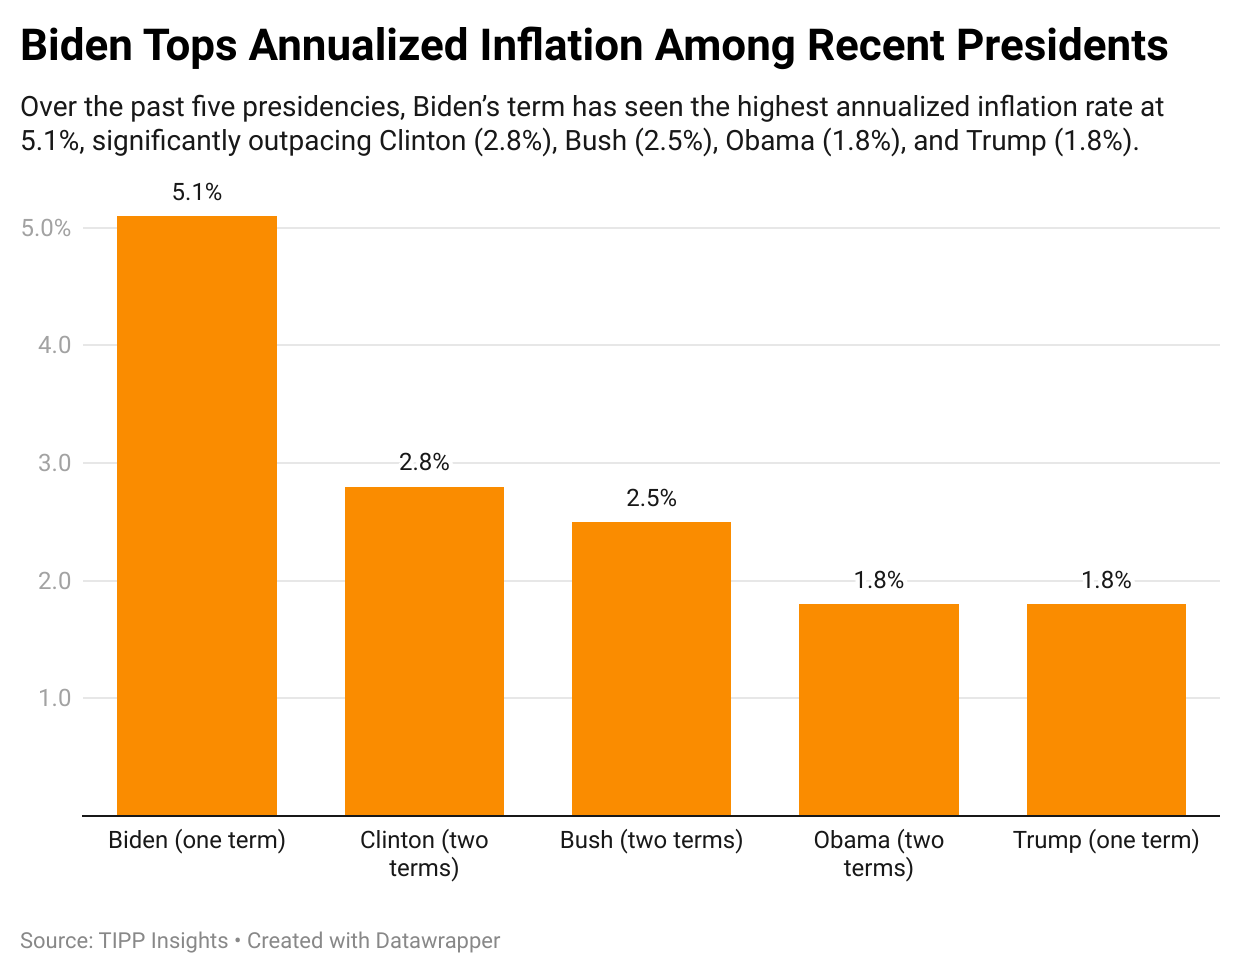
Inflation has been a defining economic issue during Biden’s presidency, reaching levels far beyond those seen in previous administrations. The chart below compares annualized inflation rates under the last five presidents, showing Biden’s term at 5.1%, significantly higher than Clinton, Bush, Obama, and Trump.
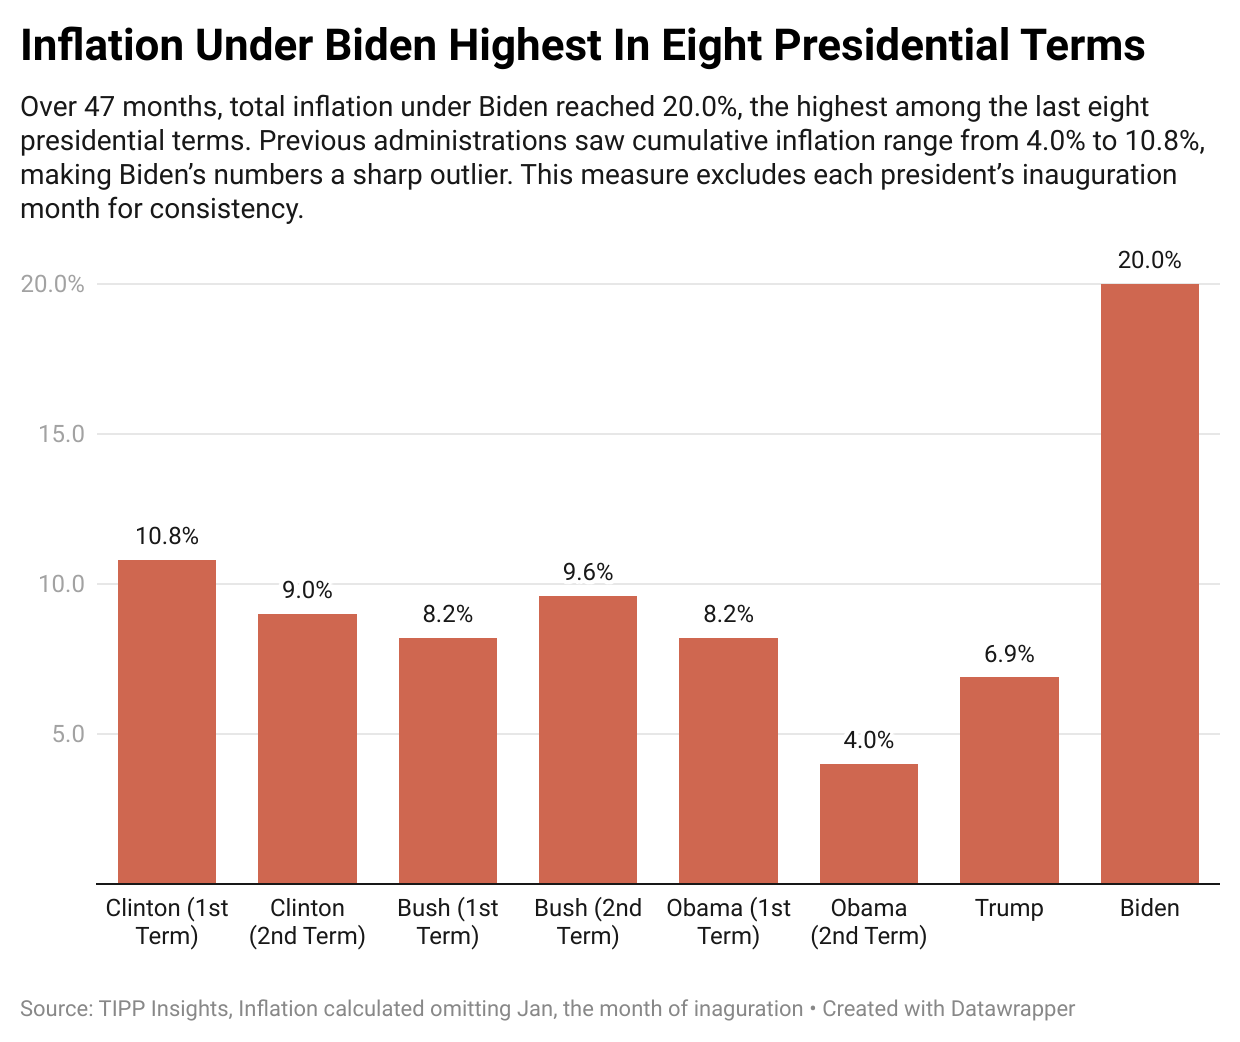
The chart below examines total inflation over 47 months, illustrating how price increases under Biden (20.0%) dwarf those of past presidential terms, where the highest previously recorded was 10.8% under Clinton’s first term. This cumulative inflation measure, which excludes each president’s inauguration month for consistency, highlights the broader economic impact of sustained price hikes during Biden’s tenure.
Economic Carnage
A recent MarketWatch survey found that 48.6% of Americans consider themselves to be “broke,” and 66.2% feel they are “living paycheck to paycheck.”
A family earning $75,000 in 2021 now needs $90,000 just to maintain the same lifestyle—but wages haven’t kept up. Americans are taking second jobs, drowning in credit card debt, and even skipping meals to bridge the gap.
American household debt has increased significantly amid challenging economic conditions. U.S. credit card debt hit a record $1.17 trillion in Q3 2024, up $24 billion from the previous quarter and 8.1% higher than a year ago. The average credit card balance per consumer is $6,329, rising 4.8% year-over-year. 28% of Americans reported increased debt over the last three months, often due to persistent inflation and high interest rates, which have strained household finances. Credit card interest rates remain above 20%, near an all-time high, disproportionately affecting lower-income households.
Housing affordability has also collapsed due to skyrocketing home prices and high mortgage rates. Buying a home in America now requires an income of $107,700—nearly double the $56,800 needed in 2019. Just 36% of households can afford a new home today, compared to 59% five years ago. Soaring home prices and mortgage rates that nearly doubled to 7.3% have locked an entire generation out of homeownership. Even with rates easing slightly, affordability remains a major casualty of inflation.
Nearly half of all renters spend more than 30% of their income on rent, with a quarter spending over 50%, making it difficult to save for a down payment.
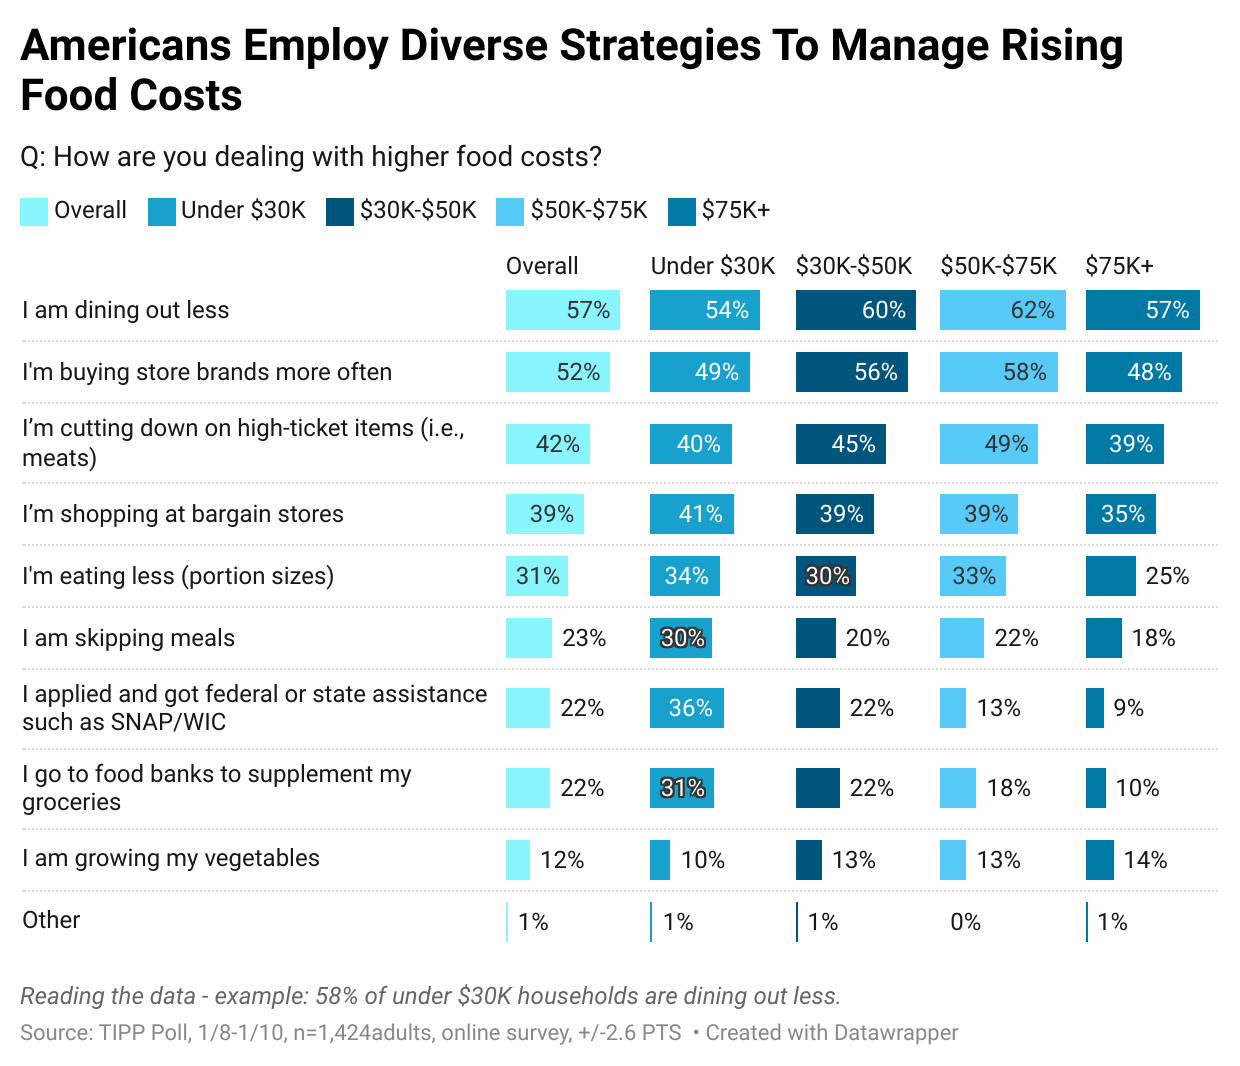
Inflation is hitting wallets hard. The LendingTree survey found that 78% of consumers view fast food as a luxury purchase because of rising costs, with 62% eating it less frequently. Americans adopt various strategies in their struggle to adjust to higher food costs. Some concerning trends include 31% eating less (reducing portion sizes) and 24% skipping meals.
Hunger Games in the First World: Americans Struggle to Afford Food Under Bidenflation
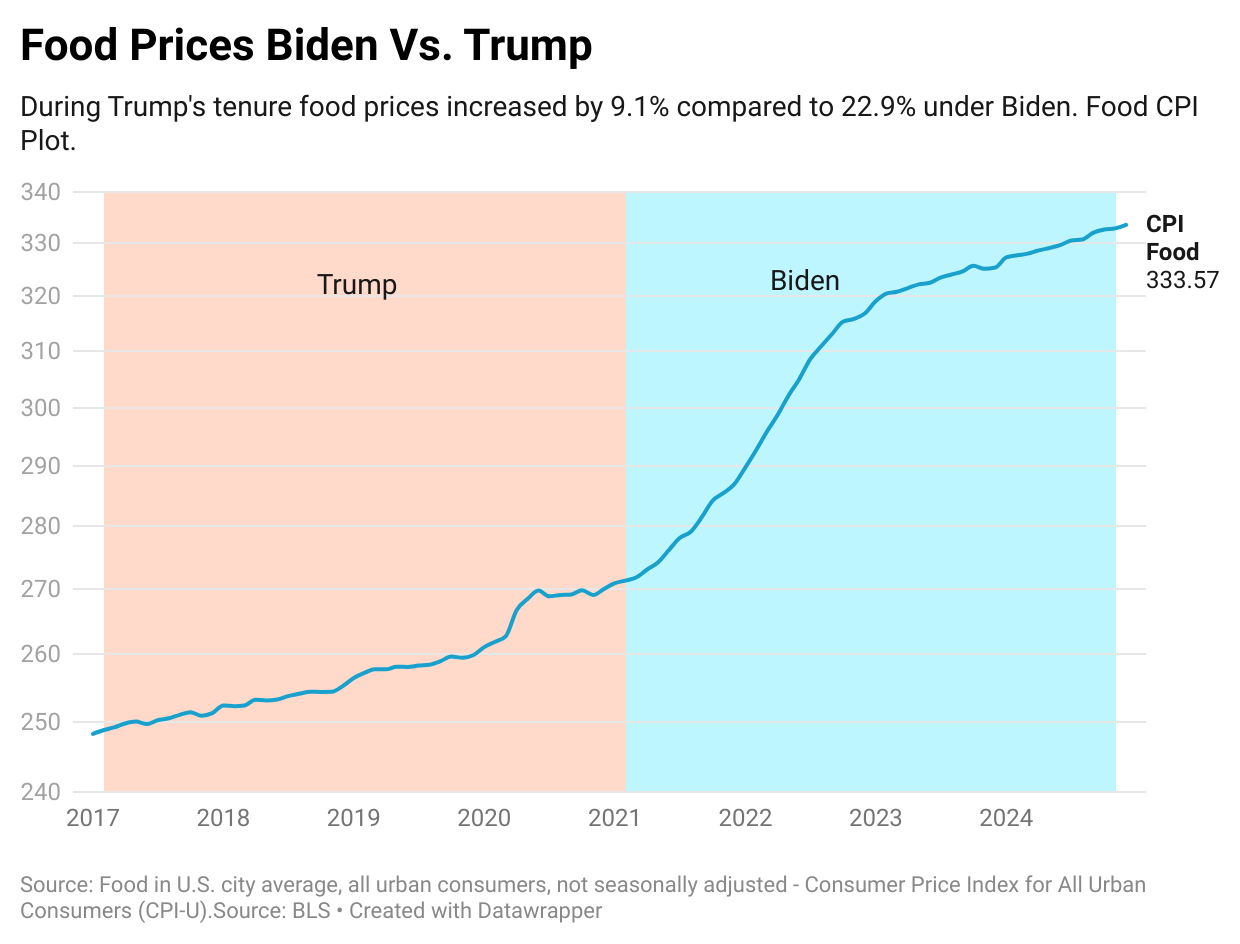
Food prices surged 22.9% under Biden, more than double the 9.1% increase under Trump. The data makes it clear—Bidenflation has made grocery shopping a financial burden.
Americans are making hard choices just to afford food. The latest TIPP Poll finds that 23% are skipping meals, 22% rely on food banks, and over half are cutting back on dining out and meat. Bidenflation has turned grocery shopping into a survival game for middle-class families feeling the squeeze.
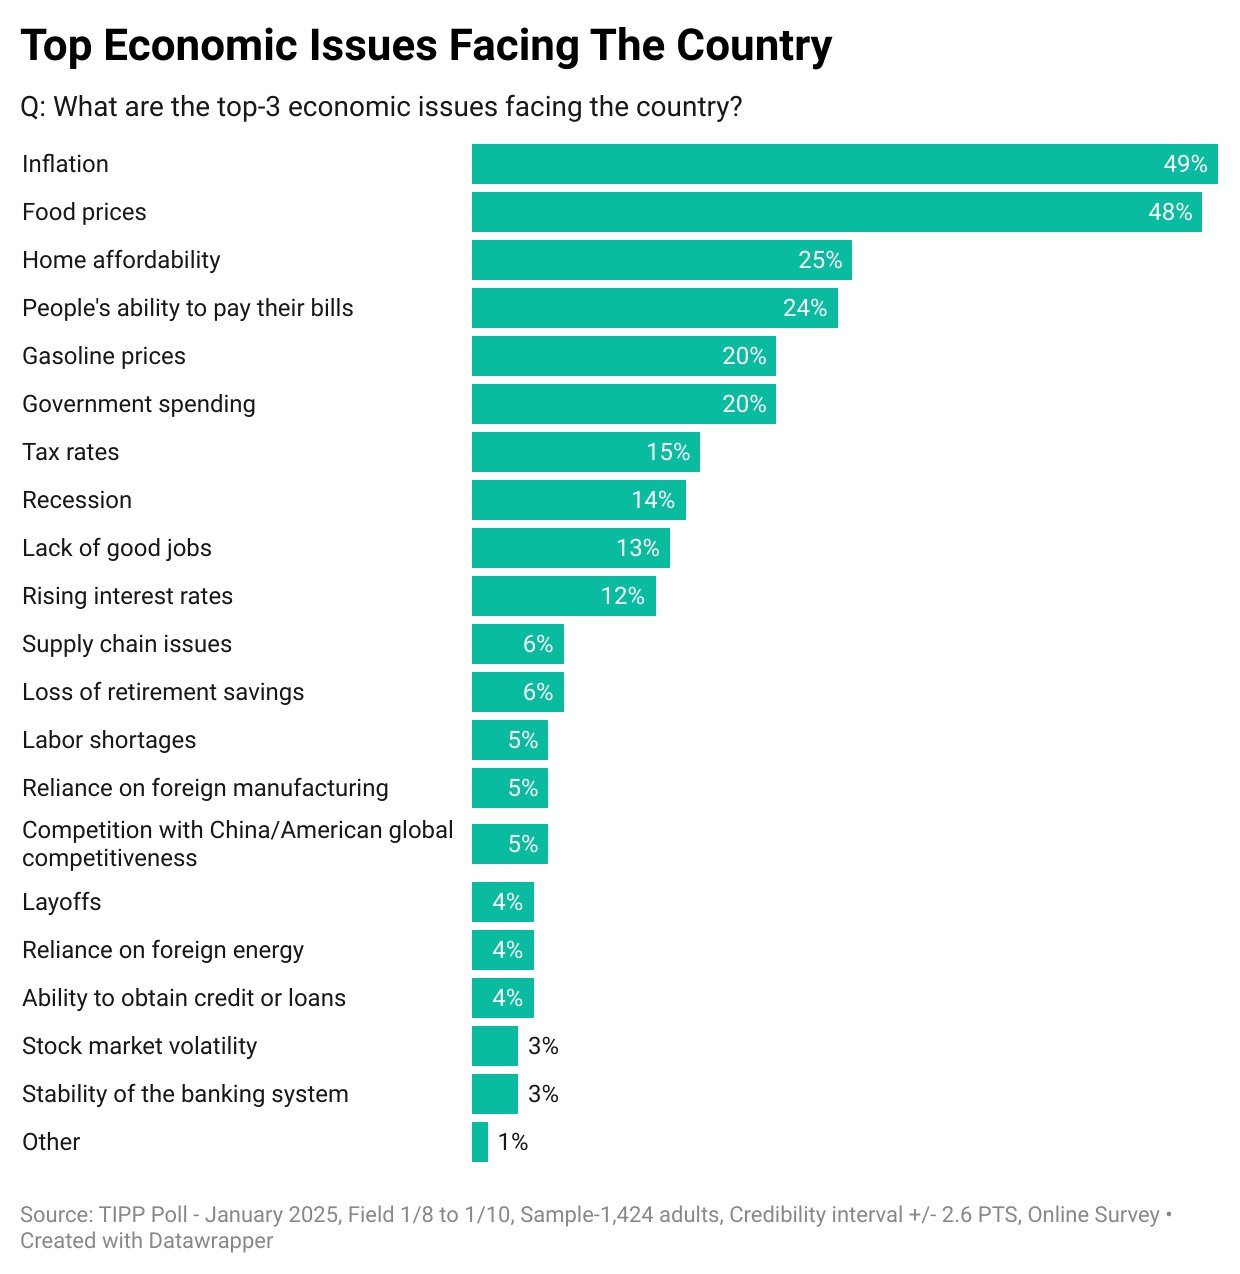
Therefore, it is unsurprising that inflation and food prices emerged as the top economic issues among Americans in the January TIPP Poll conducted after the presidential election.
CPI Report
The government's Consumer Price Index (CPI), released on Wednesday, showed a 2.9% year-over-year price increase from December 2023 to December 2024.
After adjusting for seasonality, the Consumer Price Index (CPI) increased by 0.4% between November 2024 and December 2024. During the same period, food prices increased by 0.3%, energy prices increased by 2.6%, and core prices (all items except food and energy) increased by 0.2%.
TIPP CPI
We developed the TIPP CPI, a metric that measures the rate of change using February 2021, the month after President Biden's inauguration, as the base. All TIPP CPI measures are anchored to this month, making them exclusive to the economy under Biden-Harris.
What is the motivation behind the TIPP CPI?
The official BLS CPI year-over-year calculations compare prices to already inflated bases, and these statistics could mask the full impact.
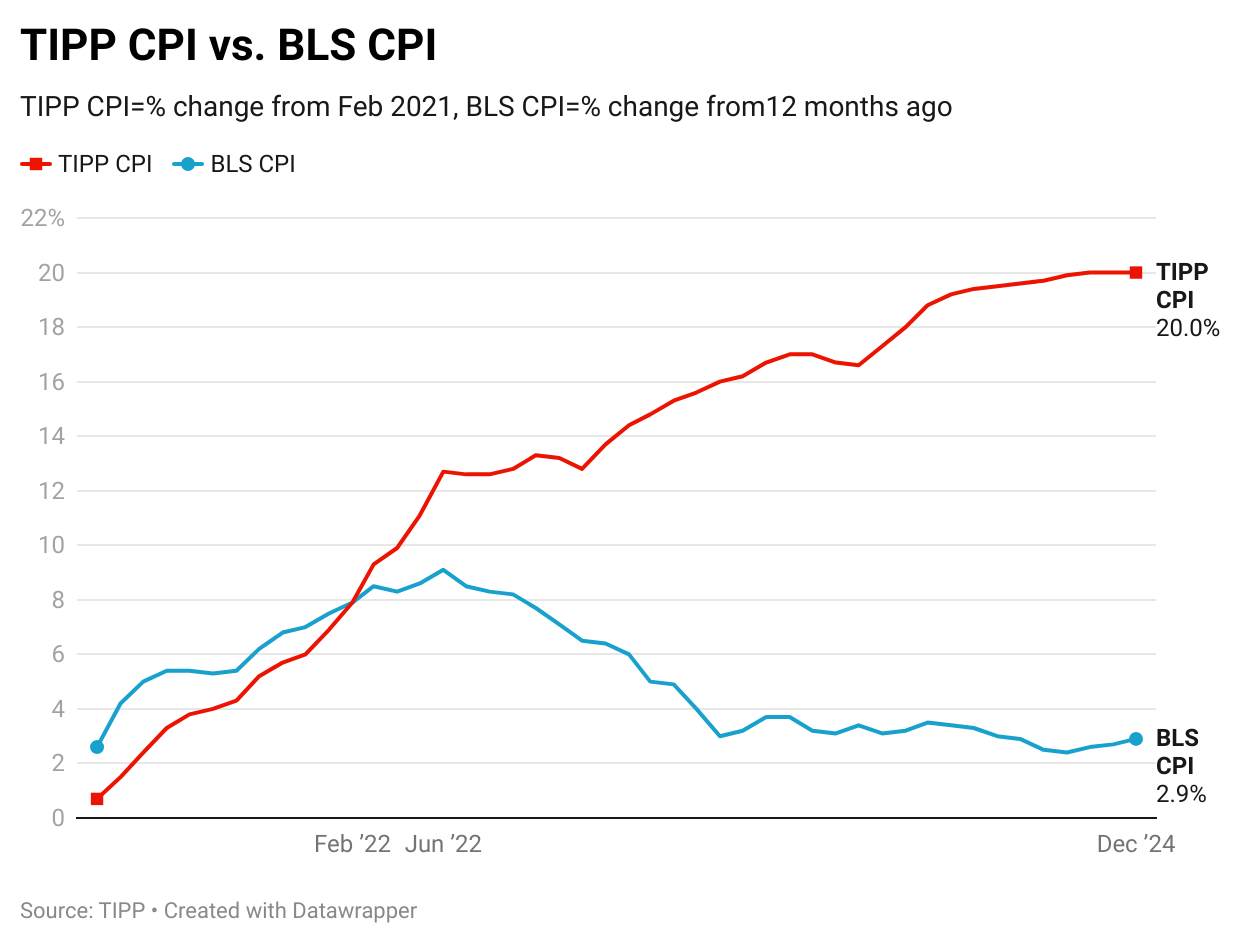
Washington brags about a ‘cooling’ 2.9% inflation rate—but Americans know better. The truth? Prices are up 20% since Biden took office. Our exclusive TIPP CPI exposes the full impact, revealing the economic pain Washington won’t admit.
We use the relevant data from the Bureau of Labor Statistics (BLS) to calculate the TIPP CPI, but we adjust the period to Biden's tenure. When discussing the TIPP CPI and the BLS CPI, we convert the index numbers into percentage changes to better understand and compare them. CPIs are like index numbers that show how prices affect people's lives, like how the Dow Jones Industrial Average reflects the stock market.
Bidenflation, as measured by the TIPP CPI using the same underlying data, stayed steady at 20.0% in December 2024. Starting at 17.3% in January, it steadily climbed throughout the year, reaching 19.2% by April and incrementally rising month by month to hit 20.0% in October. It remained at 20% in November. Biden finishes his term with 20%; since the month of January will be shared by both Biden and Trump, we ignore it.
TIPP CPI vs. BLS CPI
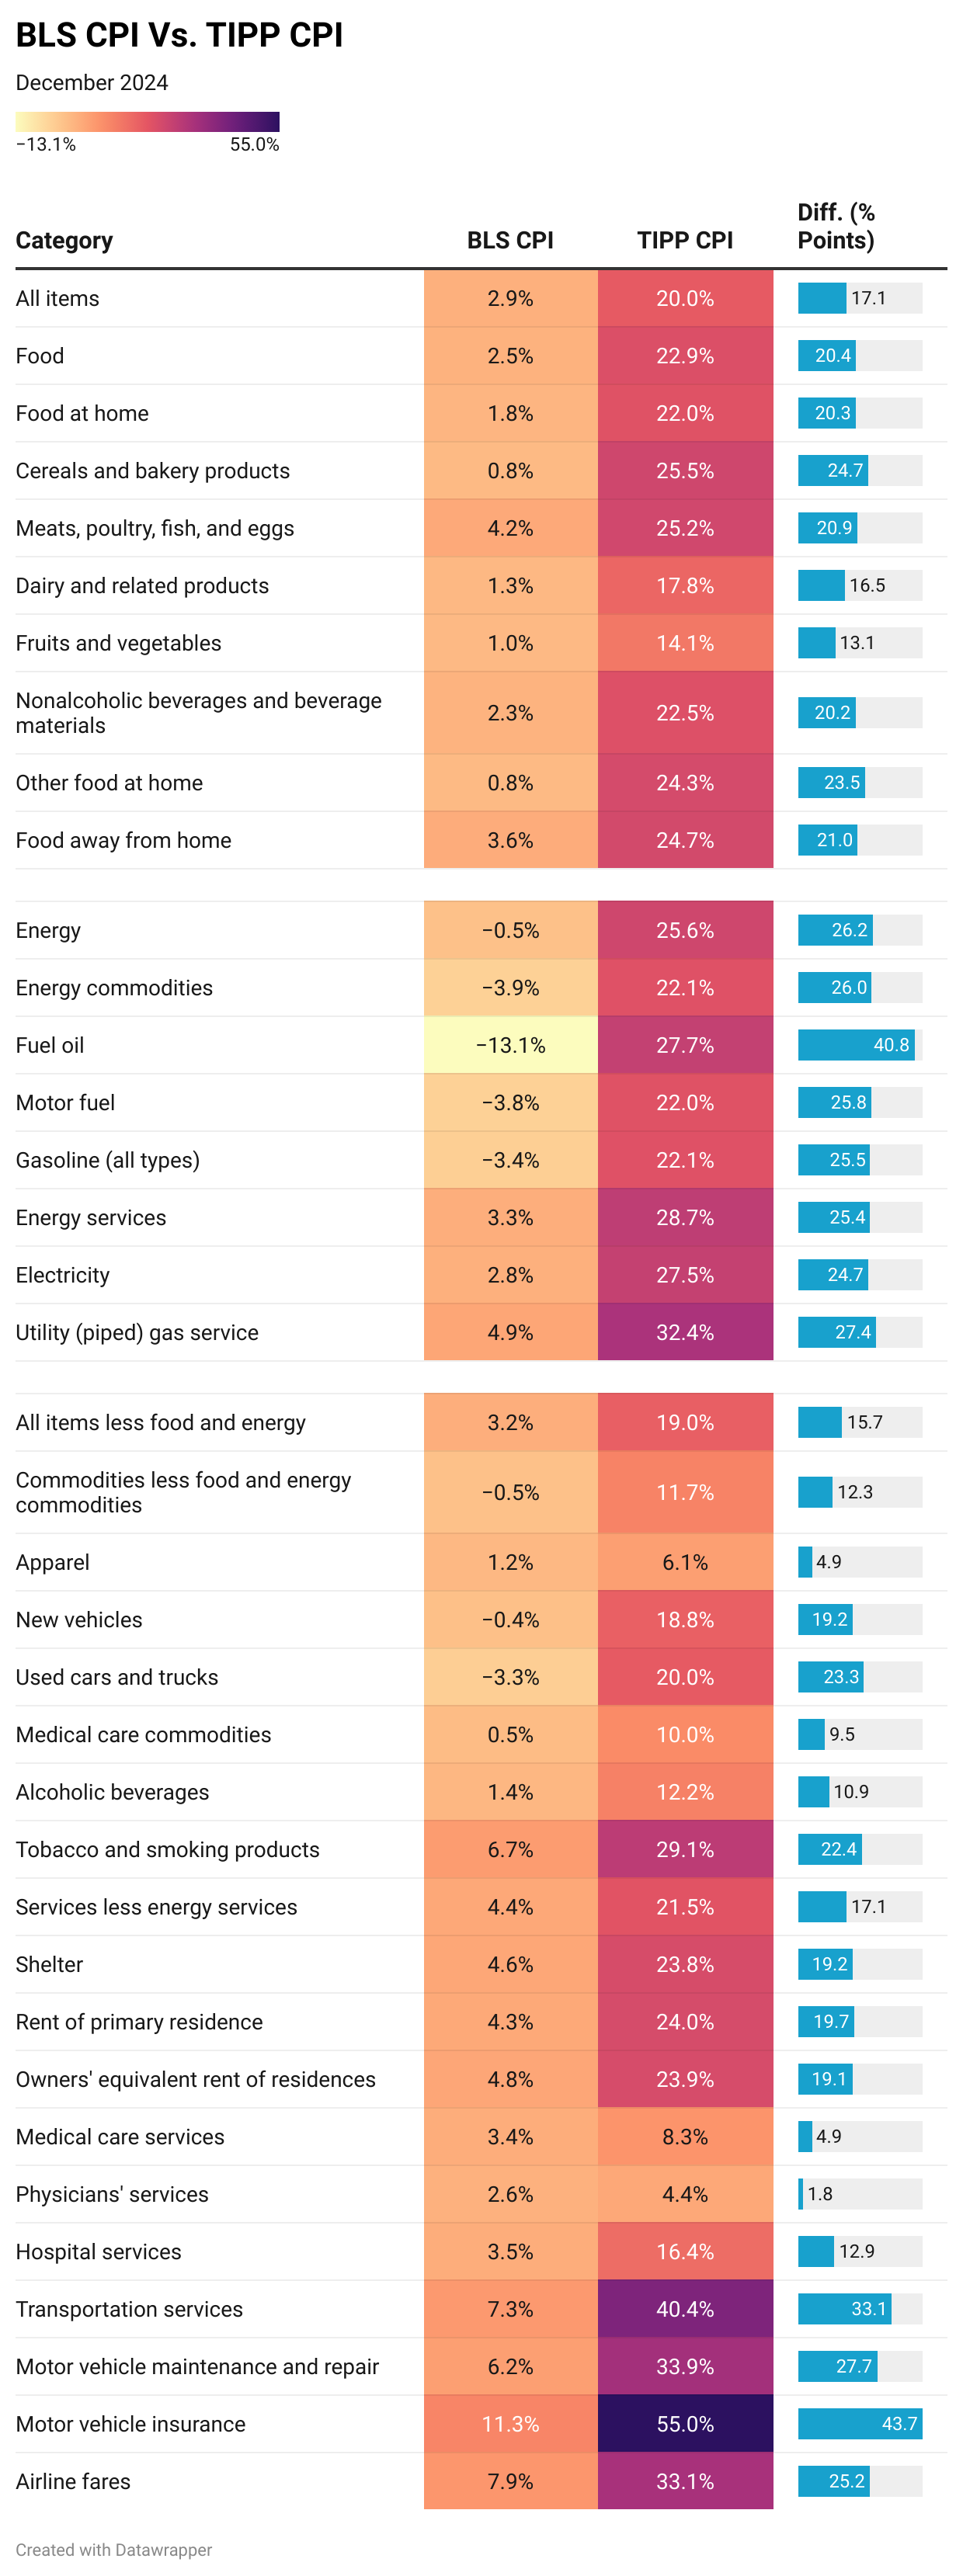
The following two charts present details about the new metric.
For December 2024, the BLS reported a 2.9% annual CPI increase. Compare this to the TIPP CPI of 20.0% - a 17.1-point difference. Prices have increased by 20.0% since Biden-Harris took office. On an annual basis, the TIPP CPI rate is 5.1%.
Food prices increased by 22.9% under Biden-Harris per TIPP CPI, compared to only 2.5% as per BLS CPI, a difference of 20.4 points.
TIPP CPI data show that Energy prices increased by 25.6%. But, according to the BLS CPI, energy prices dropped by 0.5%. The difference between the two is a whopping 26.2 points.
The Core CPI measures the price increase for all items, excluding food and energy. The Core TIPP CPI is 19.0% compared to 3.2% BLS CPI, a 15.7-point difference.
Gasoline prices have increased by 22.1% since Biden-Harris took office, whereas the BLS CPI shows that they have declined by 3.4%, a difference of 25.5 points.
Shelter costs rose by 23.8% under Biden-Harris’s watch, compared to the BLS reading of 4.6%, a difference of 19.2 points.
TIPP CPI finds that Used car prices have risen by 20.0% during the current administration. Meanwhile, the BLS CPI reports that the prices have dropped 3.3%, a difference of 23.3 points.
Air ticket inflation is 33.1% compared to the BLS CPI’s 7.9%, a difference of 25.2 points.
Motor vehicle insurance increased by 55.0% compared to the BLS CPI’s increase of 11.3%, a difference of 43.7 points.
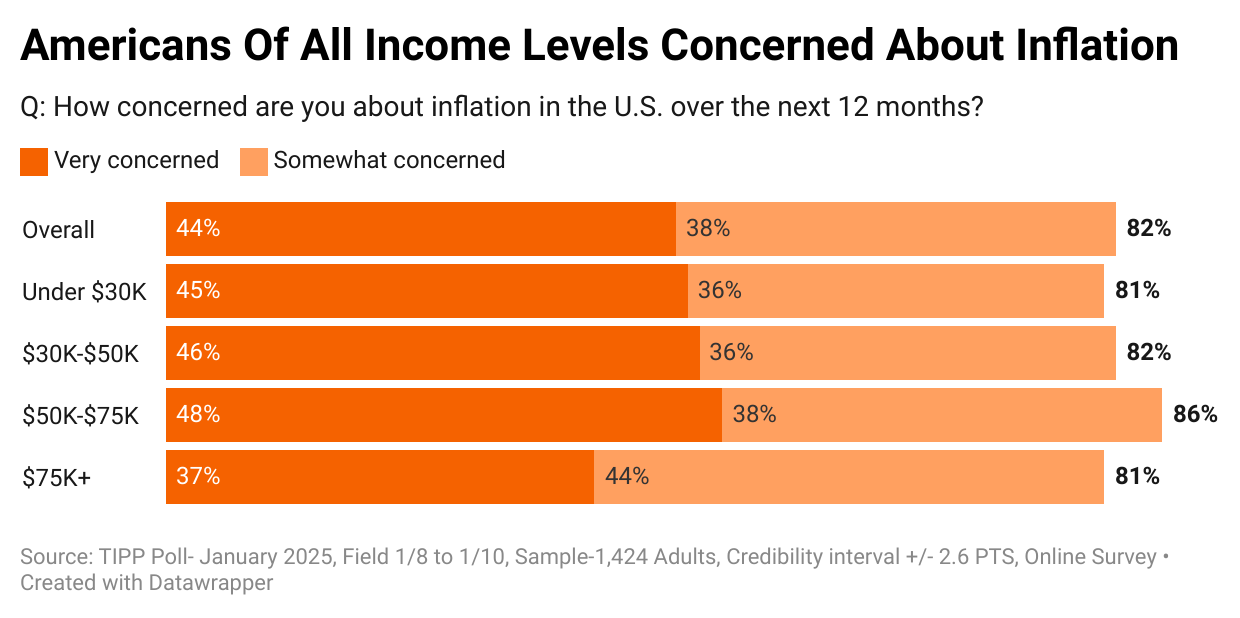
The latest TIPP Poll, completed in early January, shows that nearly eight in ten (82%) survey respondents are concerned about inflation. As the chart below shows, this concern is shared across income levels. The share of those “very concerned” is highest among the $75K+ households at 44% and tapers down as household income decreases, with 36% for both $30K-$50K and under $30K groups.
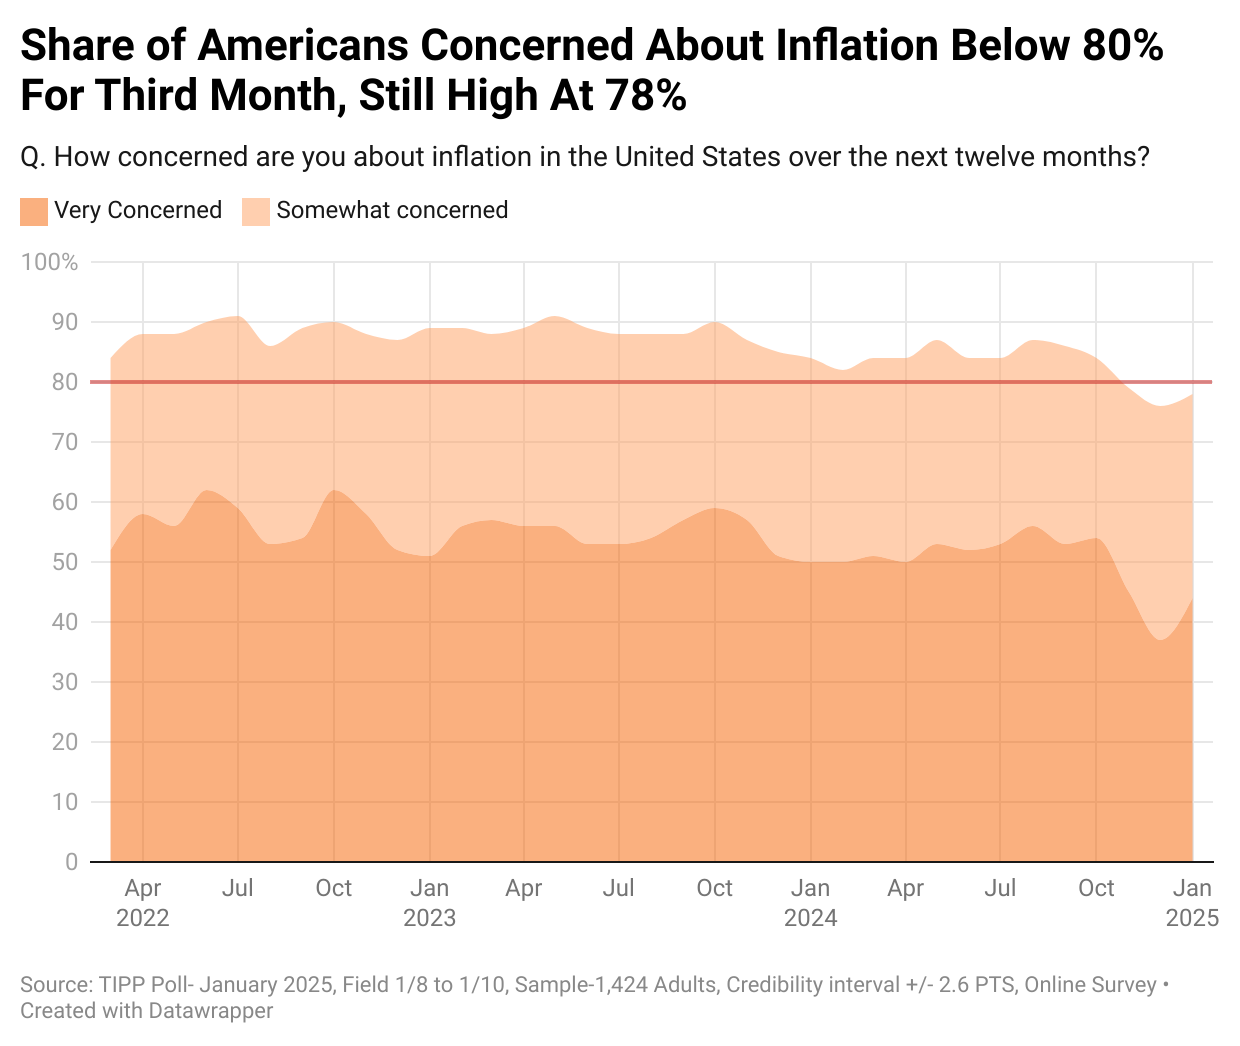
Since January 2022, inflation concerns have consistently remained above 80%. It’s welcome news that in November, the share of Americans who are concerned dropped below 80% for the first time in 33 months. In January it is 78%.
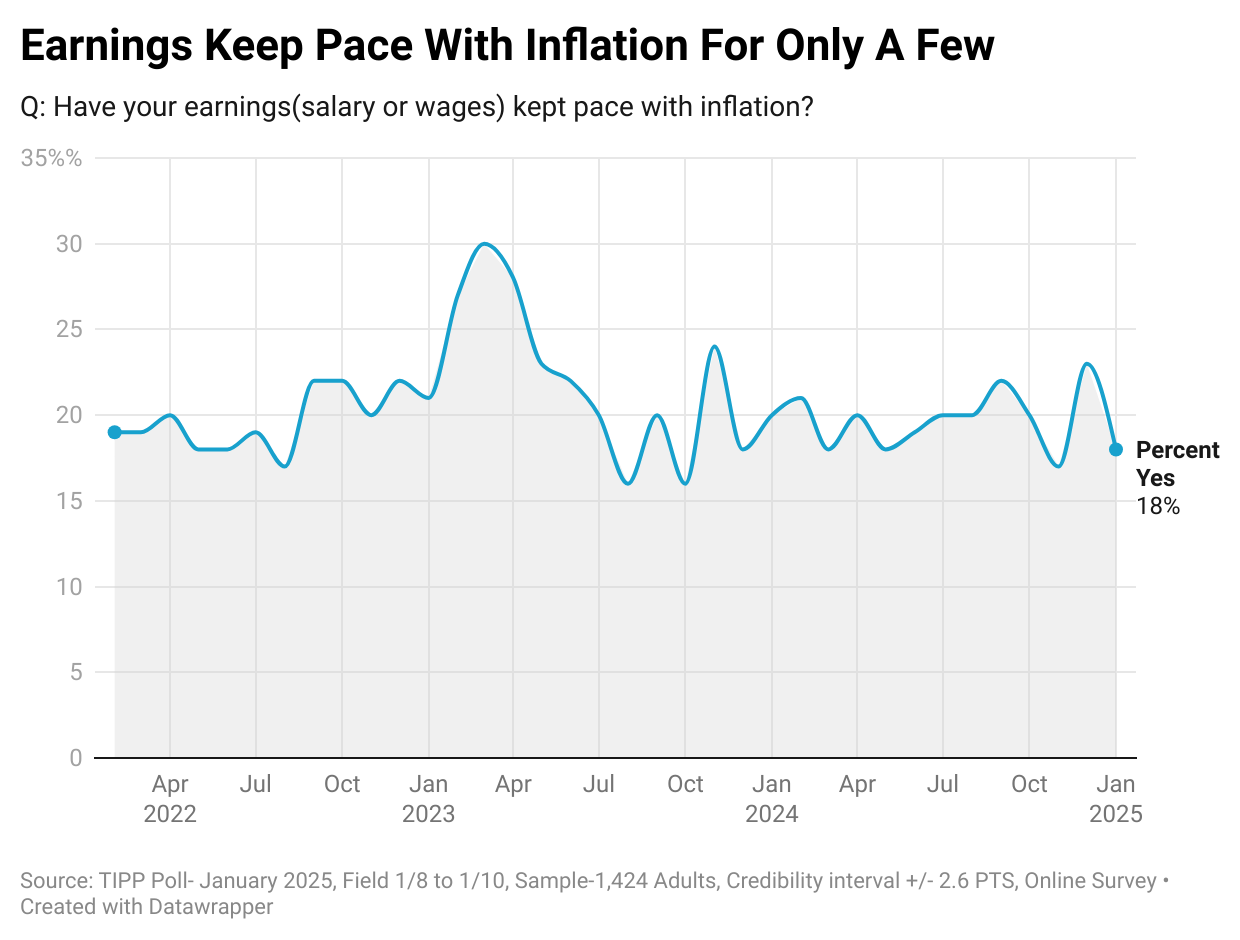
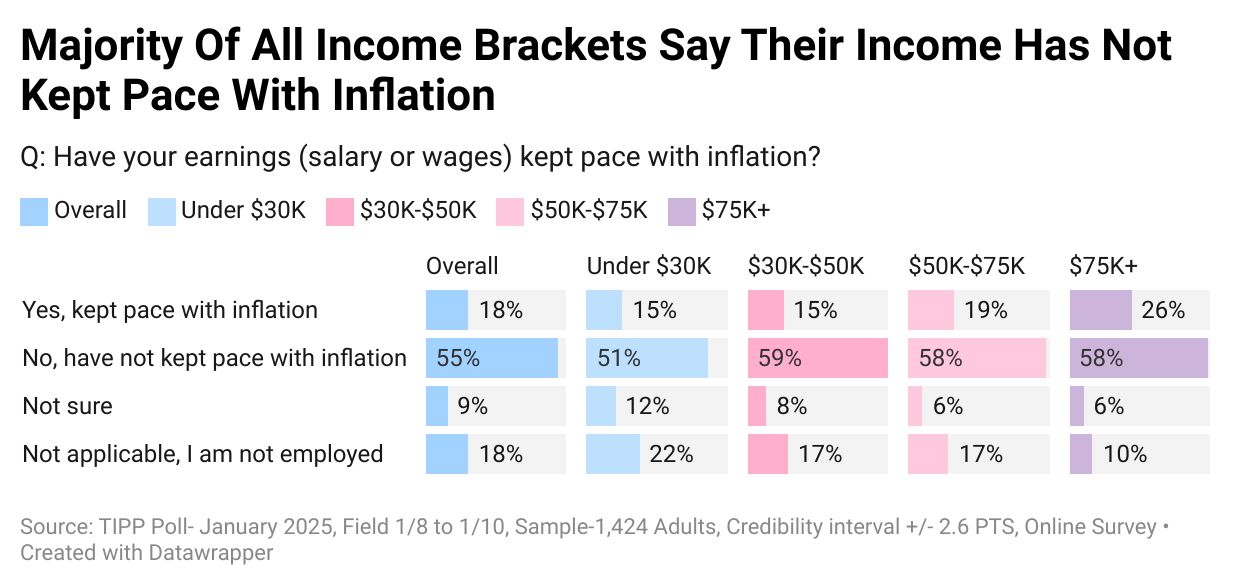
Over half (55%) say their wages have not kept up with inflation, while only one in six (18%) say their income has. Since January 2024, this statistic has moved in a tight 17% to 23% range.
Our data shows that most households in all income brackets find that their earnings have not kept pace with inflation: 51% for households under $30K, 59% for households $30K to $50K, 58% for households $50K to $75K, and 58% for households $75K+.
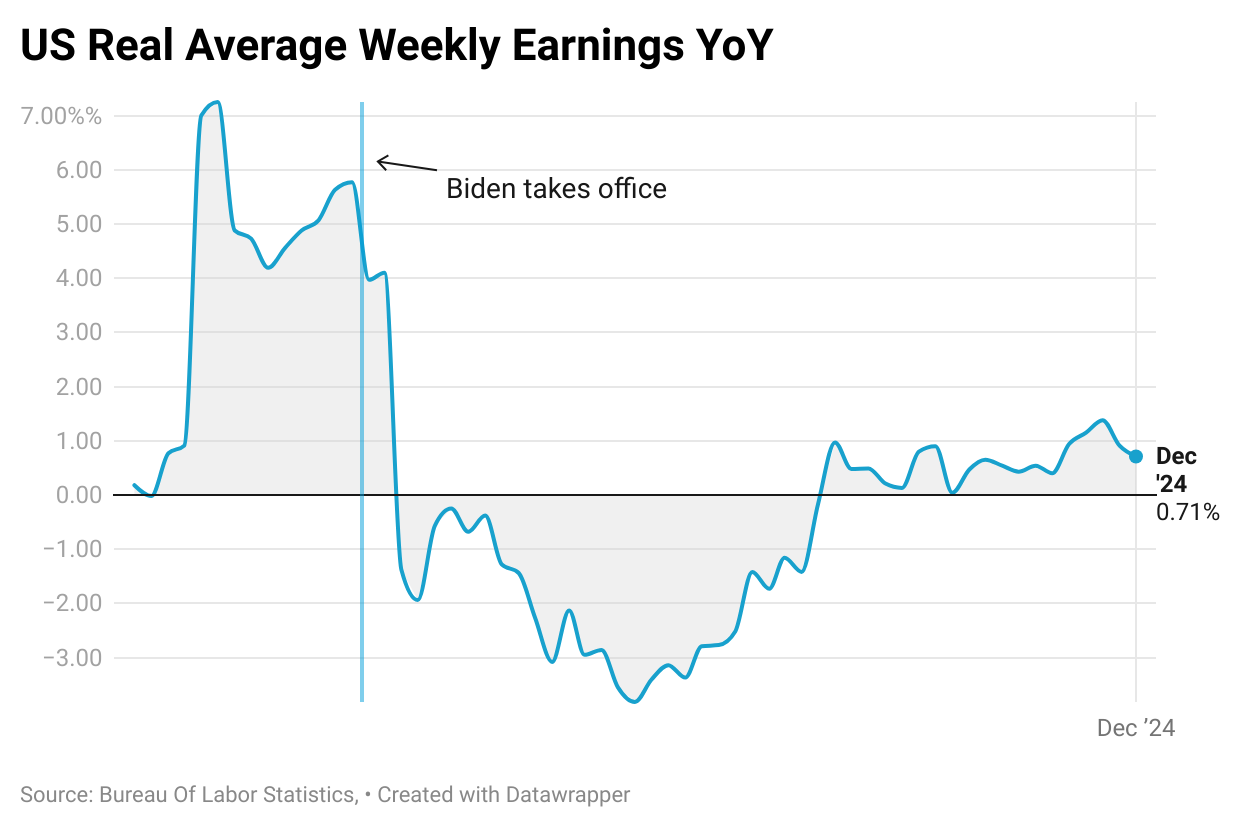
Nominal wages represent the amount of money one earns without considering changes in the cost of living. On the other hand, real wages consider inflation and measure the purchasing power of wages. Real wages provide a more accurate reflection of what is affordable with the income earned by factoring in the changes in the cost of living.
Real weekly wages, measured year-over-year, showed negative readings for 26 out of the 47 months during the Biden presidency from February 2021 to June 2024. The 26-month negative streak was broken in June 2023. Since then, the measure has posted positive readings.
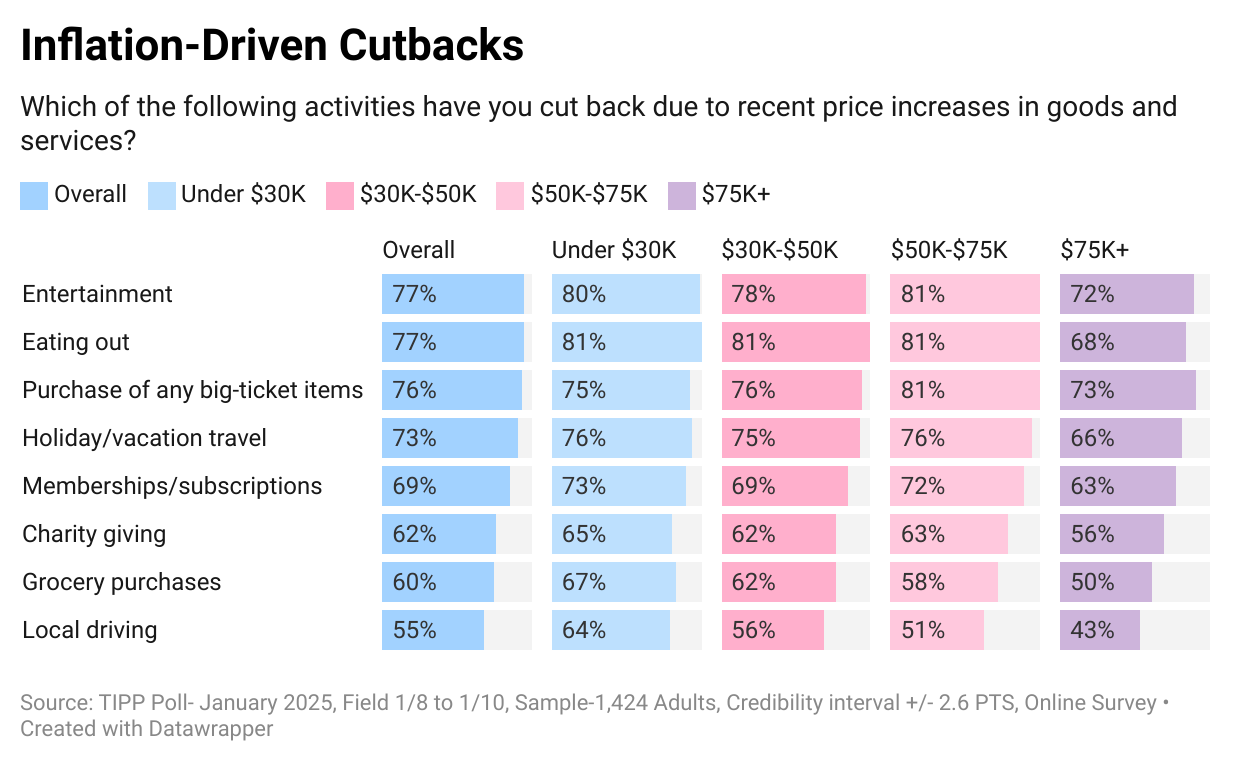
As a result of inflation, Americans are cutting back on household spending.
They are cutting back on entertainment (77%), eating out (77%), purchasing big-ticket items (76%), holiday/vacation travel (73%), and memberships/subscriptions (69%).
Nearly two-thirds (62%) are cutting back on charity giving. Over half (60%) spend less on groceries, and the high gasoline prices forced 55% to cut back on local driving.
The cutbacks are more prevalent among lower-income households than their higher-income counterparts.
Inflation Direction (Persistent)
The chart below compares the 12-month, 6-month, and 3-month averages with the latest reading for October 2024.
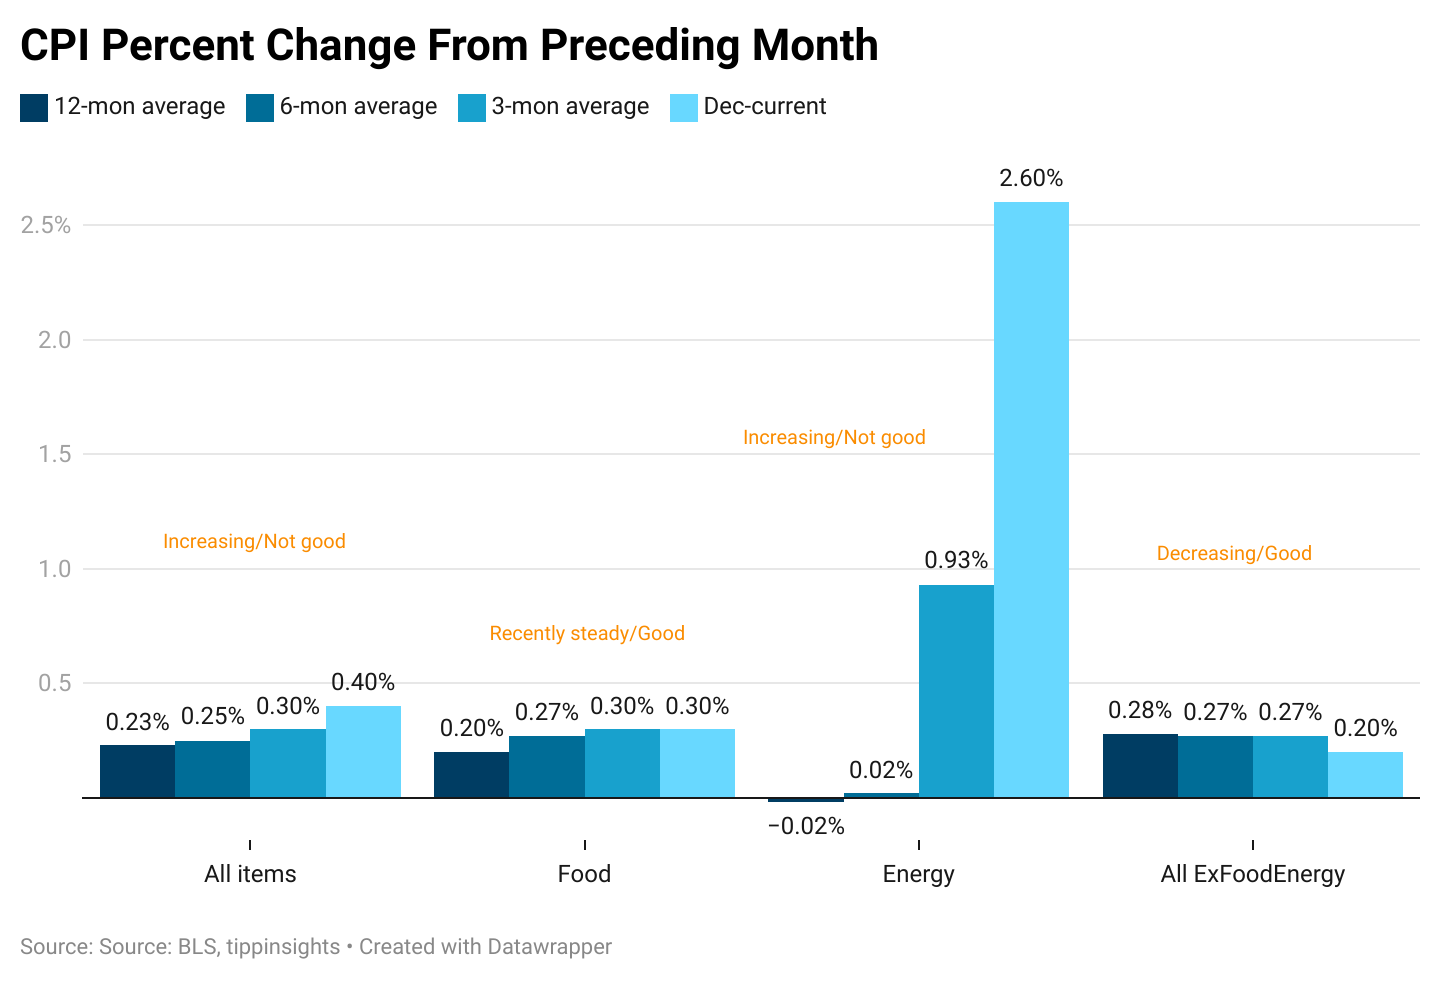
- All Items: The latest increase of 0.40% is slightly above the 3-month average (0.30%), 6-month average (0.25%), and 12-month average (0.23%). This indicates a gradual uptick in recent months, suggesting that inflationary pressures remain persistent.
- Food Prices: December’s 0.30% increase aligns with the 3-month average (0.30%) and is slightly above the 6-month average (0.27%) and 12-month average (0.20%). This signals stable but still elevated food inflation, keeping pressure on household budgets.
- Energy Prices: Energy costs surged by 2.60% in December—far exceeding the 3-month (0.93%) and 6-month (0.02%) averages. This sharp increase reverses prior declines and raises concerns about renewed volatility in energy prices, which could drive broader inflation higher.
- Core Inflation (All Items Less Food and Energy): Core inflation came in at 0.20%, slightly below the 3-month (0.27%) and 6-month (0.27%) averages but matching the 12-month average (0.28%). This indicates a modest easing in price pressures, but inflation outside food and energy remains sticky.
Based on the above chart, we concluded as follows:
- This month, energy is the biggest inflation driver, raising concerns about renewed price volatility.
- Food inflation remains steady but elevated, keeping pressure on consumer spending.
- Core inflation shows slight easing, but underlying price pressures persist.
Biden’s legacy is written in red ink: 20% inflation, falling real wages, and trillions in new debt. For millions, his presidency meant higher prices, stagnant paychecks, and financial struggle unseen in decades.
Biden’s economy won’t just be a chapter in history—it’s a bill Americans will keep paying for years to come. As he exits, Americans are left with soaring debt, unaffordable homes, and wages that don’t stretch far enough. The scars of ‘Bidenflation’ won’t fade anytime soon.


