What it measures
The TIPP Geoeconomic Risk Index (GRI) is a monthly gauge, scaled 0 to 100, of the geoeconomic risk environment facing decision-makers: the pressure that geopolitics, trade policy, and global supply chains exert on the world economy. Higher readings mean more risk. It is purpose-built to track geoeconomic stress specifically, not general bad news. It is designed to rise when conflict, trade ruptures, or supply shocks threaten cross-border commerce, and to stay calm during economic episodes that are domestic or purely financial in nature.
It complements, rather than duplicates, the RCM/TIPP Economic Optimism Index. Where the Optimism Index measures how Americans feel about the economy, the Geoeconomic Risk Index measures the external forces acting on it.
The four pillars
The index is an equal-weighted composite of four pillars, three drawn from leading public data series and one from TIPP's own polling. The three external pillars account for 75% of the index, which grounds its claim to measure geoeconomic risk; the proprietary pillar contributes the remaining 25%.
- Geopolitical Risk. The Geopolitical Risk (GPR) Index by Dario Caldara and Matteo Iacoviello, a widely cited measure of conflict, war, and terrorism risk derived from newspaper text.
- Trade Policy Uncertainty. The Trade Policy Uncertainty (TPU) Index, by the same authors, measures media attention to tariff and trade policy turbulence.
- Supply-Chain Pressure. The Federal Reserve Bank of New York's Global Supply Chain Pressure Index (GSCPI), which aggregates global shipping, freight, and manufacturing-bottleneck data.
- Global Standing. TIPP's proprietary monthly polling on America's standing in the world, the one pillar that captures public perception of the United States' global position.
Why a polling pillar. The three external pillars measure what can be observed and counted: coverage of conflict, attention to trade policy, and the physical state of supply chains. They capture events and flows, but not how those events are perceived, and perception is what moves confidence, capital, and the credibility of American leverage. The Global Standing pillar supplies that missing dimension. It is also the one pillar that moves nearly independently of the other three, so it contributes new information rather than restating theirs. And it is what distinguishes this index from a re-weighting of public data: a quarter-century of proprietary TIPP polling that no other series can reproduce.
How it is built
Every pillar is processed identically, so the method is symmetric and reproducible.
First, each input is smoothed with a 3-month moving average to remove month-to-month noise. The index also publishes the raw inputs, so any reader can reproduce the smoothing exactly; we use a disclosed transform of each series, not a republication.
Second, each smoothed series is standardized against a frozen 2001 to 2019 baseline, a pre-pandemic normal era that includes two recessions but excludes the extraordinary 2020 to 2022 period. Because the baseline's average and variability are fixed, published history never revises when new data arrives.
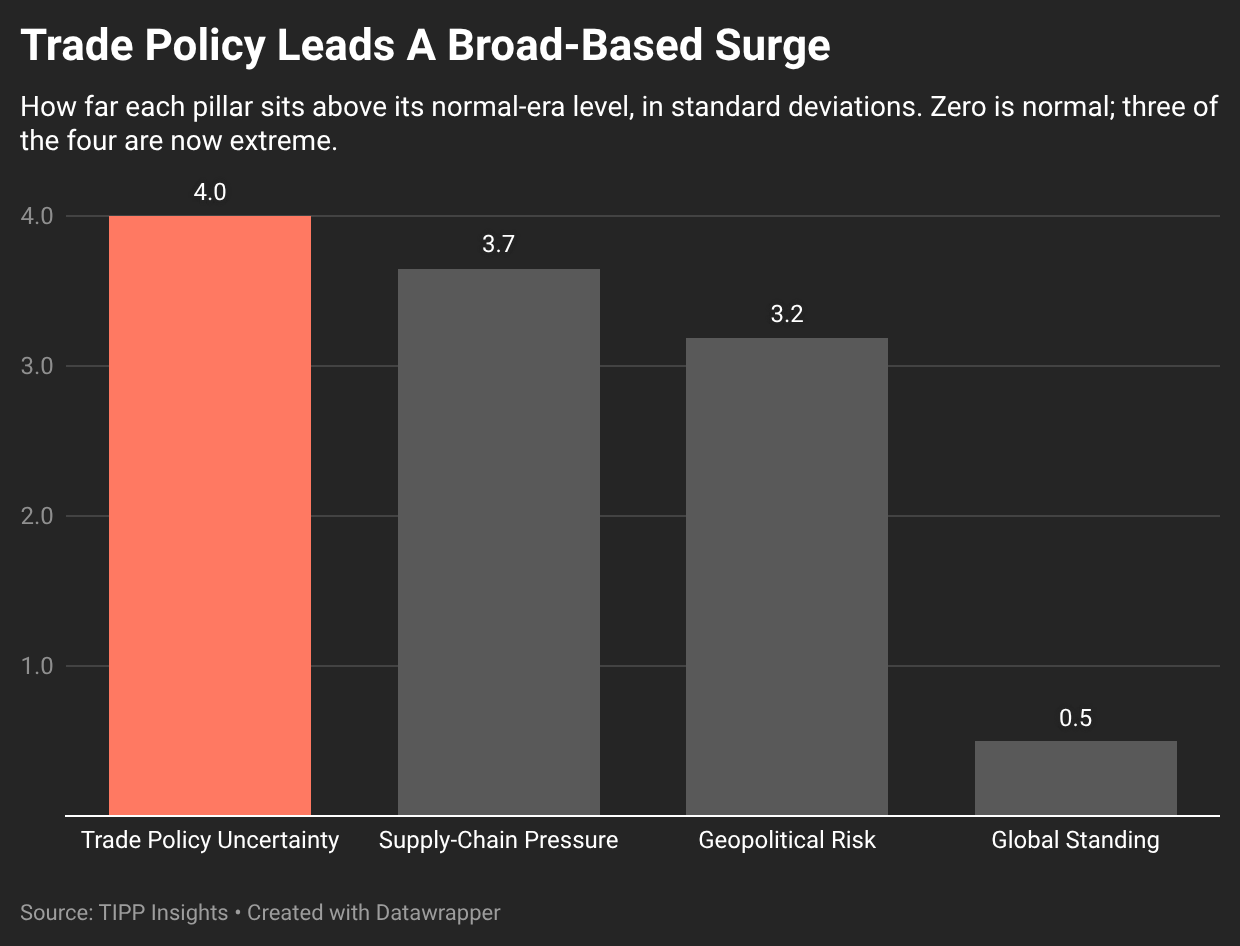
Third, each standardized value is mapped to a 0 to 100 scale via the normal distribution, so that a reading of 50 corresponds to average conditions of the 2001 to 2019 baseline era. Because each pillar is mapped to a bounded 0 to 100 scale, individual pillars can approach 100 in extreme periods, when conditions sit far into the tail of the normal-era distribution. To compare pillars in such periods, the standardized view, how many standard deviations each sits above its normal-era average, preserves the differences that the capped scale compresses.
Fourth, the three external pillars, where higher values mean more risk, and the inverted Global Standing pillar, where lower standing means more risk, are combined with equal 25% weights in the headline index.
How to read it
The index is bounded from 0 to 100 by construction. A reading of 50 marks the average conditions of the 2001 to 2019 normal era; above 50 is riskier than that baseline, below 50 is calmer. Over the full record, the index has ranged from 15.6 to 92.3. As a practical guide:
- Calm (below 35). The quietest tenth of the historical record.
- Normal (35 to 60). Conditions in the typical band of the past quarter-century.
- Elevated (60 to 80). Broad-based geoeconomic stress.
- Extreme (above 80). The upper edge of anything seen since 2001.
The latest complete reading, for May 2026, is 92.3, the highest in the 25-year record. Stress-testing shows this all-time high is robust: it remains the single highest reading under equal weights, under weightings tilted toward either the external pillars or the proprietary anchor, and under every smoothing window from two to six months. The reading is led primarily by trade-policy uncertainty; only by removing that pillar entirely does May 2026 slip from first to fourth, still within the top 1.3% of all months on record.
Does it work?
The index was validated against the major events of the past quarter-century. Two patterns establish that it measures what it claims to measure.
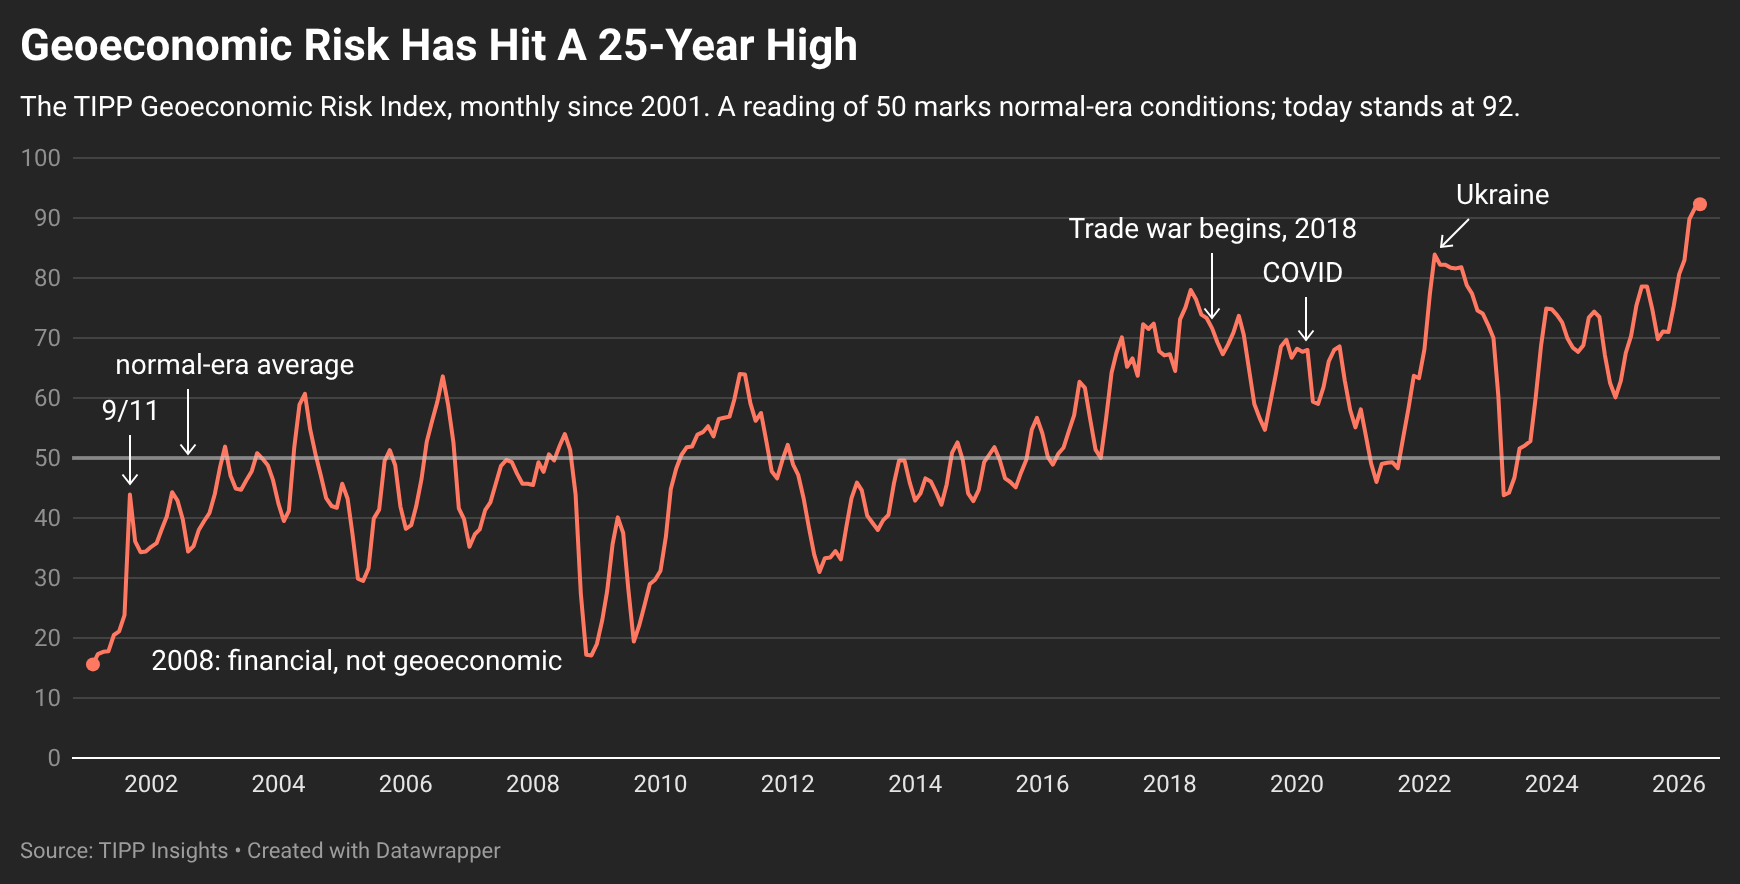
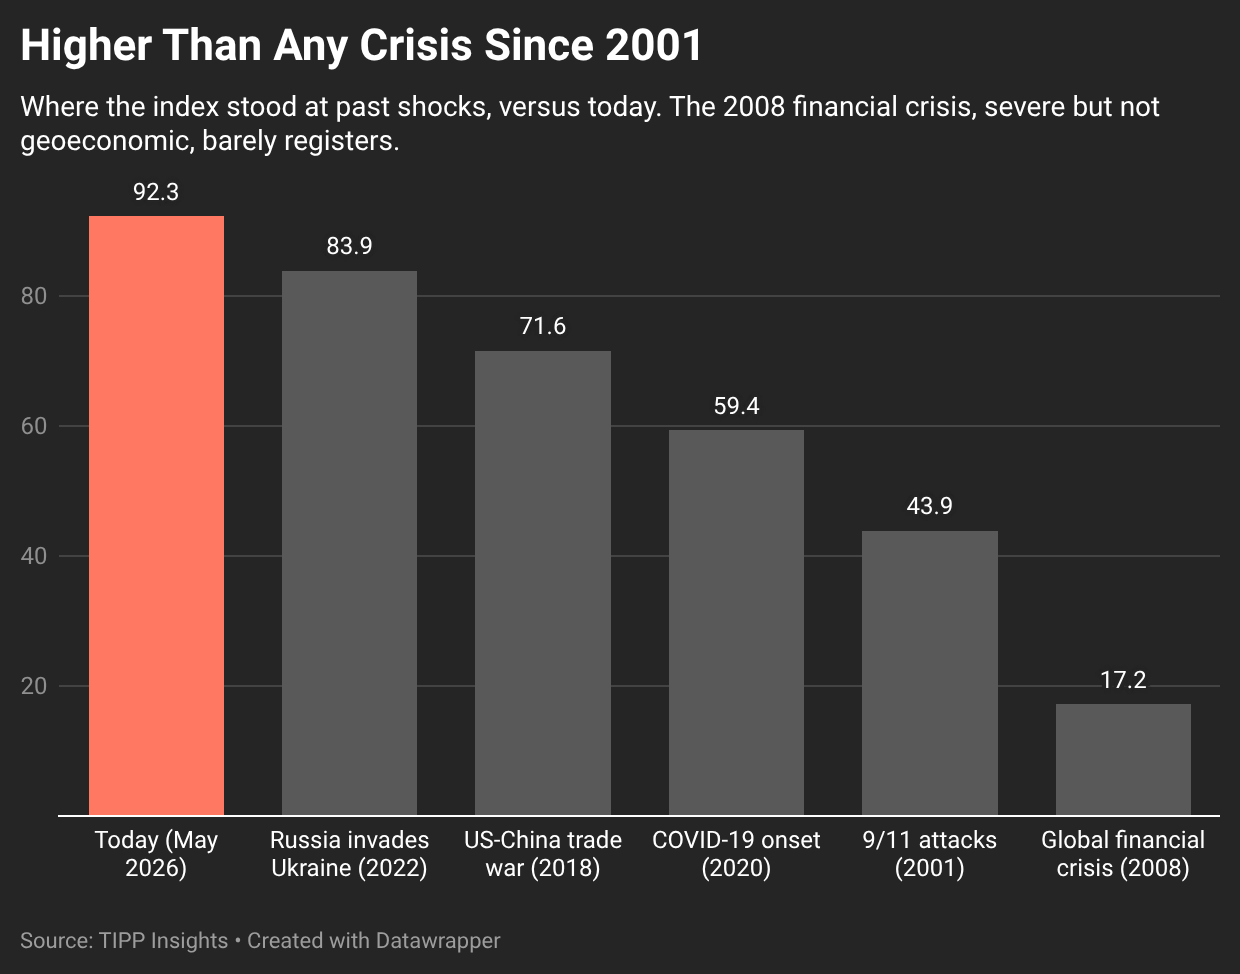
It rises for genuine geoeconomic shocks. From a calm 16 at the start of 2001, the index climbed to 44 after the September 11 attacks, 52 during the 2003 Iraq invasion, 58 in the 2011 Eurozone and US-downgrade crisis, 63 around the 2016 Brexit vote, 72 as the US-China trade war opened in 2018, 68 at the onset of COVID-19 in 2020, and 84 when Russia invaded Ukraine in 2022. The index also rewards breadth: single-domain shocks such as 9/11 register as moderate because a single pillar moves, while cross-domain crises such as the Ukraine crisis, which struck geopolitics, energy, and trade at once, produce the highest readings. For a geoeconomic gauge, that ranking is the correct behavior.
It stays calm for crises that are not geoeconomic. The clearest evidence is the 2008 Global Financial Crisis, the deepest economic shock in the entire window, during which the index fell from 44 in September 2008 to near its all-time low of 17 by November. A generic bad-times indicator would have spiked; the GRI stayed quiet, correctly, because the financial crisis involved no war, no trade rupture, and no supply shock. That non-reaction is the strongest demonstration that the index specifically tracks geoeconomic risk, rather than the mood of the headlines.
Data vintage, reproducibility, and revisions
This release reflects the data of record as of 9 June 2026, its “vintage,” meaning the dated snapshot of the figures as they stood on that day. The three external pillars are current through May 2026; TIPP polling is current through June 2026. Because the public series is published with a roughly one-month lag, the index reports through the last month for which all four pillars are available, currently May 2026, and the newest month populates once the external data are released, typically by mid-month.
Source inputs are archived and fingerprinted, so any published reading can be reproduced exactly from the data of record. Recent months may shift modestly as the underlying public series are revised by their providers; each release is therefore dated, and the figures cited are those of the stated vintage.
Disclosures
Component independence. TIPP's Standing in the World series is also one of six components of TIPP's National Outlook Index. The Geoeconomic Risk Index uses Standing on its own and does not include the National Outlook Index, so no signal is double-counted. Readers comparing the two indices should note that they share this single common input.
Fixed weights and re-baselining. The equal weights and the 2001 to 2019 baseline are held fixed to preserve comparability over time. The baseline will be re-anchored only periodically, on the order of once every five years, and any such change will be disclosed.
Attribution. The Geopolitical Risk and Trade Policy Uncertainty indices are the work of Dario Caldara and Matteo Iacoviello; the Global Supply Chain Pressure Index is published by the Federal Reserve Bank of New York. The TIPP Geoeconomic Risk Index is an independent composite that uses disclosed transforms of these series alongside TIPP's proprietary polling; it is not produced or endorsed by those providers.
Source data: Geopolitical Risk Index · Trade Policy Uncertainty Index · Global Supply Chain Pressure Index.
The TIPP Geoeconomic Risk Index is published monthly under Power & Capital. © TIPP Insights.


