Today, we are launching the Investor Outlook Index as the newest addition to the TIPP suite of economic indicators, joining the TIPP Economic Optimism Index and the TIPP Financial Stress Index. What makes this one different is not just what it measures, but who it measures. Every month, we break down investor sentiment across 33 demographic segments, covering age, gender, race, income, party affiliation, education, geography, and ideology. The result is a picture of not just whether Americans are bullish or bearish, but of exactly which demographics are driving the sentiment.
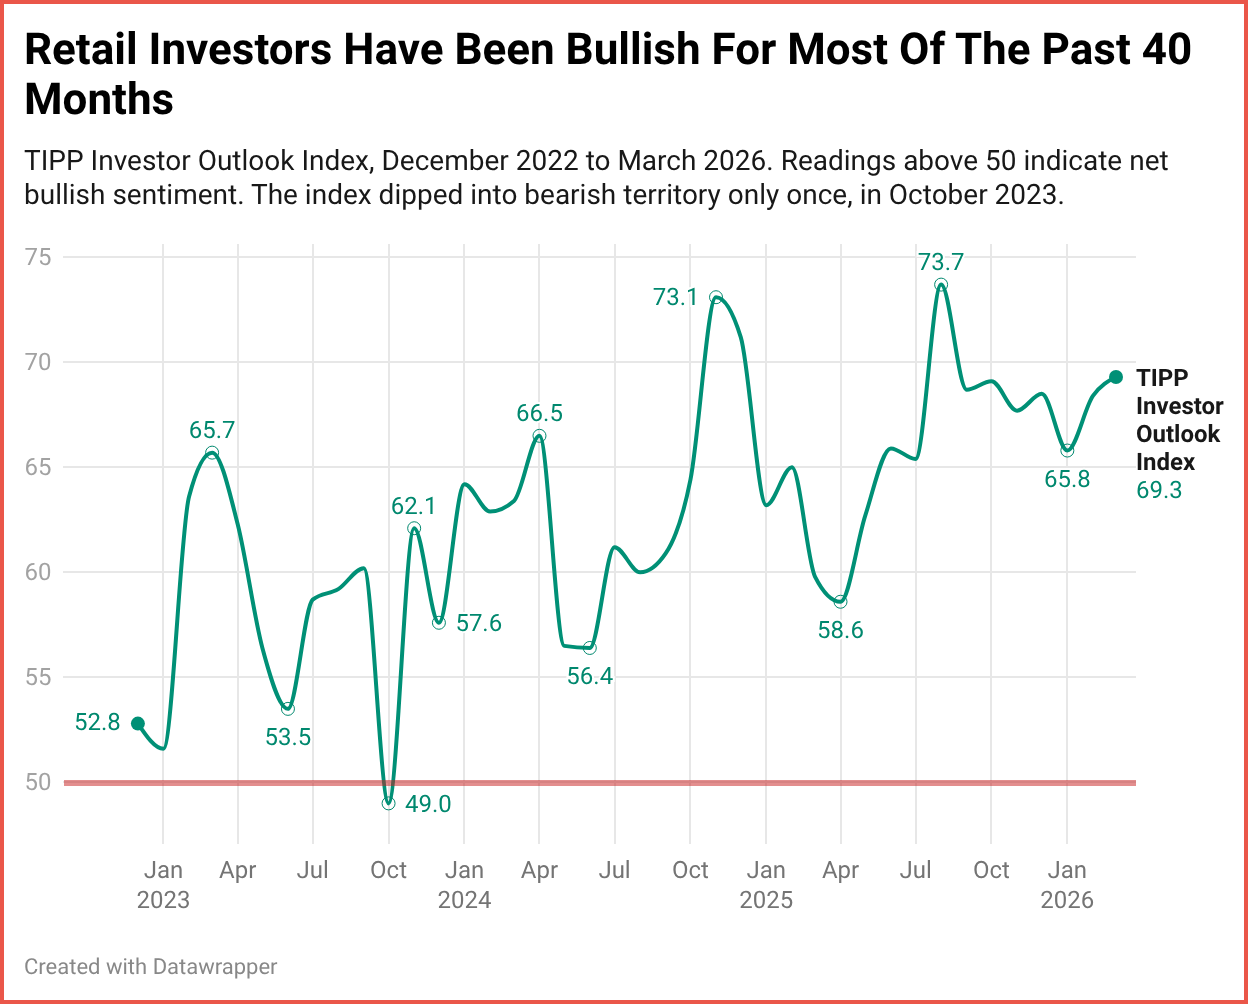
Retail investors are feeling good about the stock market right now. The TIPP Investor Outlook Index, a new monthly measure of how American investors view the market’s direction over the next six months, came in at 69.3 in March 2026. That puts it firmly in bullish territory for the eighth month in a row. But look beneath the surface, and a striking divide appears: Republican investors are now 27 points more bullish than Democrats. Just two years ago, Democrats held a 30-point lead. Something big has shifted.
How The Index Works
Each month, TIPP surveys approximately 1,400 adults nationwide. The online survey uses TIPP’s panel network to obtain the sample. From that pool, we identify 400 to 500 investors, defined as people who currently have at least $10,000 invested in the stock market in individual stocks or mutual funds, either personally or jointly with a spouse, held directly or through a retirement plan such as a 401(k).
Each investor is asked one single question: “In your opinion, the direction of the stock market over the next six months will be: up (bullish), no change (neutral), or down (bearish).”
We calculate the index using a simple diffusion formula: Index = 50 + 0.5 × (%Bullish − %Bearish). The Index centers at 50. When more investors say “up” than “down,” the index rises above 50. When bears outnumber bulls, it falls below. A reading of 75 reflects strong optimism. A reading of 40 reflects widespread pessimism. The Index is designed to be intuitive.
March 2026: What The Data Shows
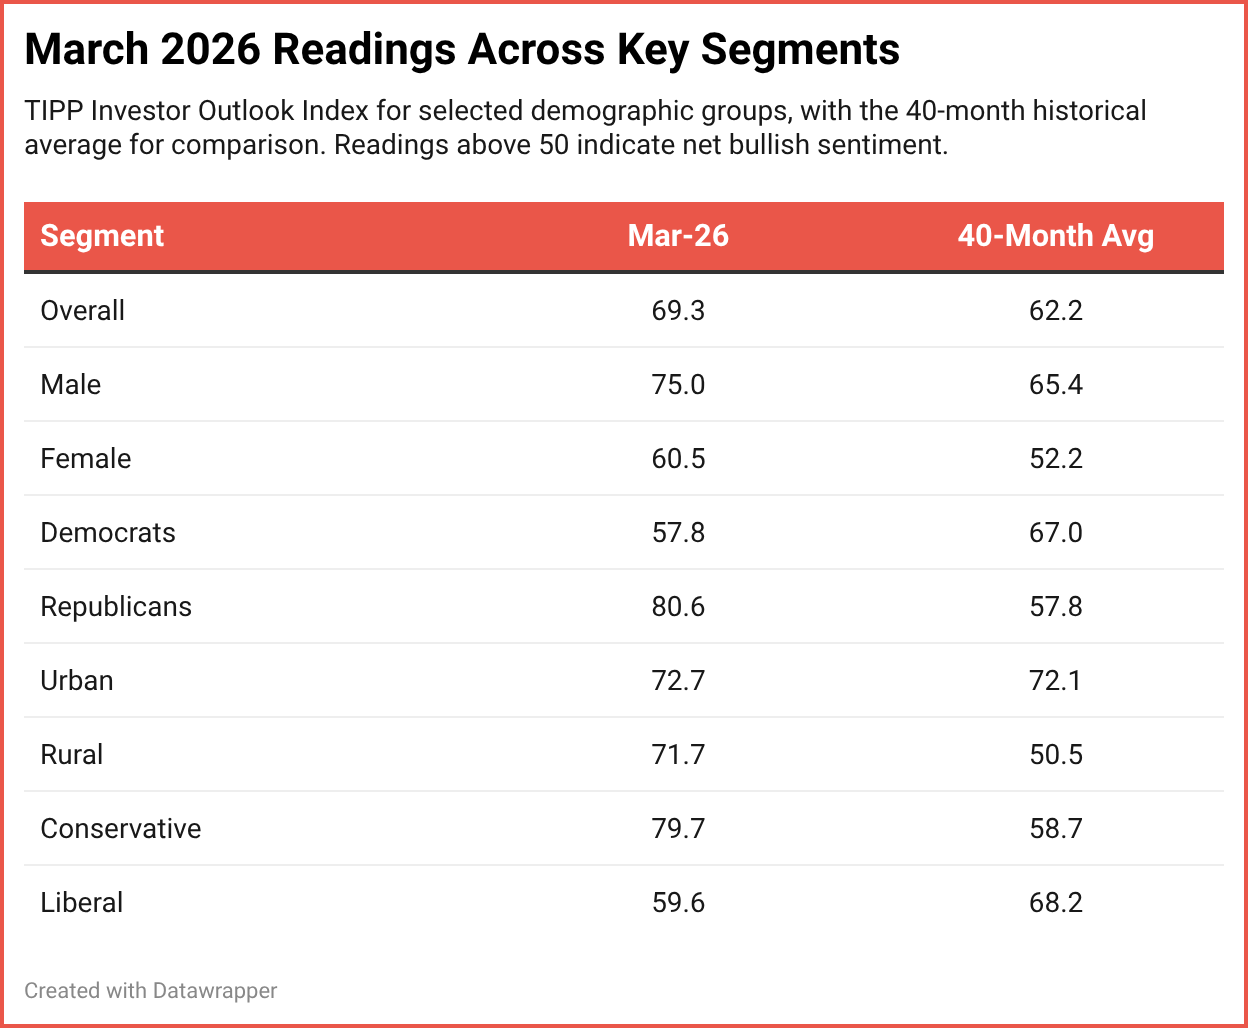
For March, the overall reading of 69.3 places current sentiment in the upper range of our 40-month historical dataset, which goes back to December 2022. Here are some of the key splits:
The Partisan Reversal
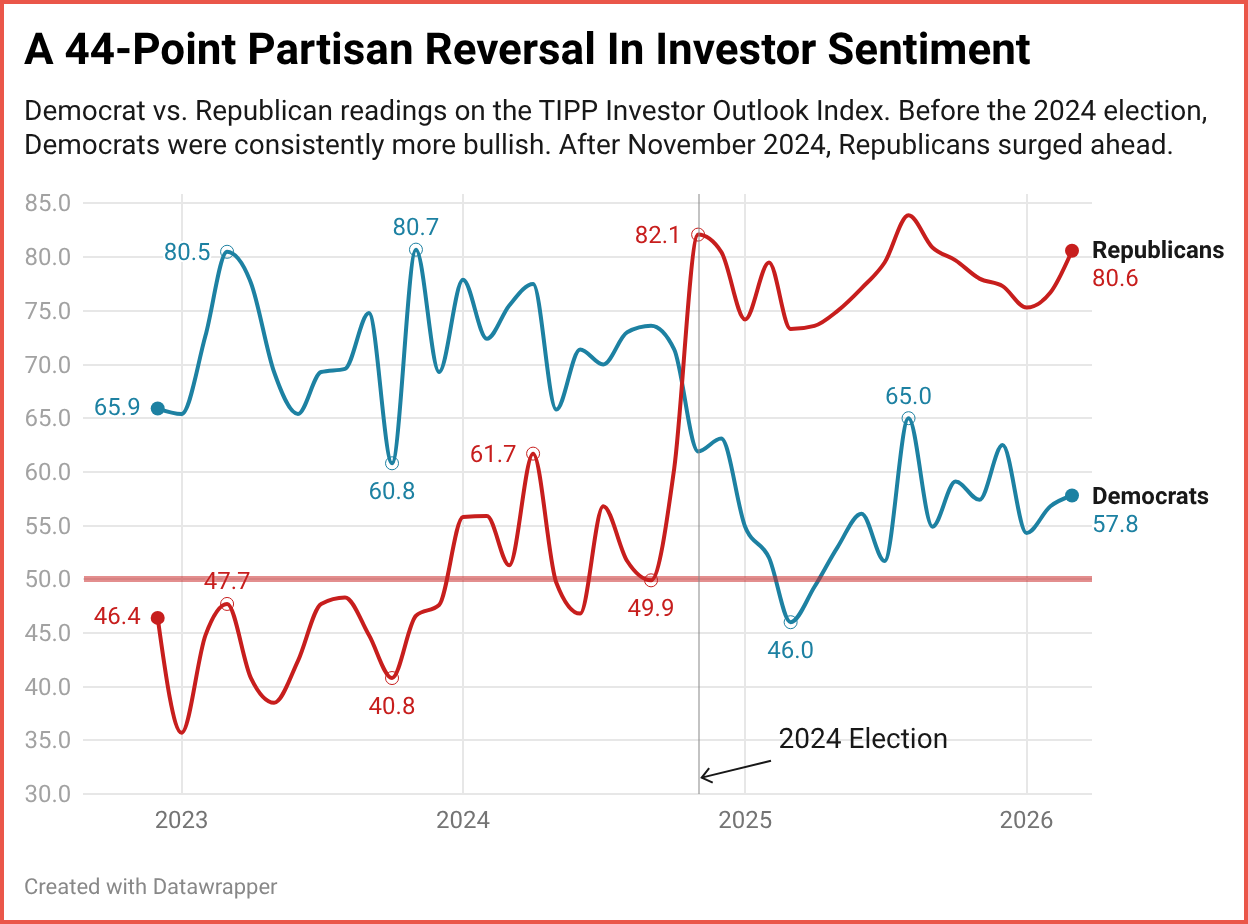
If there is one finding that stands out across 40 months of data, it is the complete inversion of partisan sentiment after the November 2024 election.
From December 2022 through October 2024, Democrat investors averaged a reading of 71.7, compared to 47.8 for Republicans. That is a gap of nearly 24 points. Republican investors were, on average, barely above the neutral line for almost two full years.
Then came the November 2024 elections. Republican investor sentiment surged from 60.3 to 82.1, a jump of 21.8 points in a single month. It was the largest one-month move for any major demographic group in the history of the index. Democrat sentiment, meanwhile, dropped from 71.4 to 61.9.
Since the election, the gap has averaged 20 points in the opposite direction, with Republicans at 77.1 and Democrats at 57.1. Add it all up, and you get a 44-point partisan reversal. It is a powerful reminder of how deeply political identity shapes the way Americans feel about money and markets, even when the question is as specific as where the stock market is headed.
40 Months Of History: What The Index Has Shown
Over the past 40 months, the index has ranged from a low of 49.0 in October 2023 to a high of 73.7 in August 2025. That October 2023 reading is notable: it remains the only time the index has dipped into bearish territory in the entire dataset.
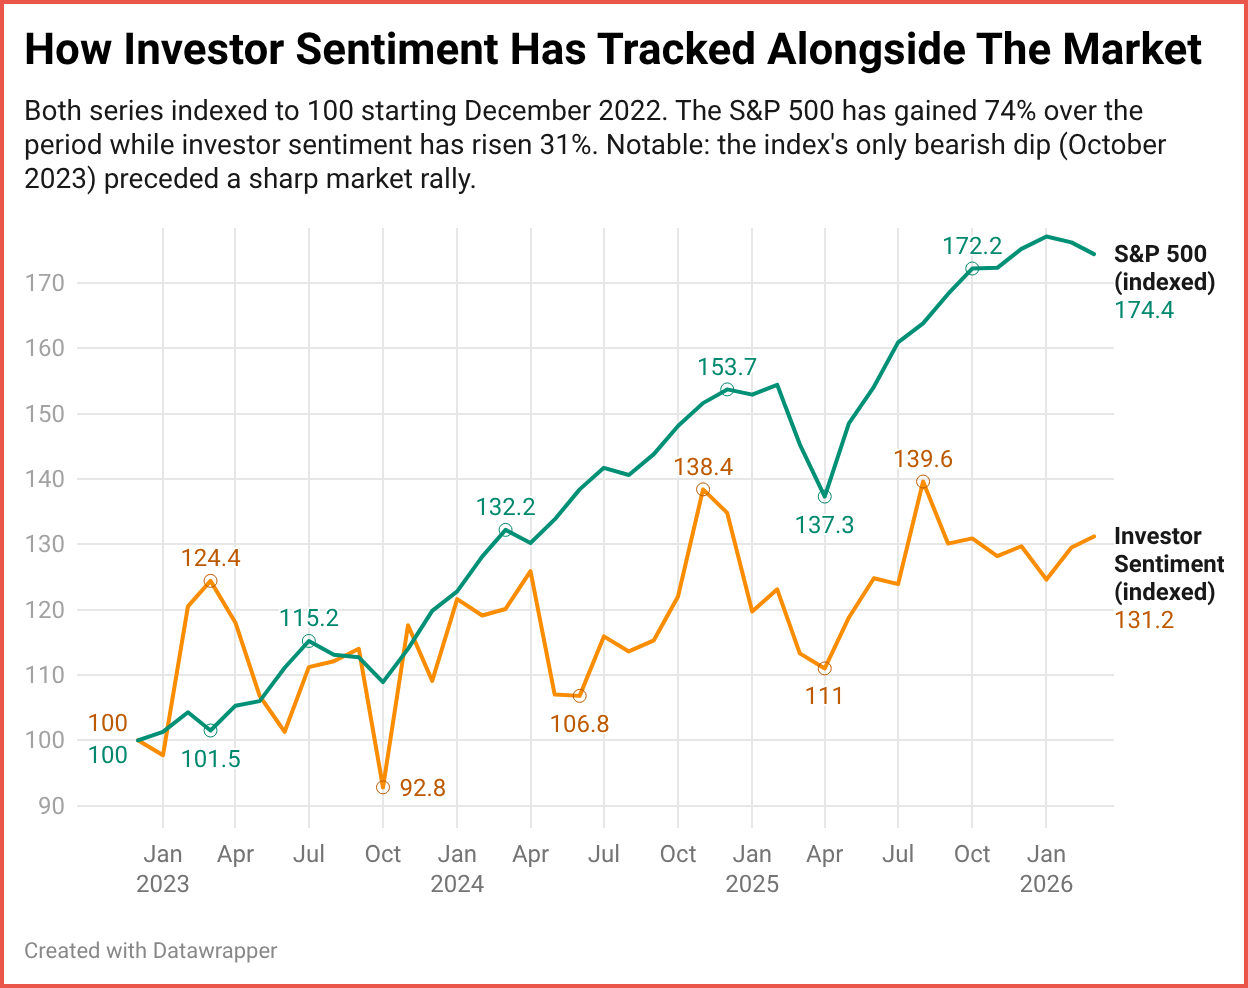
What followed deserves attention. Over the three months that followed, the S&P 500 rallied 12.8%, climbing from 4,259 to 4,804. Whether that makes the Index a useful contrarian signal is a question we will keep testing as the dataset grows. Still, it is a striking data point for anyone watching retail investor behavior.
The spring of 2025 offered another interesting moment. The Index dipped to 58.6 and 59.8 in March and April, mirroring a market pullback that took the S&P 500 down to 5,370. Both sentiment and the market recovered sharply by summer. It is the kind of real-time alignment between what investors feel and what the market does that makes tracking this data worthwhile.
Where Bullish And Bearish Investors Are Putting Their Money
Knowing which direction investors expect the market to go is useful. Knowing where they are actually putting their money makes it actionable. Each month, we also ask investors which investments they consider the best right now, allowing them to select up to two options. The results reveal a sharp divide between bulls and bears.
Among bullish investors, Stocks dominate at 46%, followed by Gold/Silver at 27% and Crypto at 26%. Bulls are clearly leaning into risk assets and growth plays.
Bearish investors tell a very different story. Their top pick is Gold/Silver at 33%, followed by Savings and Cash at 24% and Real Estate at 19%. Stocks drop to just 18% among bears, and Crypto falls to 8%. These investors are in defensive mode, favoring safe havens and tangible assets.
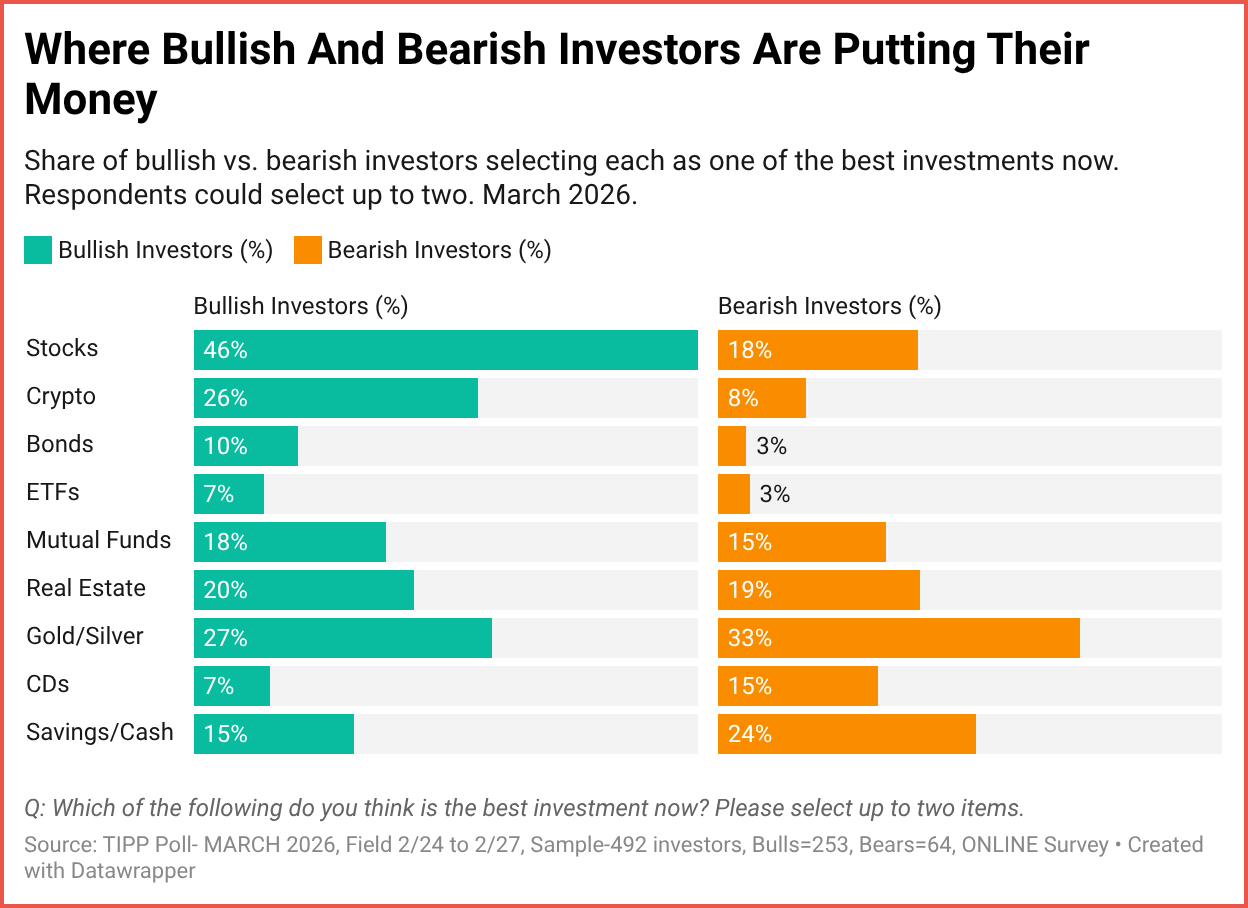
The contrast is a window into how outlook shapes behavior. It is not just that bulls and bears disagree about where the market is headed. They are making fundamentally different choices about where to put their money right now.
What Makes This Index Different
There are already a few well-known investor sentiment measures out there. The AAII Investor Sentiment Survey has been running for decades. The University of Michigan Consumer Sentiment Index captures broad economic attitudes.
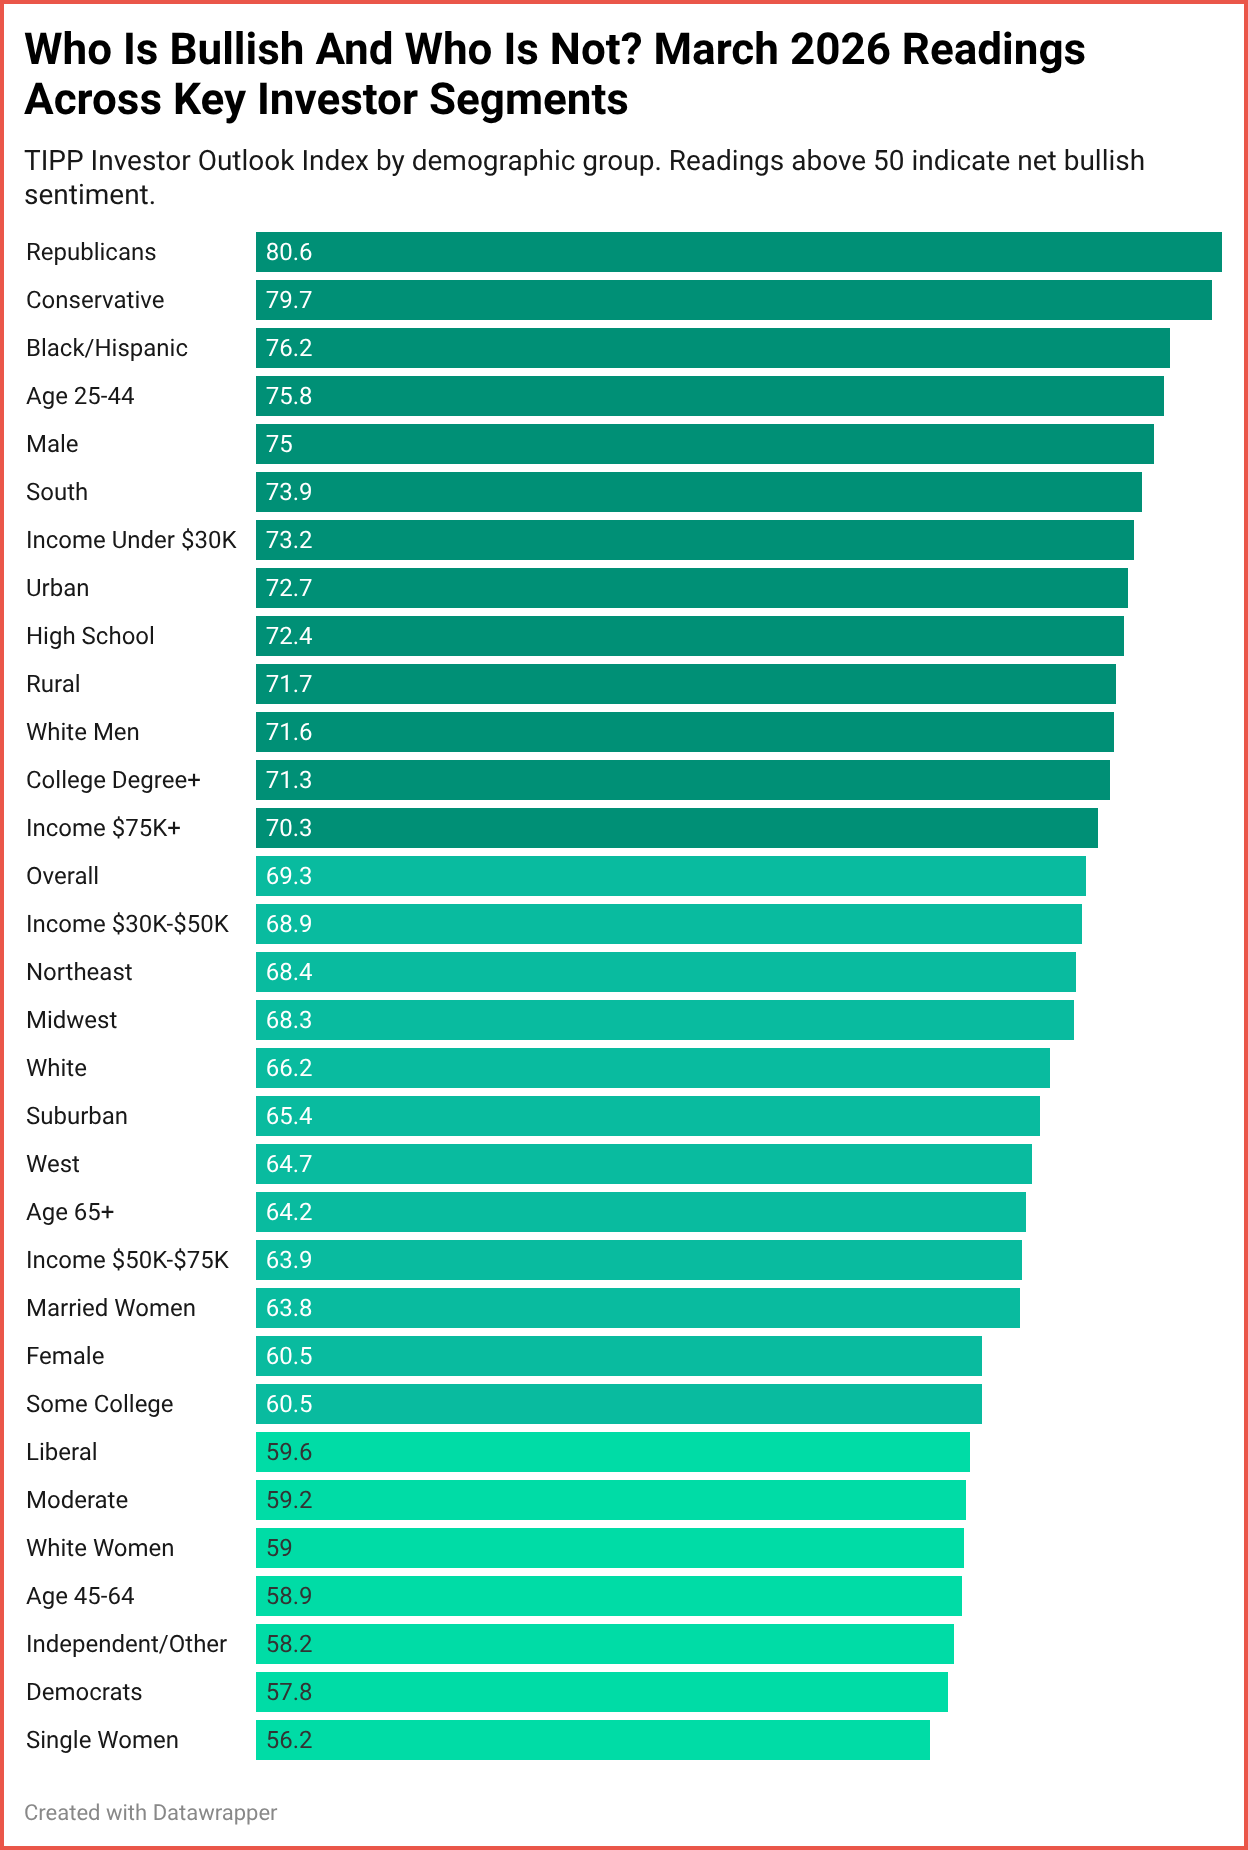
What the TIPP Investor Outlook Index adds is demographic depth. No other publicly available sentiment measure breaks down investor expectations by party affiliation, income bracket, education level, geographic region, race, gender, ideology, and area type, all at once, every single month.
That depth matters, because sentiment is never monolithic. In March 2026, male investors registered 75.0 while female investors came in at 60.5. Conservative investors were at 79.7 while liberals read 59.6. The headline number alone misses those fault lines entirely.
For market strategists, media analysts, and researchers who want to understand not just the direction of sentiment but whose sentiment is driving it, this index fills a gap that has been there for a long time.
Part Of The TIPP Economic Indicator Suite
The Investor Outlook Index joins two established TIPP measures: the TIPP Economic Optimism Index, which tracks confidence in the broader economy, and the TIPP Financial Stress Index, which measures personal financial pressure. Together, these three indicators tell a layered story about American economic life: how people feel about the economy as a whole, how stressed they are about their own finances, and where they expect the stock market to go next.
The Investor Outlook Index will be released monthly on tippinsights.com. We look forward to tracking these trends alongside our readers in the months ahead.
The full methodology statement is available for download. The complete 33-segment data table for March 2026, along with the 40-month historical dataset, is available to subscribers and institutional partners. Download the full package here for free.
The TIPP Stack
Handpicked articles from TIPP Insights & beyond
1. ‘It’s A Very Surreal War’— Victor Davis Hanson, The Daily Signal
2. With Friends Like These…— Editorial Board, TIPP Insights
3. Trump’s China Gambit— Editorial Board, TIPP Insights
4. Xi Chooses Trump Over Tehran— Editorial Board, TIPP Insights
5. What’s Behind Beijing’s Restraint?— Editorial Board, TIPP Insights
6. The Dragon’s Fragility— Editorial Board, TIPP Insights
7. The War Iran Forced— Larry Kudlow, Fox Business
8. US Allies Rebuff Trump’s Request For Support In Strait Of Hormuz— Reuters Staff, The Daily Signal
9. More Than 60K Americans Evacuated Middle East Since Iran War Began— Elizabeth Troutman Mitchell, The Daily Signal
10. Cuba’s National Electric Grid Collapses, Leaving Millions Without Power— Dave Sherwood, The Daily Signal
11. Monroe Doctrine 2.0: U.S. Over China in Latin America— Steve Cortes, The Daily Signal
12. Media Is In A Tizzy Because We Give Troops Good Food Sometimes— Jarrett Stepman, The Daily Signal
13. White House Responds To Don Lemon On The First Amendment— Tyler O'Neil, The Daily Signal
14. Who’s Whispering in Your Chatbot’s Ear?—Marc Faddoul, Project Syndicate
15. College Education Flunks Out — By More Than 2-To-1, Voters Say It's Not Worth It: I&I/TIPP Poll—Terry Jones, TIPP Insights
16. Democrats Push DOJ To Prosecute Kristi Noem After Trump Ousts Her From DHS— Fred Lucas, The Daily Signal
17. SCOTUS Agrees To Hear Trump Bid To Rein In Temporary Protected Status—Fred Lucas, The Daily Signal
18. ‘REFUSE’: Top Trump Official Advises Medical Students Pressured To Perform Abortions— Elizabeth Troutman Mitchell, The Daily Signal
19. Democrat-Passed Law May Have Allowed Shooter To Enter Old Dominion Undetected— Virginia Grace McKinnon, The Daily Signal
20. Union Suit Claims Trump-Airport Security Rule Ousted Immigrant Workers— Fred Lucas, The Daily Signal
21. Echoes Of Ezra: ‘America Reads The Bible’ Event To Gather Leaders To Rededicate Nation To God—Al Perrotta, The Daily Signal
📊 Market Mood — Thursday, March 19, 2026
🟩 Central Banks Hold Steady Amid Rising Uncertainty
Global policymakers kept rates unchanged while warning that inflation risks are building.
🟧 Oil Surges Above $110 on Energy Infrastructure Attacks
Crude prices jumped sharply as escalating strikes in the Middle East heightened supply concerns.
🟦 Stocks Slide as Stagflation Fears Grow
European markets fell as investors weighed slowing growth alongside rising inflation pressures.
🟨 Dollar Gains as Investors Turn Defensive
Risk-off sentiment pushed flows into the U.S. dollar as expectations for near-term rate cuts faded.
🗓️ Key Economic Events — Thursday, March 19, 2026
🟧 08:30 ET — Philadelphia Fed Manufacturing Index (Mar)
Regional survey offering an early read on manufacturing activity and business conditions.
🟧 08:30 ET — Initial Jobless Claims
Weekly unemployment filings provide a timely snapshot of labor market trends.
🟧 10:00 ET — New Home Sales (Jan)
Tracks sales of newly built homes, a key indicator of housing market strength.
editor-tippinsights@technometrica.com