- Bidenflation has reached 17.0%, indicating significant inflation under President Biden's policies
- Most Americans are concerned about inflation and a majority feel their wages have not kept up with rising prices
- Real wages have generally declined during President Biden's term, with a return to negative territory in September
- The U.S. economy is facing stagflation, marked by stagnant growth and high inflation
Earlier this week, we delved into two critical aspects of Biden's economic policies.
First, a sober article addressing consumer confidence titled "Bidenomics Crushes Economic Confidence."
Then, the follow-up: "Bidenomics Drives Americans' Financial Stress to Its Highest Levels Since December 2008."
We are neither obsessed with Bidenomics nor enjoy writing about it.
We're forced to do so for two compelling reasons: First, the corporate media is too busy to cover crucial issues like the nation’s financial stress epidemic and how Bidenomics has shattered Americans' economic confidence to smithereens. Second, the administration's chorus often verges on the territory reminiscent of Baghdad Bob, and the drive-by media is too lazy and quite happy to accept White House statements prima facie without any scrutiny.
Ask yourself this: how many stories in the corporate media have tackled Bidenflation? How many have explored the topic of Americans’ financial stress? After you read this piece, let us know if a single media outlet explained the dishonesty of Biden's White House's recent claims about core inflation and how they played you with statistics.
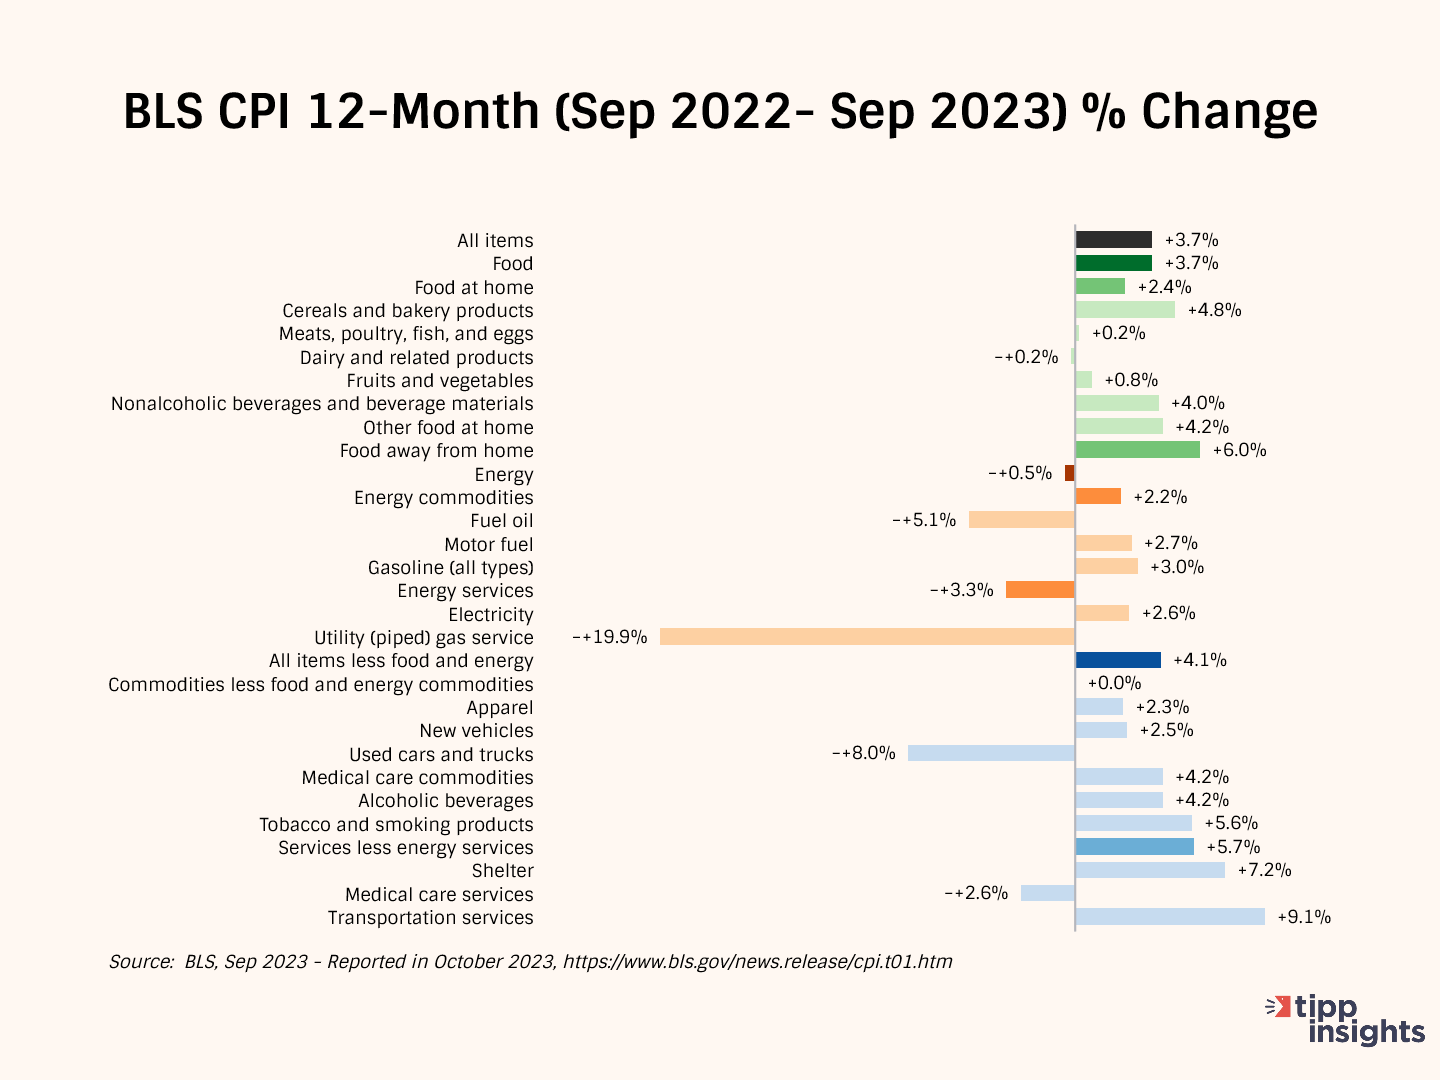
The Consumer Price Index (CPI) released by the government on Wednesday showed a 3.7% year-over-year price increase from September 2022 to September 2023.
The CPI rate had declined steadily from a 40-year high of 9.1% in June 2022 to 3.0% in June 2023 for 12 consecutive months. In July, it broke that run and increased to 3.2%, and further increased for the second month in August to 3.7% and remained at 3.7% in September.
The CPI rose 0.4% between August 2023 and September 2023 after adjusting for seasonality and at 0.2% on an unadjusted basis. In the same period, Food rose by 0.2%, Energy by 1.5%, and All items except food and energy (Core) by 0.3%.
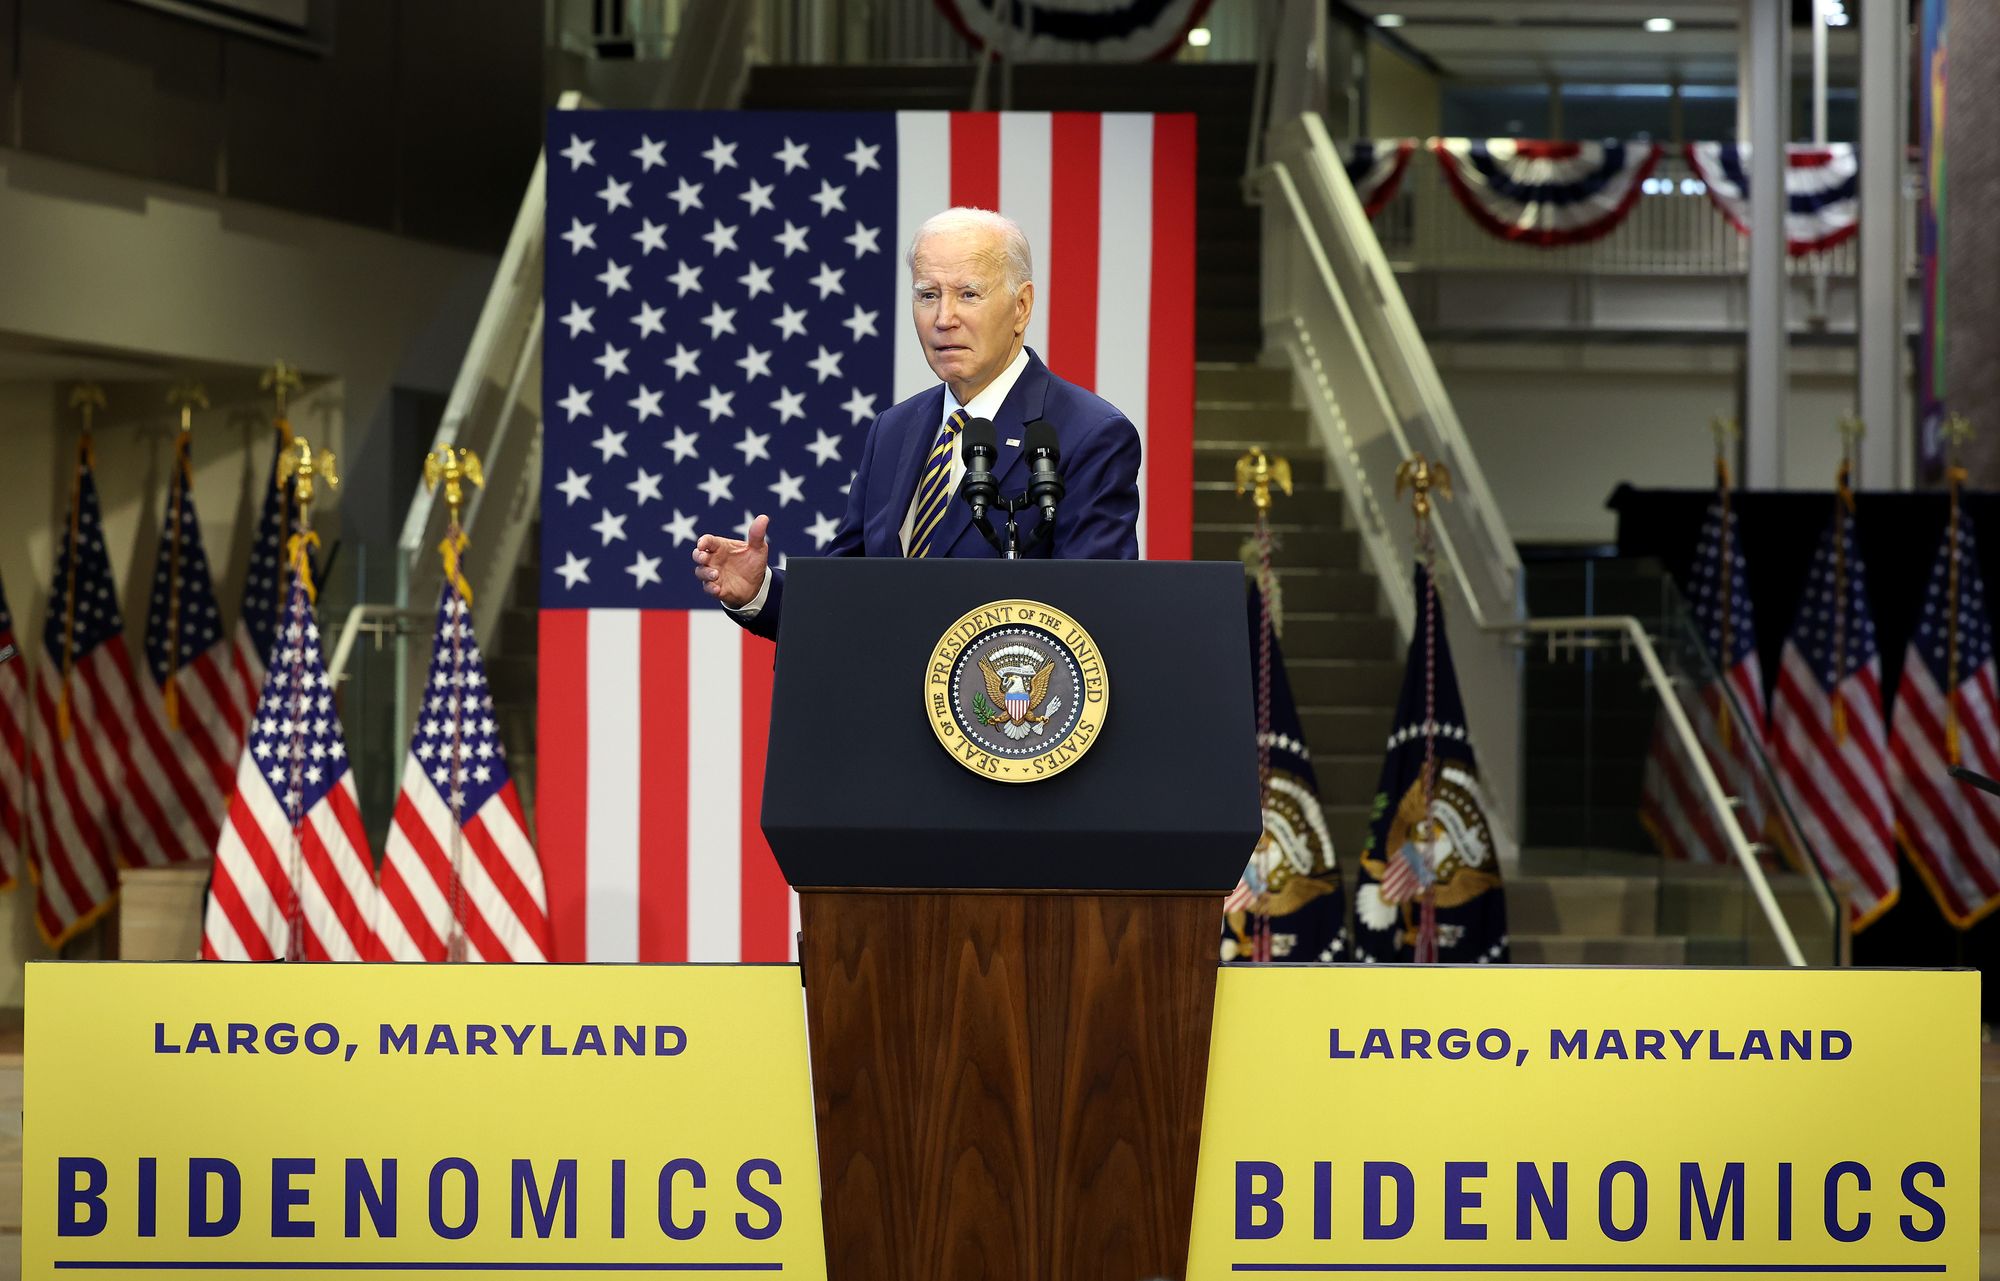
President Biden took a victory lap for Bidenomics:
This morning’s report shows core inflation fell to its lowest level in two years. Overall inflation is down by 60% from its peak at a time when unemployment has remained below 4% for 20 months in a row and the share of working-age Americans in the workforce is the highest in 20 years. That’s Bidenomics in action. I’ll continue to fight to build an economy from the middle out and bottom up—even as Republicans in Congress make reckless threats to weaken our economy, prioritize tax cuts for the wealthy and large corporations, and push for deep cuts to programs that are essential for hardworking Americans and seniors.
That was only partially correct for three reasons:
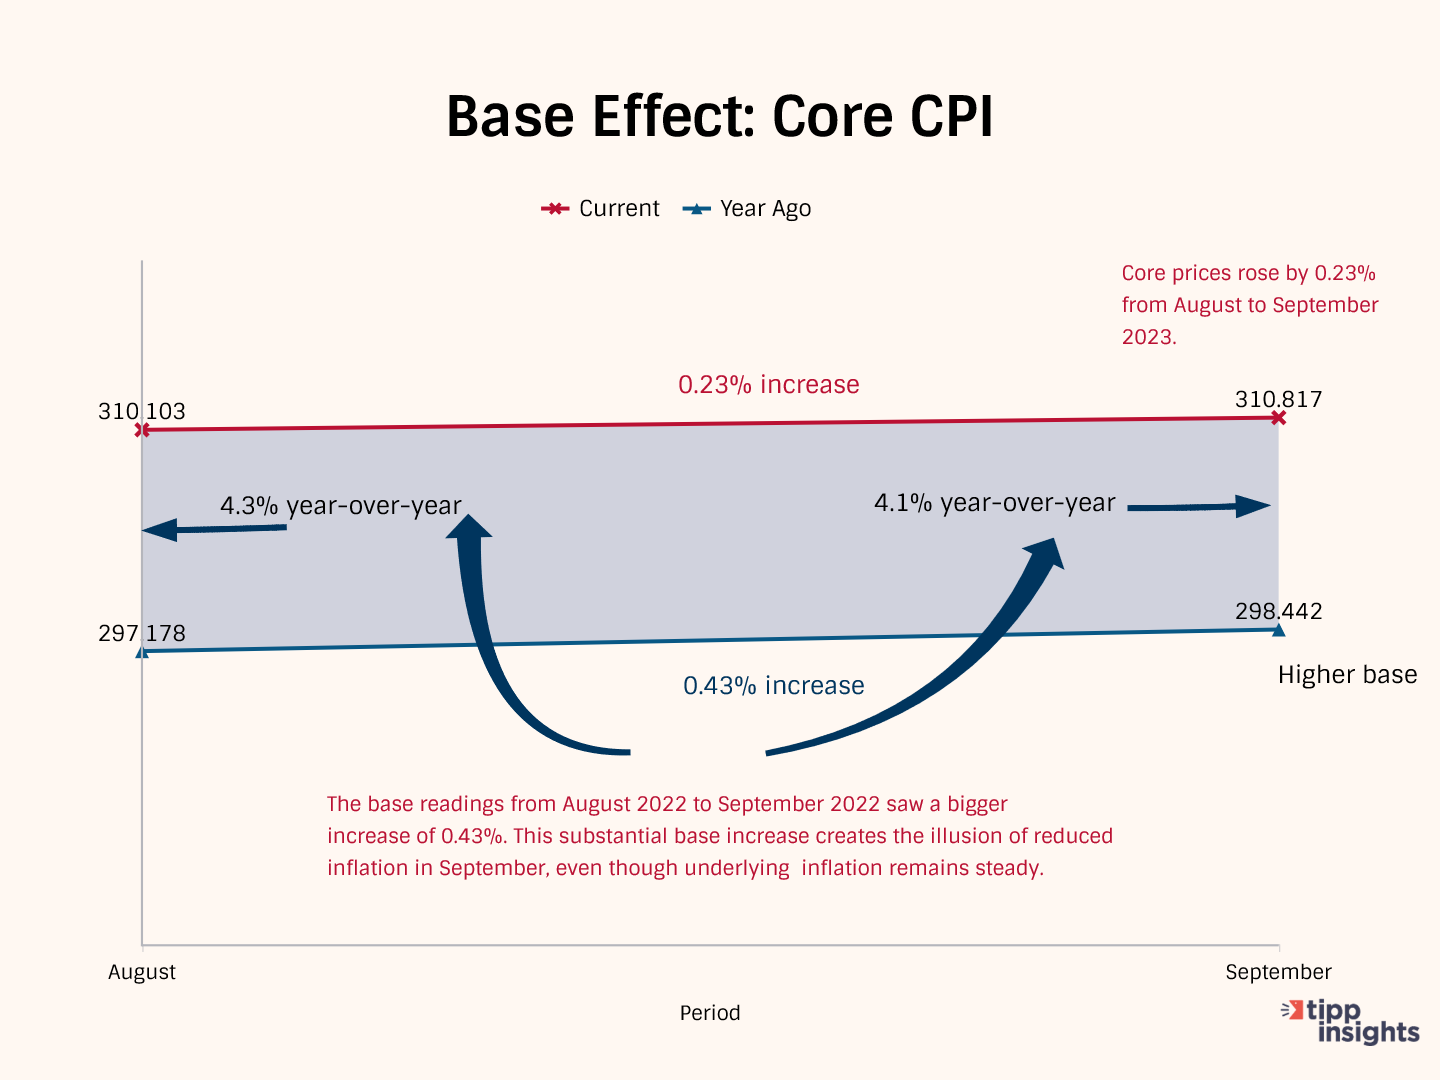
- Presenting a decrease in core inflation from 4.3% to 4.1% as a significant ‘victory’ without acknowledging the role of the base effect is dishonest, as it overlooks a crucial factor affecting the comparison of inflation rates.
- See the chart below. Core prices rose by 0.23% from August to September 2023. The base readings from August 2022 to September 2022 saw a bigger increase of 0.43%. This substantial base increase creates the illusion of reduced inflation in September, even though underlying inflation remains steady.
- Furthermore, on a seasonally adjusted basis, the August to September core increase of 0.3% is higher than the 3-month average of 0.27%, indicating an acceleration. (Please see the chart towards the end of this article.)
The dark shadow of Bidenomics is 17.0% inflation under Biden’s watch. His policies are a complete and utter failure that has led to stagflation in the United States.
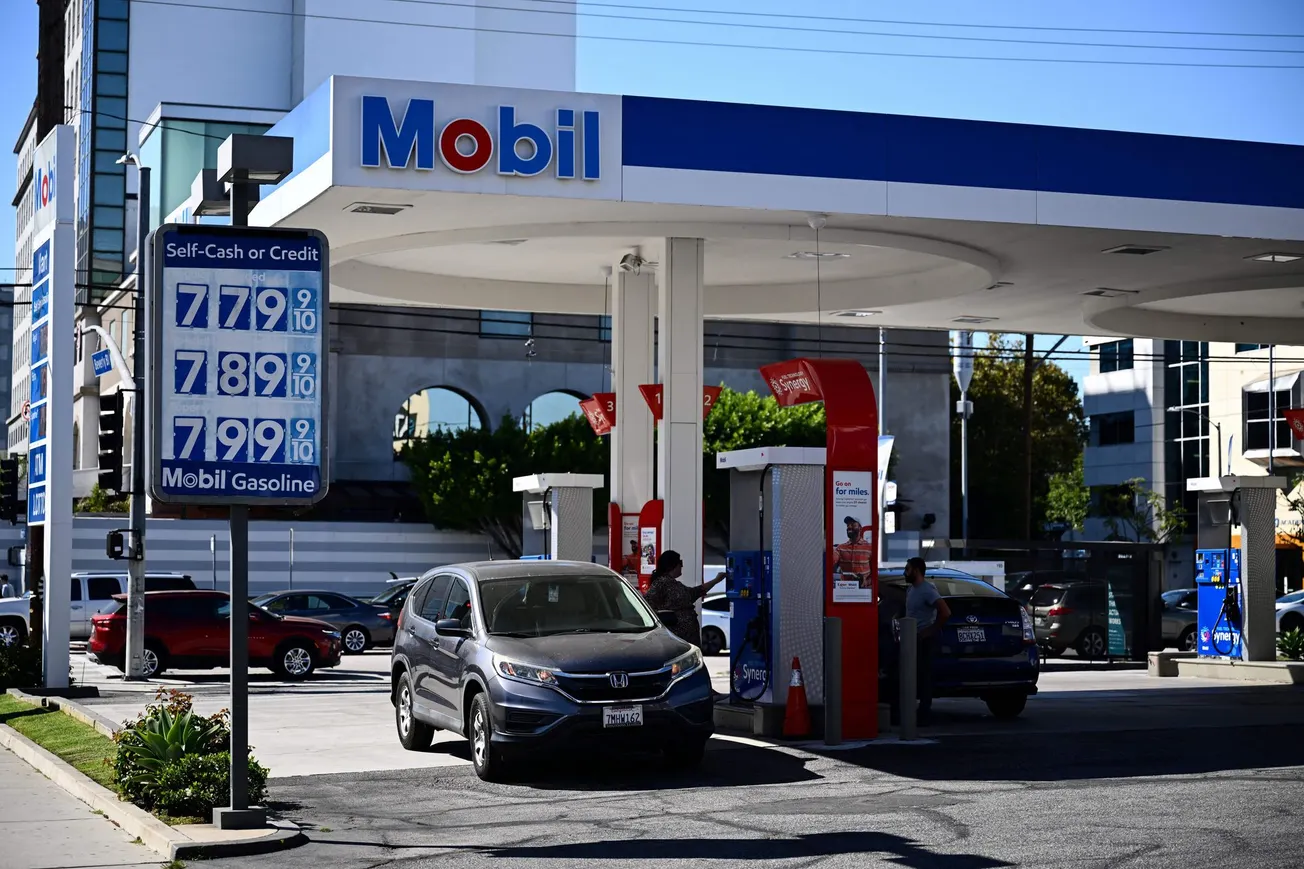
President Biden’s energy policies are inflicting great pain on Americans. He deliberately pursued policies pushing the U.S. from energy independence to dependence. Our energy dependence enriches Russia’s war chest. Meanwhile, we depleted our strategic petroleum reserve (SPR) to gain an advantage in the midterms, potentially compromising our national security.
The Biden economy continues to be the worst-performing going back to President Carter. Since February 2021, the first full month of President Biden's term, the prices of various commodities, including food, gasoline, used cars, and air tickets, have consistently increased. Although the rate of increase has slowed, prices are still rising monthly.
As we have noted numerous times, President Biden's reckless spending has resulted in inflation levels not seen in 40 years. The U.S. economy will experience an extended period of stagflation characterized by stagnation and accompanied by inflation.
TIPP CPI
We developed the TIPP CPI, a metric that uses February 2021, the month after President Biden's inauguration, as its base. All TIPP CPI measures are anchored to the base month of February 2021, making it exclusive to the economy under President Biden's watch.
We use the relevant data from the Bureau of Labor Statistics (BLS) to calculate the TIPP CPI, but we adjust the period to Biden's tenure. CPIs are like index numbers that show how prices affect people's lives, similar to how the Dow Jones Industrial Average reflects the stock market.
When discussing the TIPP CPI and the BLS CPI, we convert the index numbers into percentage changes to better understand and compare them.
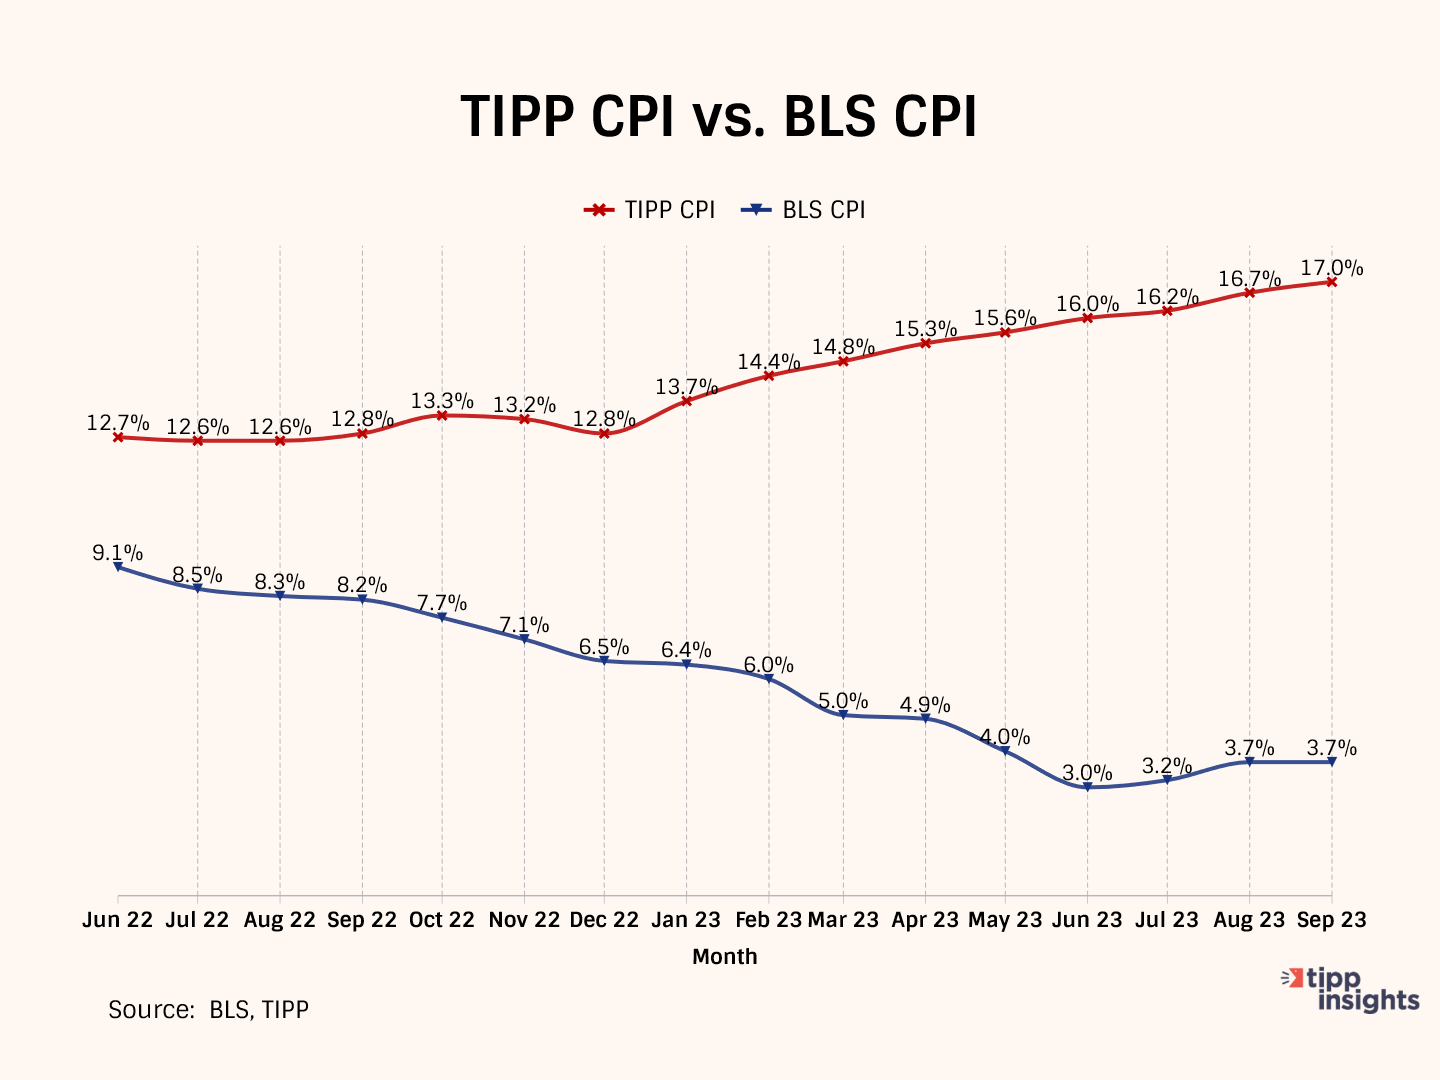
Bidenflation, measured by the TIPP CPI using the same underlying data, reached 17.0% in August. It was 16.7% in August, 16.2% in July, and 16.0% in June.
By the middle of 2022, significant inflation had already taken hold. In September 2022, CPI inflation stood at 8.2 percent. While the official BLS CPI year-over-year increases will compare prices to already inflated bases in the coming months, these statistics might mask the full impact.
TIPP CPI vs. BLS CPI
The following four charts present details about the new metric.
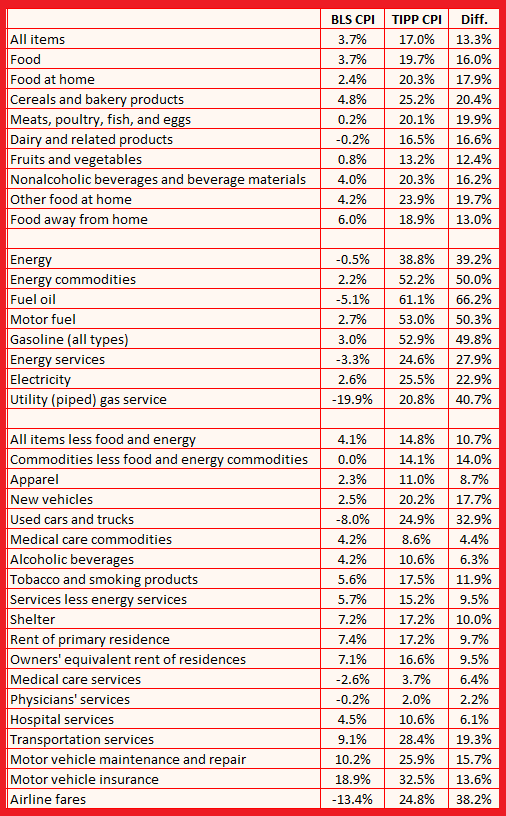
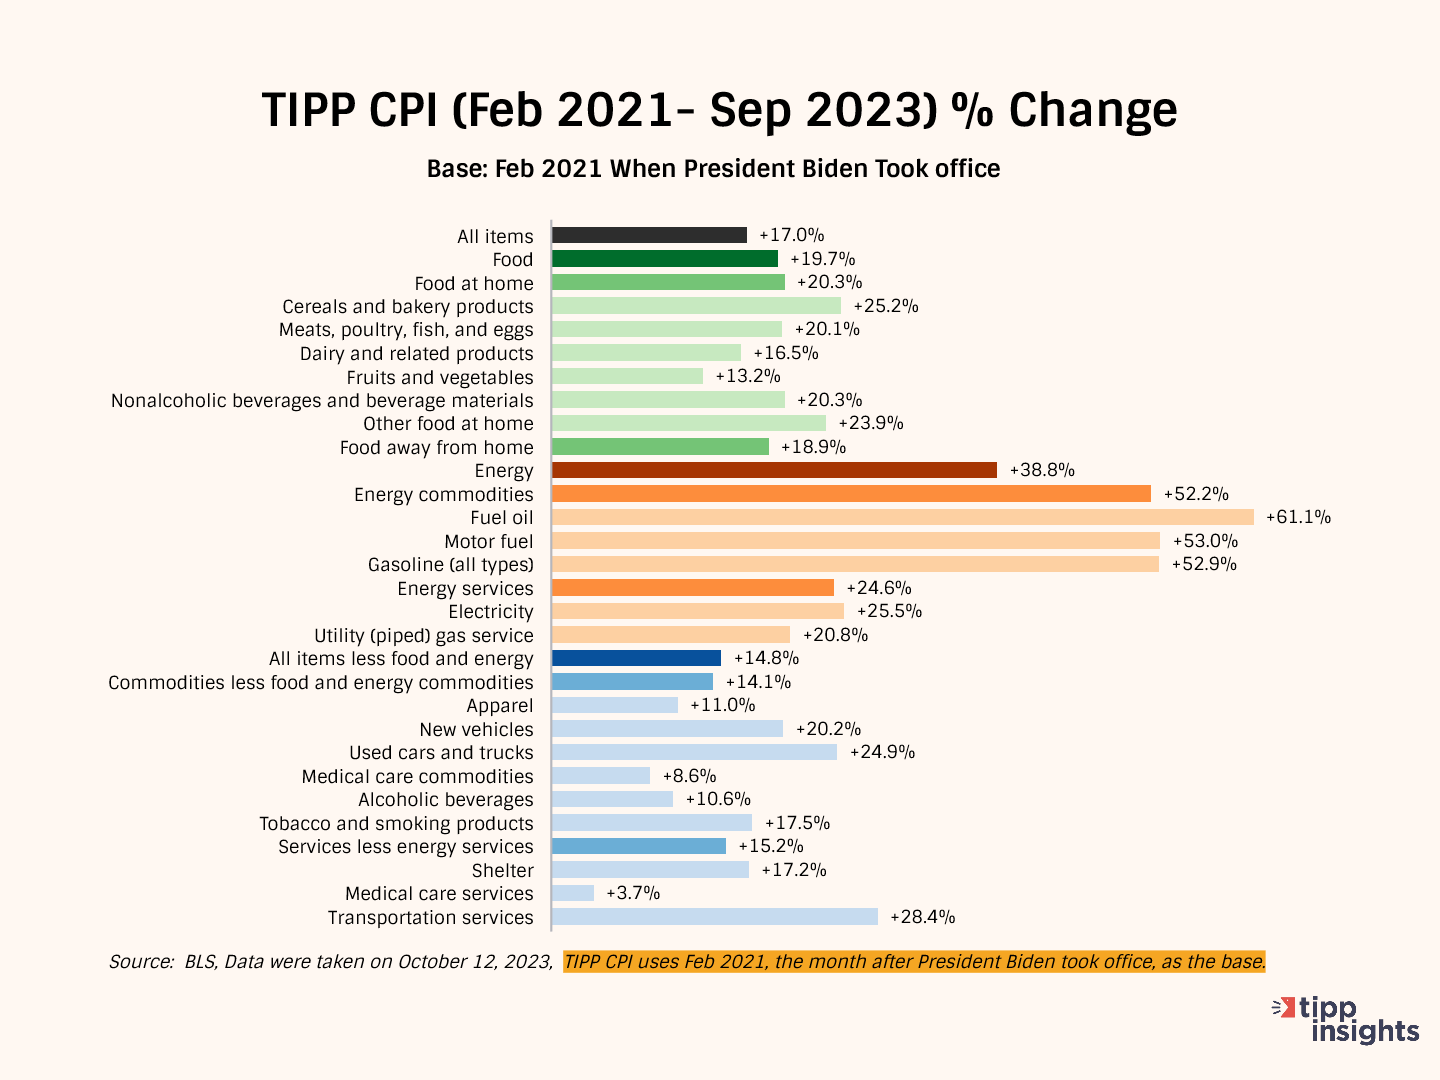
The annual CPI increase reported by BLS is 3.7% for September 2023. Compare this to the TIPP CPI of 17.0%, a 13.3-point difference. Prices have increased by 17.0% since President Biden took office. On an annualized basis, TIPP CPI is 6.4%.
Food prices increased by 19.7% under Biden compared to only 3.7% as per BLS CPI, a difference of 16.0 points.
TIPP CPI data show that Energy prices increased by 38.8%. But, according to the BLS CPI, energy prices improved by 0.5%. The difference between the two is a whopping 39.2 points.
The Core CPI is the price increase for all items, excluding food and energy. The Core TIPP CPI was 14.8% compared to 4.1% BLS CPI in the year-over-year measure, a 10.7-point difference.
Further, Gasoline prices have increased by 52.9% since President Biden took office, whereas the BLS CPI shows that gasoline price has increased by 3.0%, a difference of 49.8 points.
TIPP CPI finds that Used car prices have risen by 24.9% during President Biden's term. The BLS CPI shows that the prices have dropped by 8.0%, a difference of 32.9 points.
Inflation for air tickets under President Biden is 24.8% compared to the BLS CPI’s finding of an improvement of 13.4%, a difference of 38.2 points.
Americans' Concerns
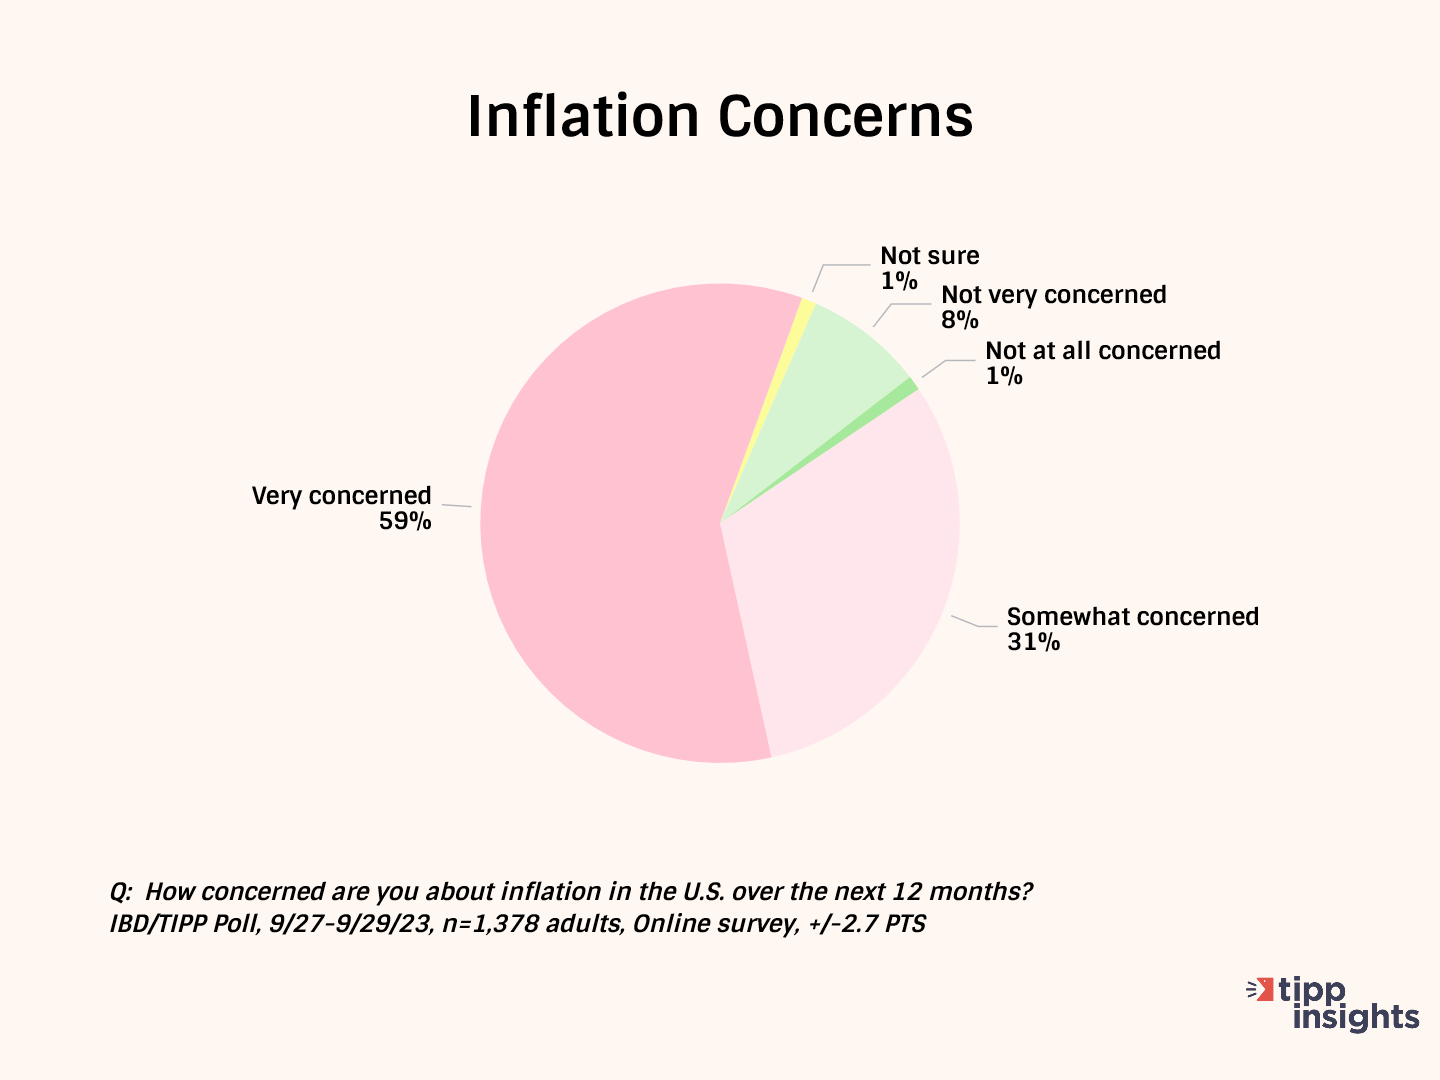
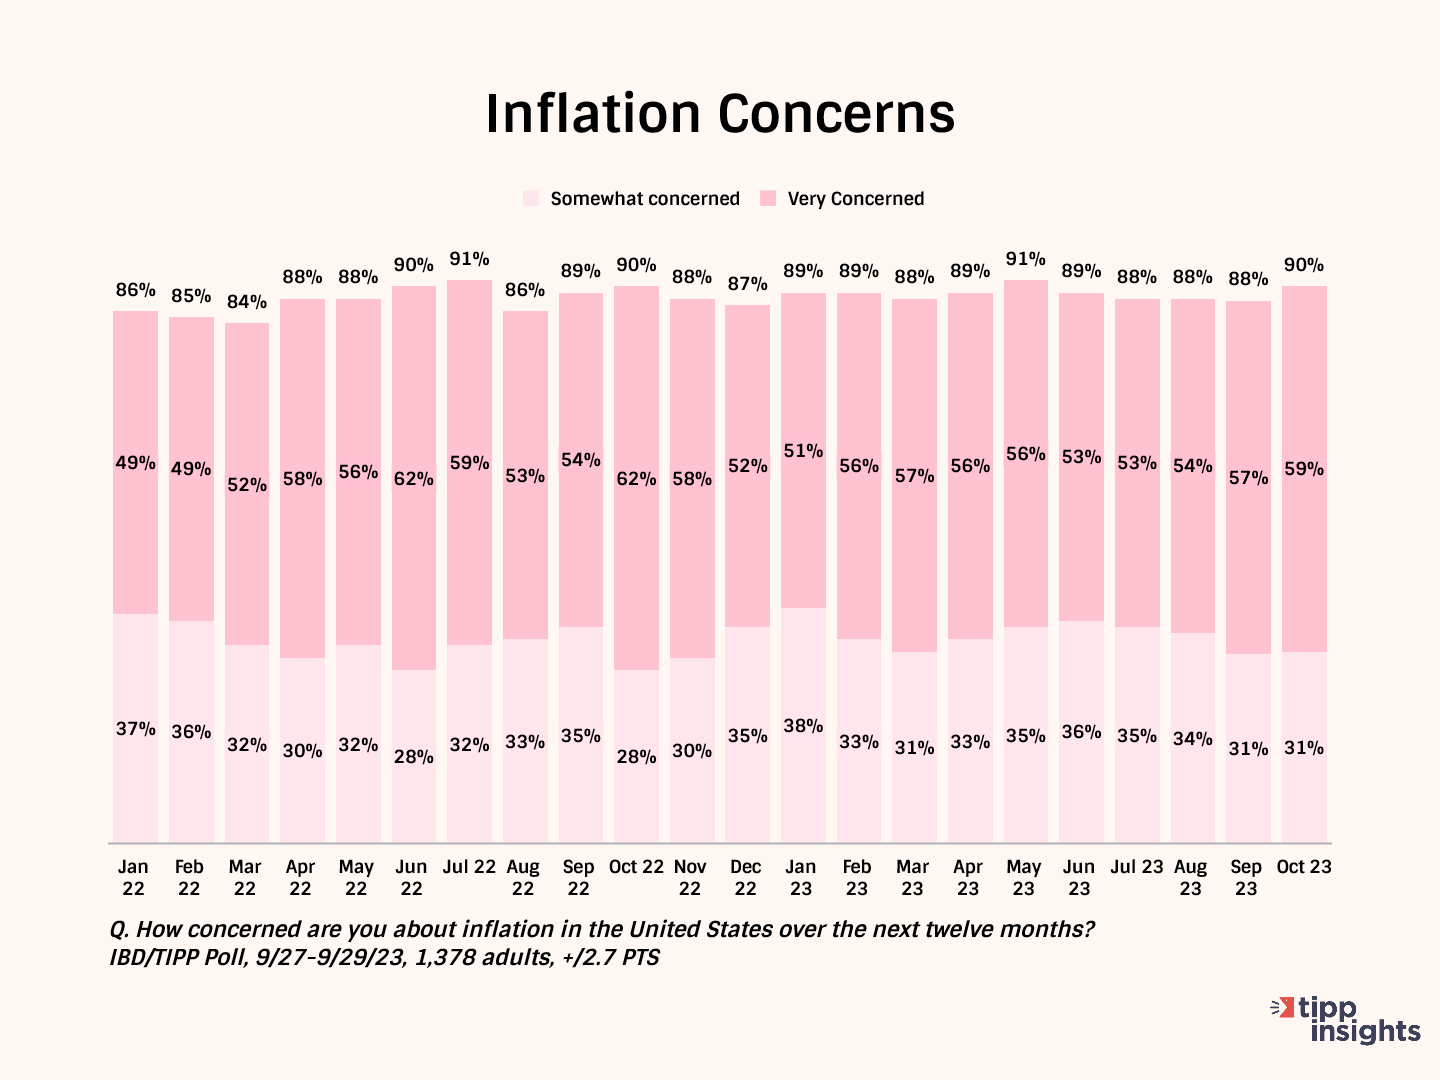
The latest Investor's Business Daily/TIPP Poll, completed earlier this month, shows nine in ten (88%) survey respondents are concerned about inflation. Throughout the past year, inflation concerns have stayed above 85%. The "very concerned" share has been over 50% for twenty months.
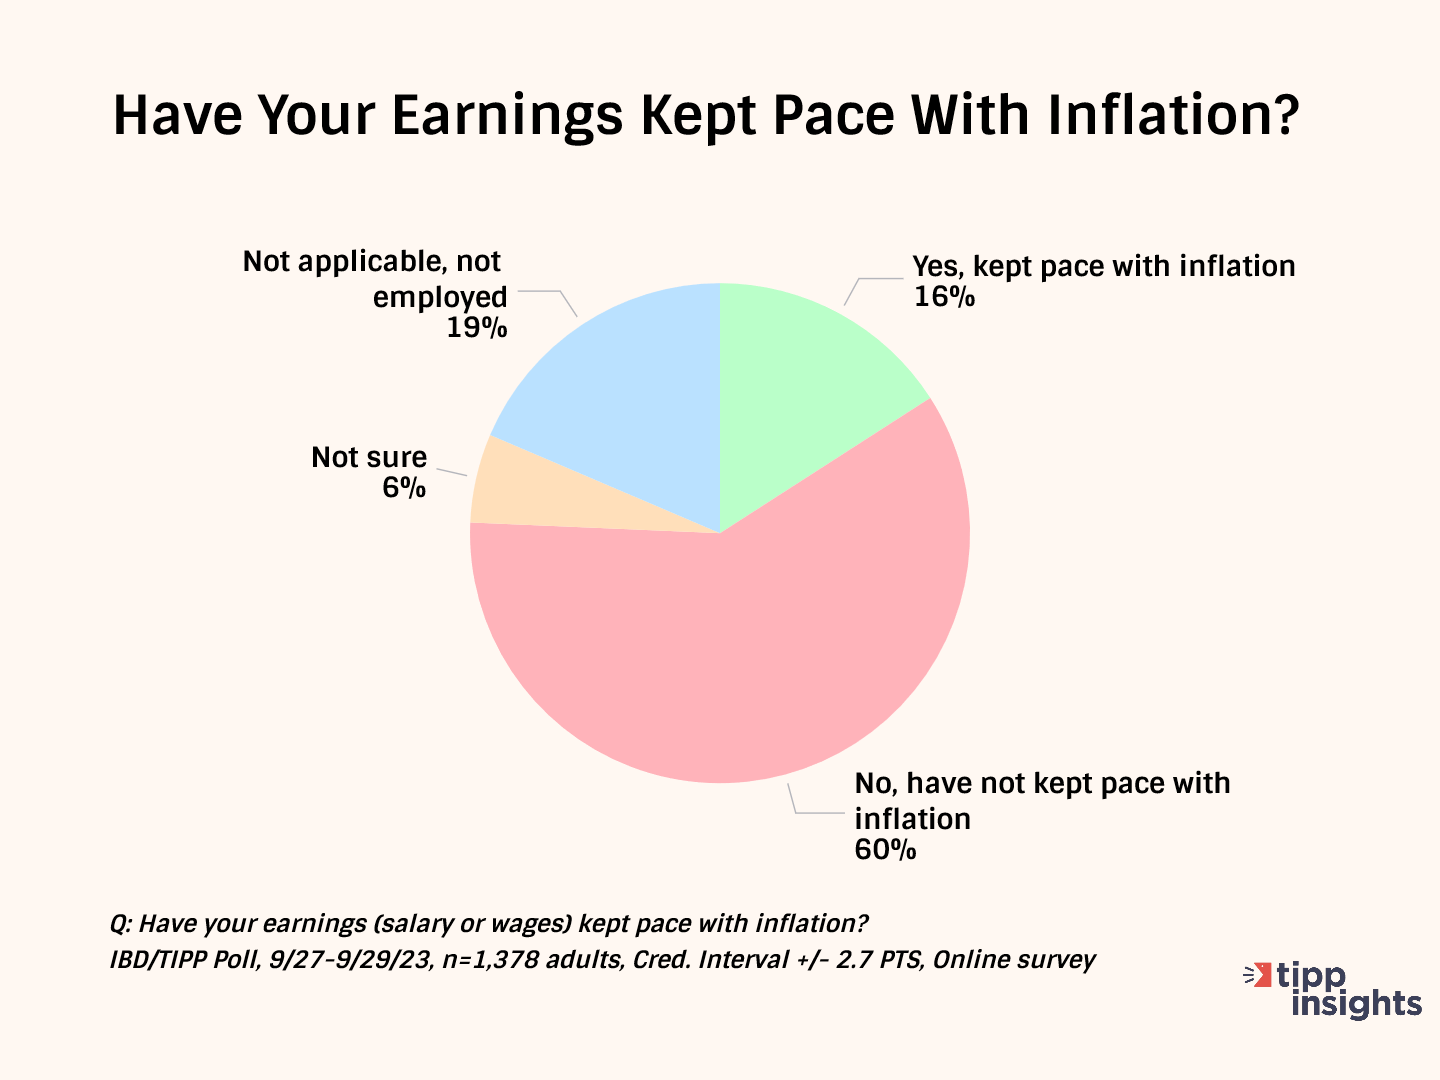
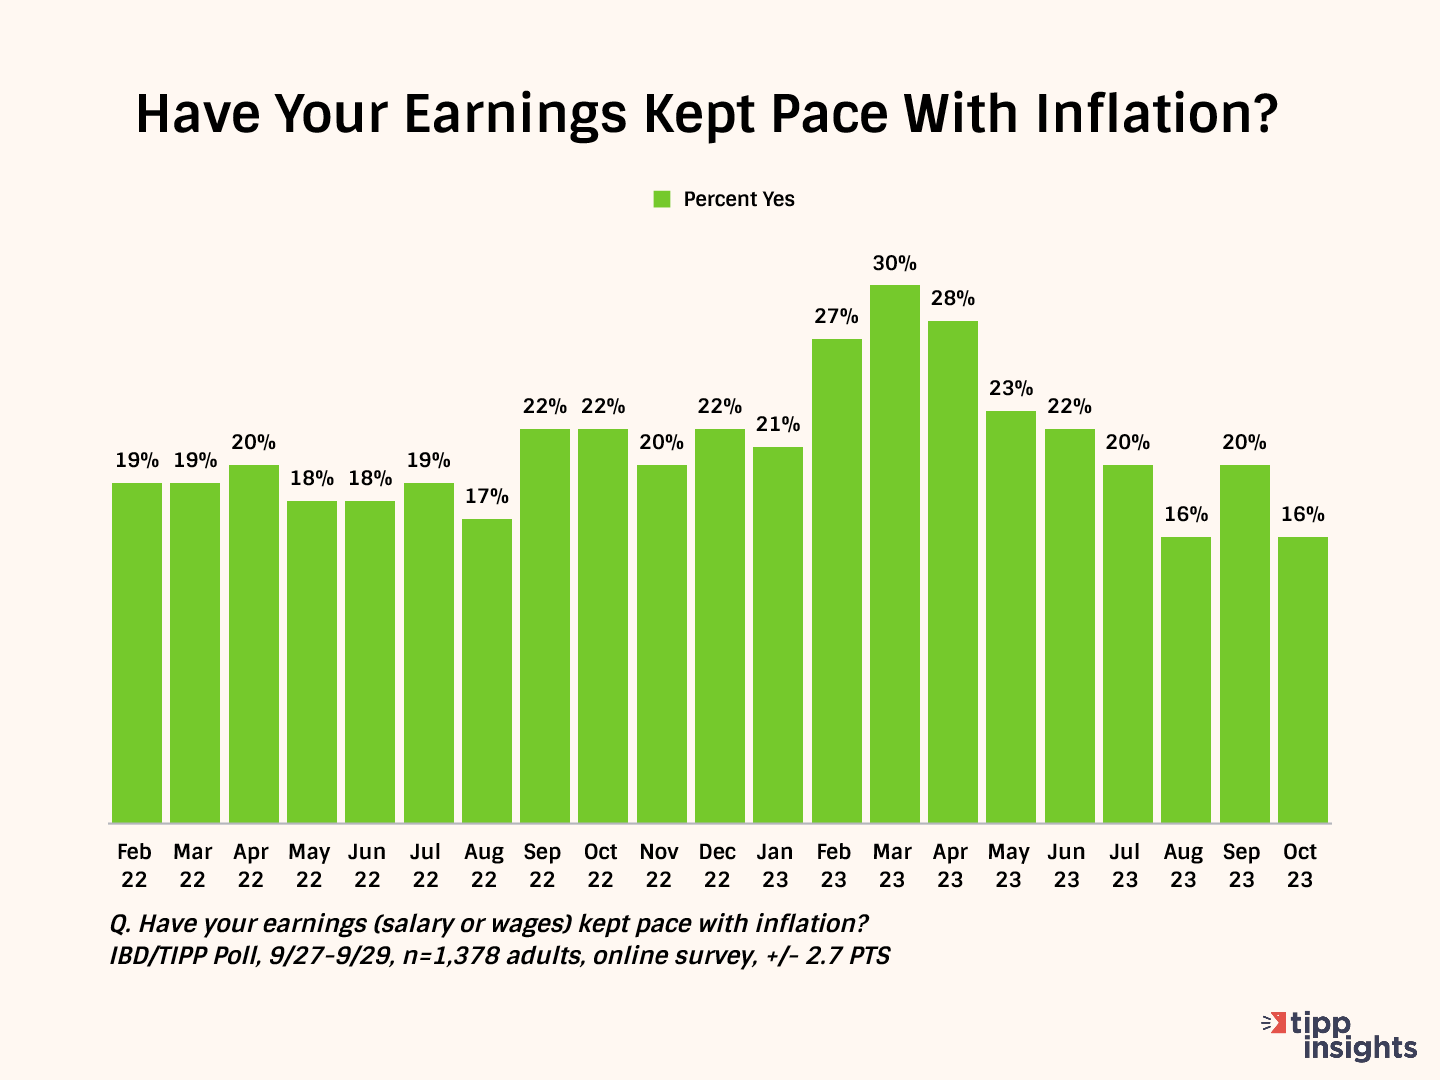
Over half (60%) say their wages have not kept up with inflation. Only 16% say their income has kept pace with inflation.
This statistic hovered in the low twenties for most of the last year. The positive change between January and March has petered out since May. Notice the steady descent from March 2023. It posted 16% in September after the August blip of 20%.
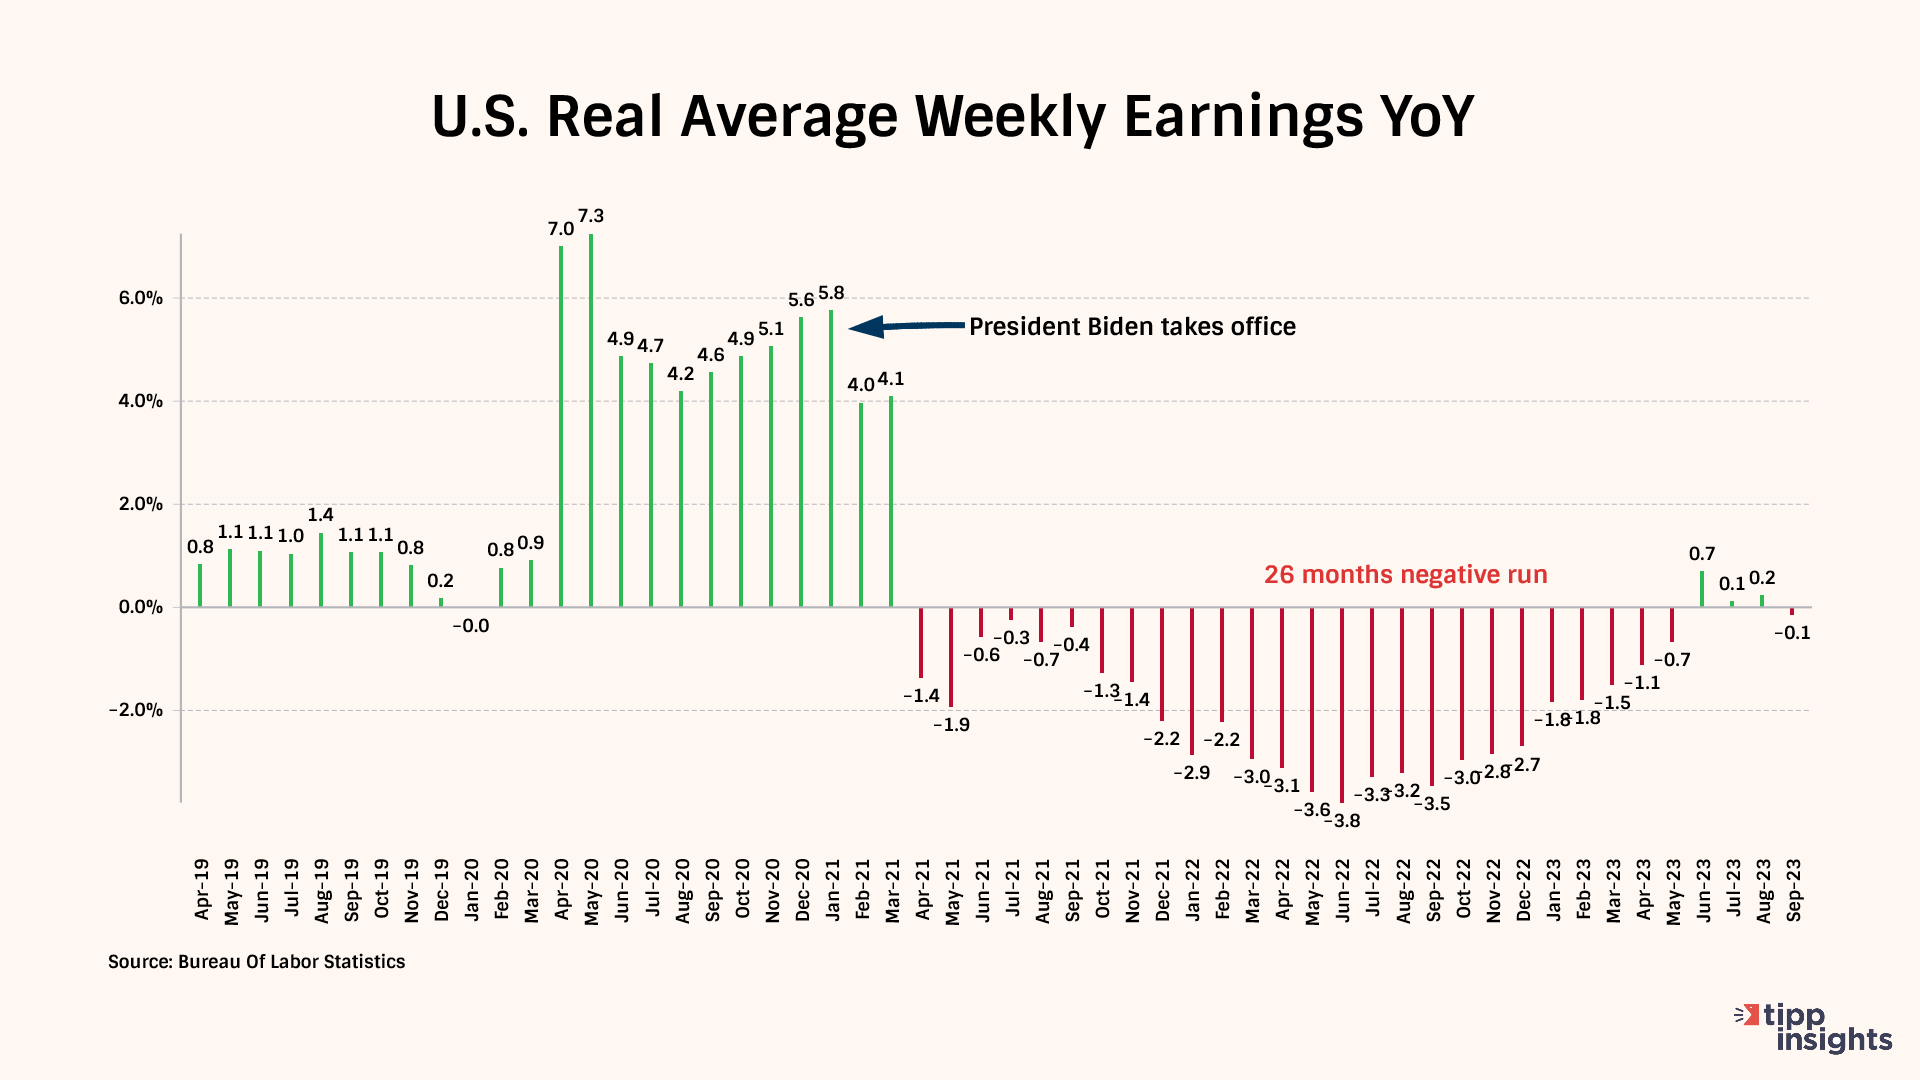
Nominal wages represent the amount of money one earns without considering changes in the cost of living. On the other hand, real wages consider inflation and measure the wages' purchasing power. Real wages provide a more accurate reflection of what is affordable with the income earned by factoring in the changes in the cost of living.
Real weekly wages measured year-over-year dropped for 27 of the 33 months of the Biden presidency. It broke the 26-month negative run in June and posted positive readings for three months. However, it fell back to negative territory in September.
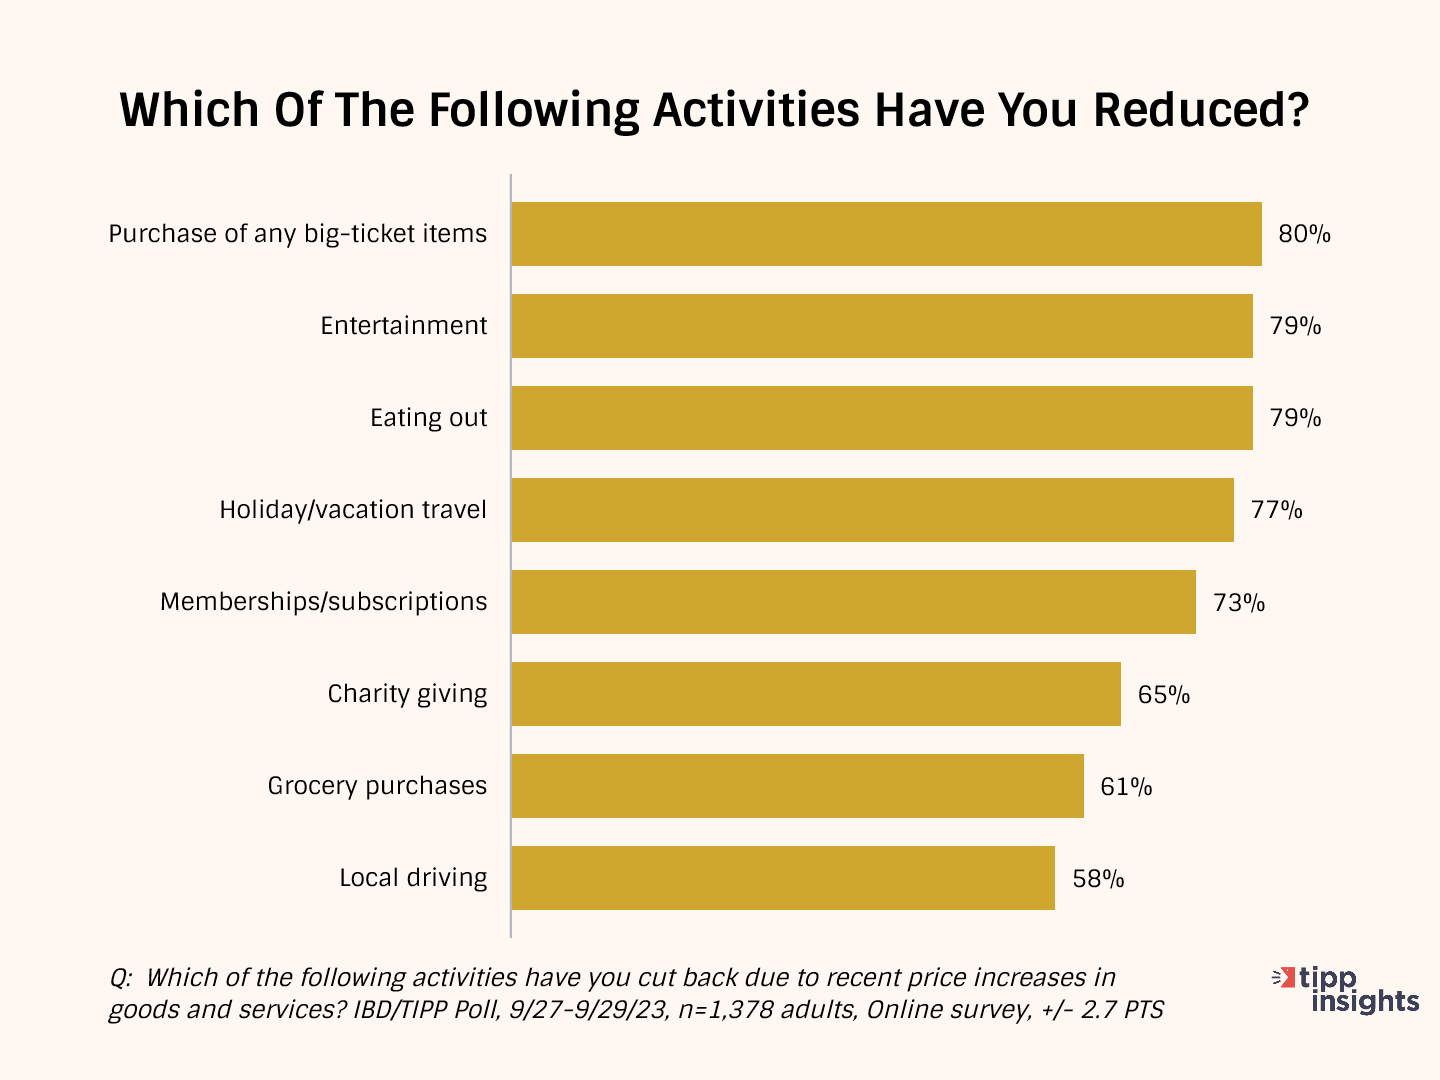
As a result of inflation, Americans are cutting back on household spending.
They are cutting back on purchasing big-ticket items (80%), entertainment (79%), eating out (79%), holiday/vacation travel (77%), and memberships/subscriptions (73%).
Many (65%) are cutting back on even good causes such as charity giving. Nearly two-thirds (61%) of households spend less on groceries. The high gasoline prices forced 58% to cut back on local driving.
Inflation Direction
The chart below compares the 12-month average of monthly changes against the 6-month and the 3-month averages. We also show the reading for September 2023.
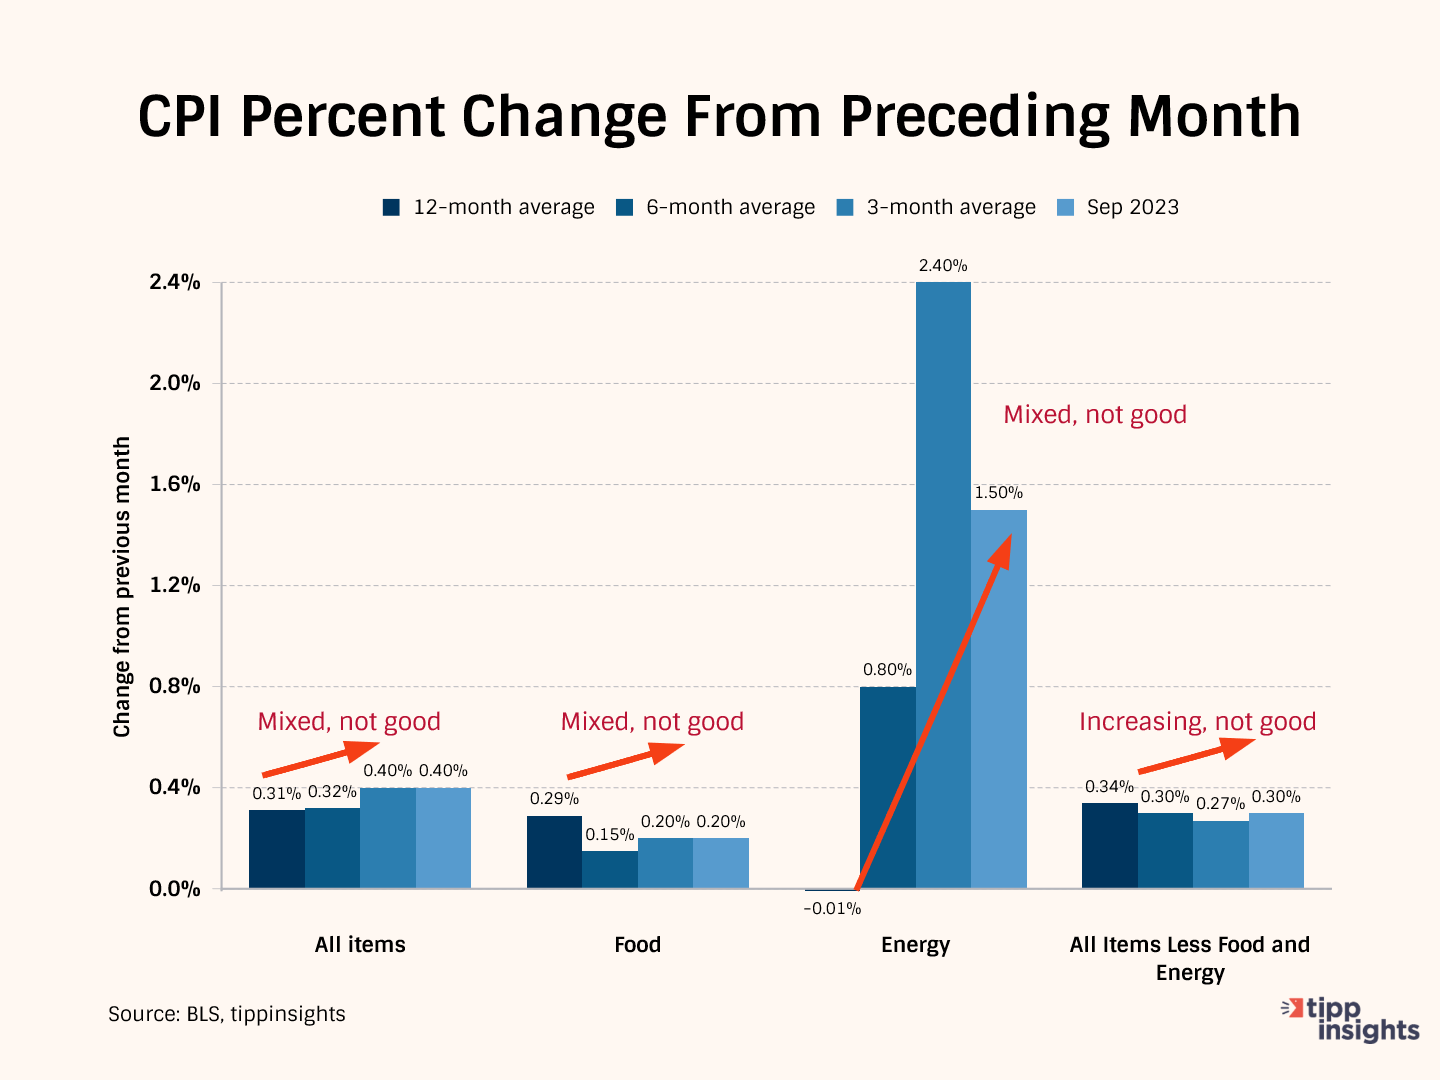
The 12-month average considers 12 data points and presents a long-term reference, while the six-month and three-month averages consider recent data points.
Typically, we compare the three-month average to the data from September 2023 to get a clearer picture. In September 2023, the price increase for 'All items' was 0.40%, and the three-month average was also 0.40%. This implies that there has been no change.
Meanwhile, the three-month average of 0.40% is higher than the six-month average of 0.32%, indicating an acceleration in the rate of increase over the past three months.
Furthermore, the six-month average of 0.32% surpasses the twelve-month average of 0.31%, a deterioration in the trend over the last six months.
In conclusion, this pattern suggests that price increases have accelerated compared to the long term, even though the September reading did not show further deterioration.
In September, the price increase for food was 0.20%, matching the 3-month average of 0.20%. This indicates that food prices neither improved nor worsened. Furthermore, when we compare the three-month average of 0.20% to the average of the past six months, which stood at 0.15%, we can observe that the recent 3-month period saw a slightly higher price increase.
The twelve-month average was 0.29%, significantly higher than the six-month (0.15%) and three-month (0.20%) averages. So, the shorter time frames show an improvement compared to the long-term 12-month average. Hence, the pattern is mixed and is not considered favorable.
The Energy prices increased in September by 1.5%, less than the three-month moving average of 2.40%, indicating improvement. However, the recent data is worse than the 12-month average of -0.01%
"All items less food and energy" is called "core inflation," i.e., after removing volatile food and energy components. The core inflation reading in September was 0.30%, higher than the three-month average of 0.27%. This indicates deterioration in September compared to the most recent three months. Despite this, Biden claimed victory in taming “core inflation.”
Meanwhile, the three-month average of 0.27% is lower than the six-month average of 0.30%, suggesting a slowdown in core inflation. Additionally, the six-month average of 0.30% is lower than the 12-month average of 0.34%.
In summary, inflation worsened all around.
Inverted Yield Curve
In normal circumstances, longer-term investments offer higher yields than shorter-term investments due to the higher risk associated with longer durations. However, an inverted yield curve can occur during periods of economic turbulence, such as the current times. This happens because investors expect higher yields in the short term to compensate for the potential short-term uncertainties in the economy. As a result, the yields on shorter-term bonds become higher than those on longer-term bonds of the same credit quality.
The presence of an inverted yield curve is an indication that investors anticipate economic instability or a possible economic downturn. The inverted yield curve is a leading indicator of lower inflation and recession. It has a strong track record of accurately predicting the last ten recessions since 1955, with only one incorrect signal in the mid-1960s.
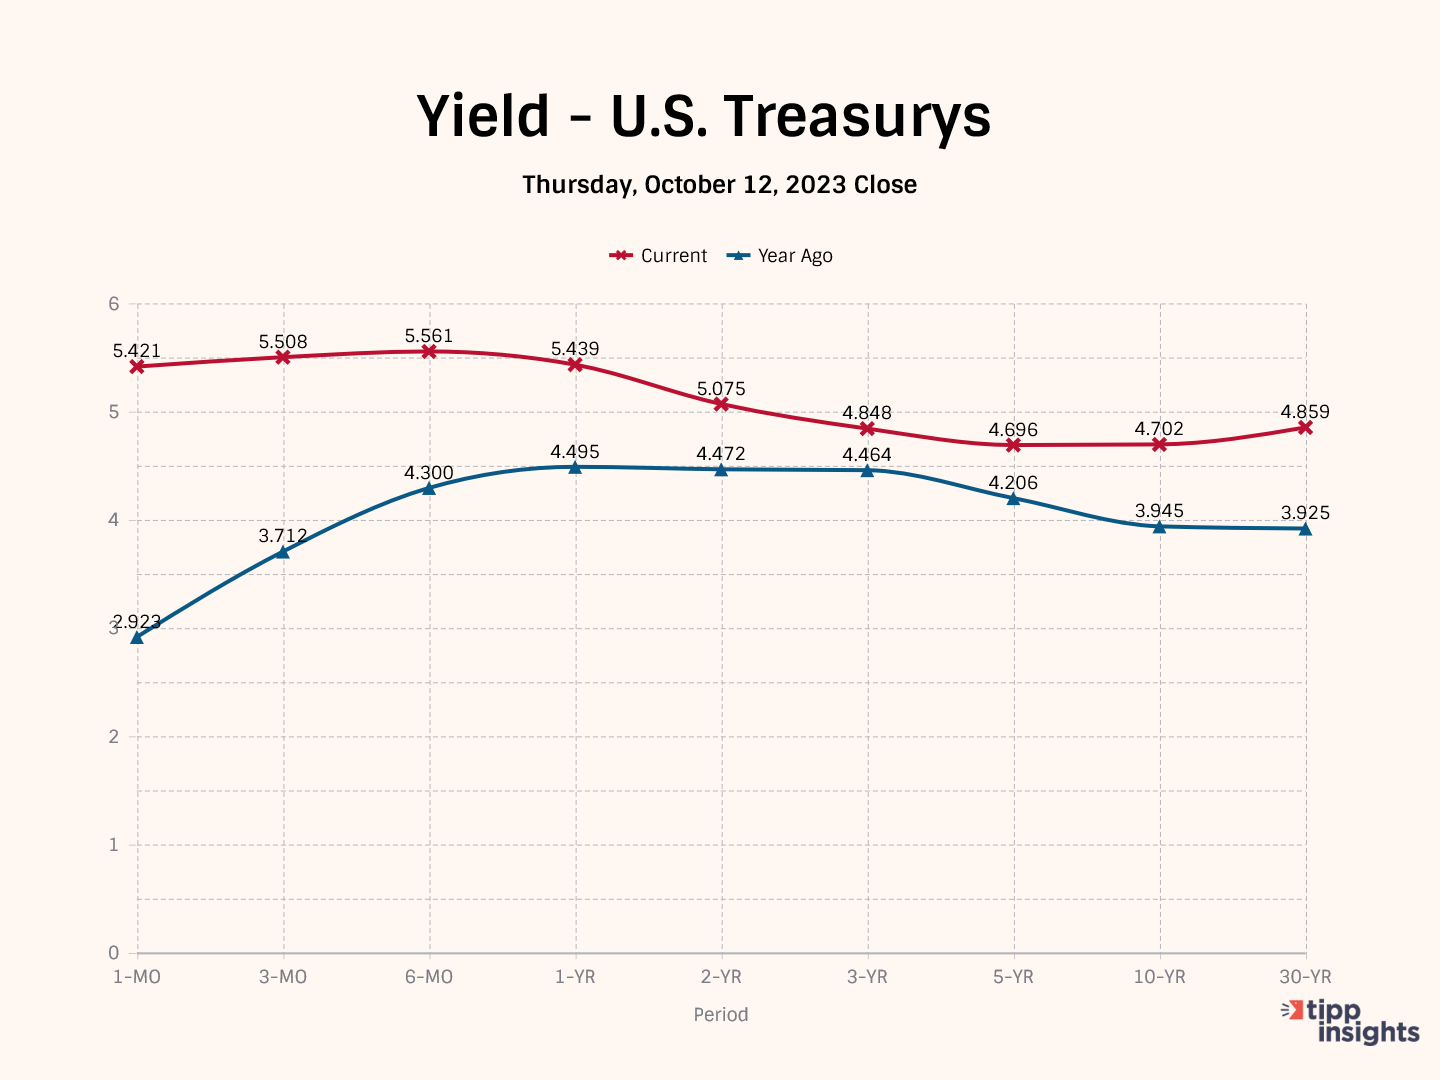
The closing yields on Thursday were:
- 5.421% for the 1-month Treasury bill
- 5.508% for the 3-month Treasury bill
- 5.561% for the 6-month Treasury bill
- 5.439% for the 1-year Treasury bill
- 5.075% for the 2-year Treasury note
- 4.848% for the 3-year Treasury note
- 4.702% for the 10-year Treasury note
- 4.859% for the 30-year Treasury bond
Stagflation
Here’s the conundrum. While the Fed is fighting to slay inflation, Bidenomics spending is causing it. What is the result? Stagflation.
Stagflation refers to a combination of stagnant economic growth and high inflation. Most Americans struggle, challenged by the high core inflation rate of 4.1%.
Since March 2022, the Fed has raised interest 11 consecutive times, bringing its benchmark interest rate to 5.25%, the highest level in 22 years. High-interest rates are likely to slow down the economy further.
Each time the Federal Reserve increases interest rates to contain inflation, the U.S. government must pay higher interest rates to service its ballooning debt. A rising debt-to-GDP ratio limits the ability to fund essential government services.
The October IBD/TIPP Poll revealed that most Americans view the economy negatively. Over half (54%) believe we are in a recession, and seven in ten (70%) feel that the economy is not improving.
Considering these factors and the numbers, we predict that the U.S. economy will face an extended period of stagflation characterized by a slowdown and inflation.
To access the TIPP CPI readings each month, you can visit tippinsights.com. We'll publish the TIPP CPI and our analysis in the days following the Bureau of Labor Statistics (BLS) report. The upcoming release of TIPP CPI is on November 14, 2023. We'll also post a spreadsheet in our store for download.
Hey, want to dig deeper? Download data from our store for a small fee!
Want to understand better? We recently wrote an explainer that sixth graders could understand. Everyone can benefit from it. Milton Friedman's Priceless Lessons On Inflation.
We could use your help. Support our independent journalism with your paid subscription to keep our mission going.


