
- Bidenflation at 16.6% erodes Americans’ purchasing power
- Annualized Bidenflation hits 5.7%, nearly double the CPI
- Core prices stubborn at 3.9%
- Real wages lag 2.5% since Biden took office
- RELATED: More Bad News For Biden: Just 34% Of Americans Say They’re Better Off Than Four Years Ago: I&I/TIPP Poll
The dark reality of Bidenomics is 16.6% inflation under the President’s watch. When he took office, inflation was at just 1.4%. Inflation has stayed above the Federal Reserve's 2% target for 35 consecutive months since March 2021.
Average hourly earnings for all employees dropped 2.5% to $11.10 in December from $11.39 in January 2021 when Biden assumed office. Despite nominal salary increases at their fastest pace in years, American workers are now worse off than when the President took office.
In summary, the prices have increased by 16.6%, while real wages have declined by 2.5%, meaning Americans have taken a 2.5% pay cut under the current administration. To put it differently, people now need 19.1% more income than they had in January 2021 to maintain their living standards.
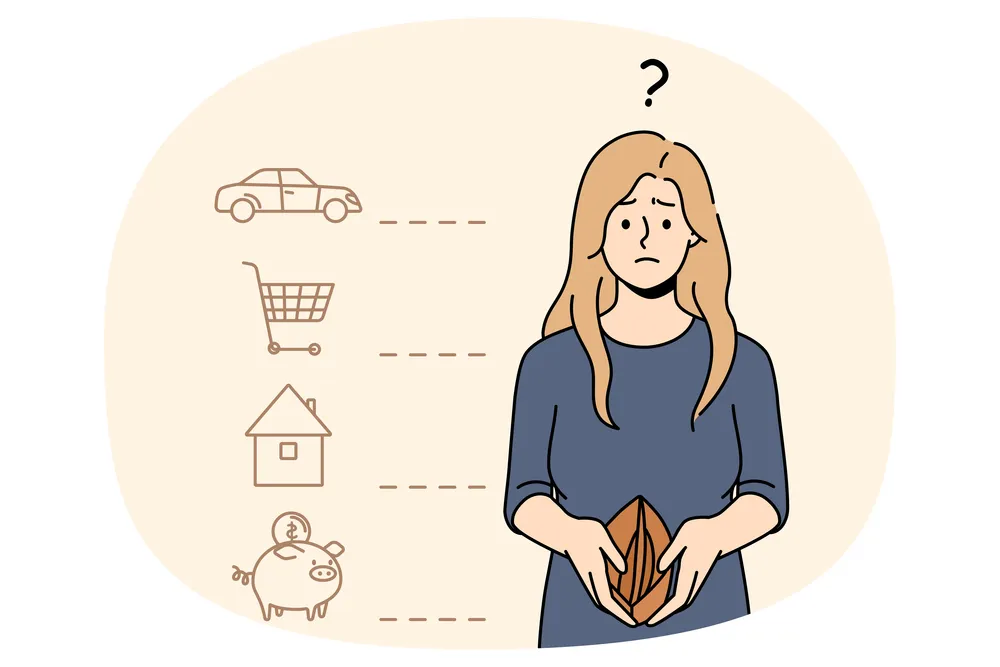
How do Americans make up the shortfall?
Many must take up a second job, tap into their savings, or supplement with credit cards. Credit card debt has climbed 40% over the past two years and is near $1.1 trillion.
Inflation acts as a tax on the citizens. Due to entrenched inflation without corresponding real wage growth, most Americans (60%) live paycheck to paycheck, cutting expenses to make ends meet. Further, as we showed recently, the fight to slay inflation has side effects worse than the disease.
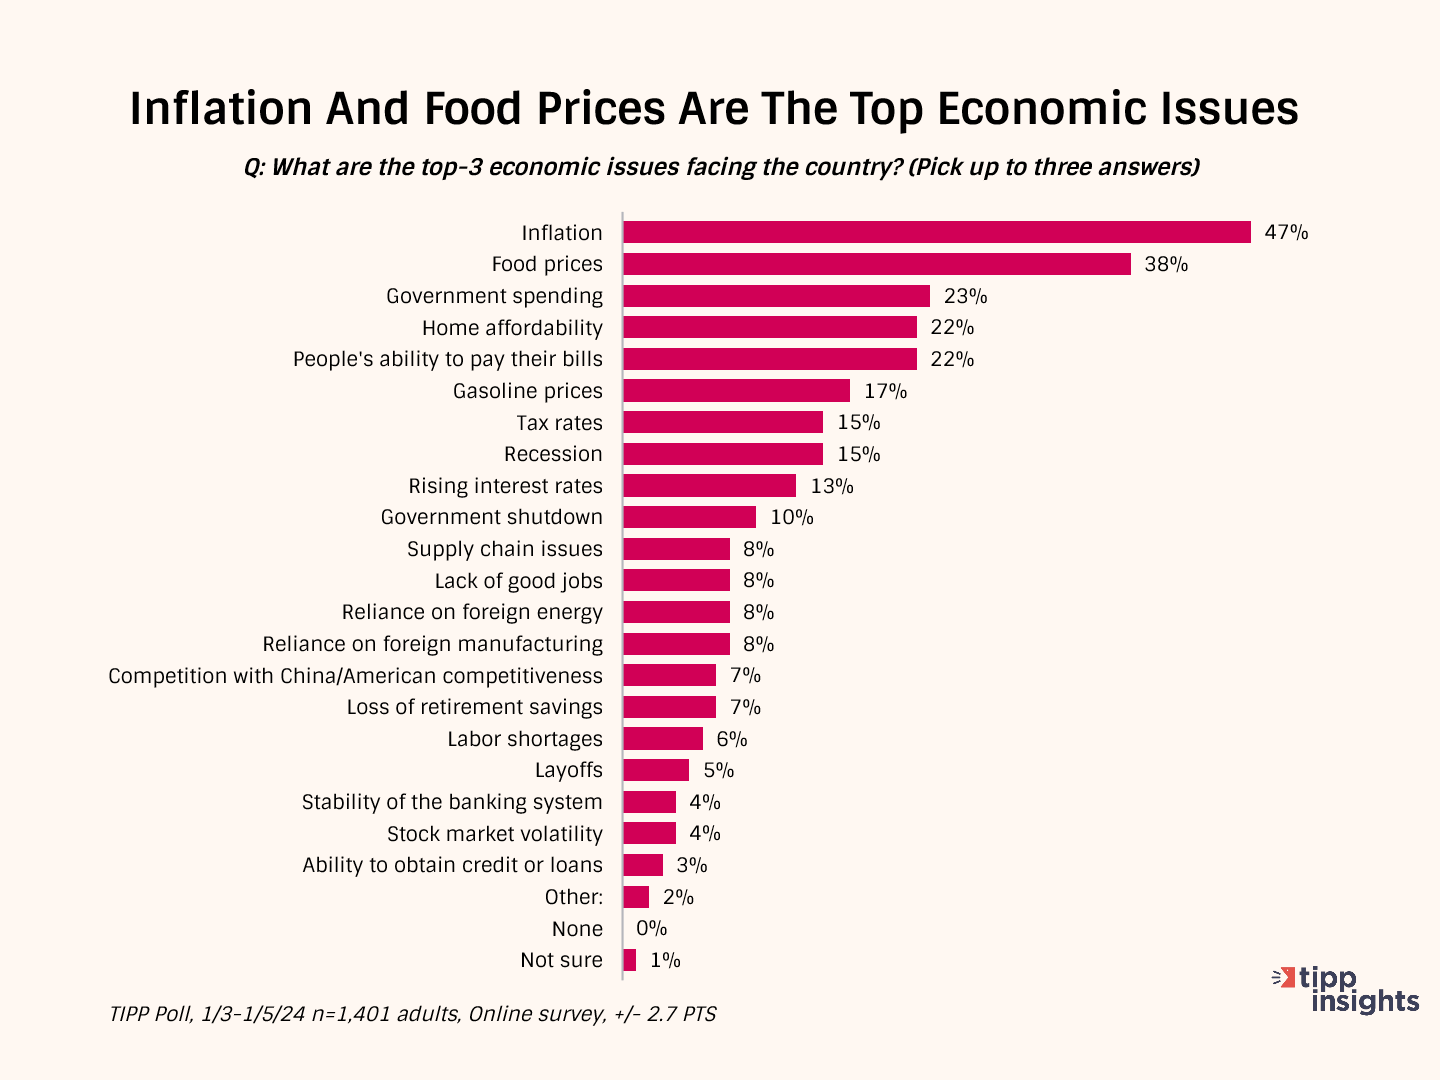
Therefore, it is no surprise that inflation and food prices emerged as Americans' top economic issues in a recent TIPP Poll.
CPI Report
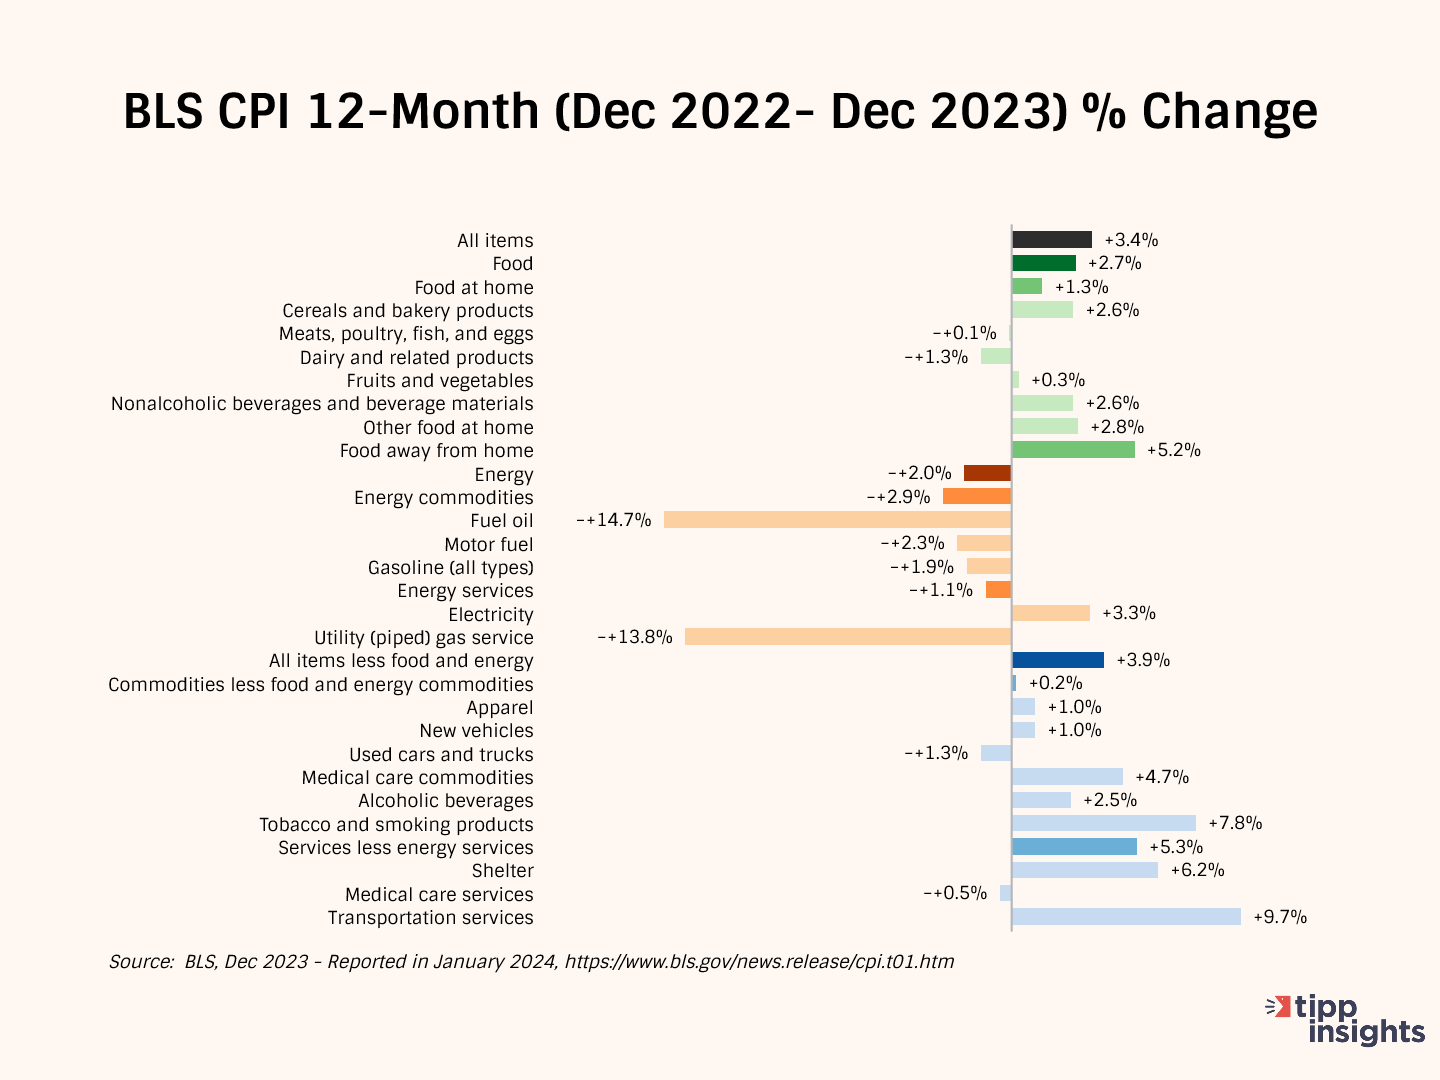
The Consumer Price Index (CPI) released by the government on Thursday showed a 3.4% year-over-year price increase from December 2022 to December 2023.
The CPI rate had declined steadily from a 40-year high of 9.1% in June 2022 to 3.0% in June 2023 for 12 consecutive months. In July, it broke that run and increased to 3.2%, and further increased for the second month in August to 3.7% and remained at 3.7% in September. In October, it returned to 3.2%; in November, it dropped slightly to 3.1%, only to climb back to 3.4% in December.
After adjusting for seasonality, the CPI increased by 0.3% between November 2023 and December 2023. In the same period, Food prices rose by 0.2%, Energy prices increased by 0.4%, and All items except food and energy (Core) increased by 0.3%.
TIPP CPI
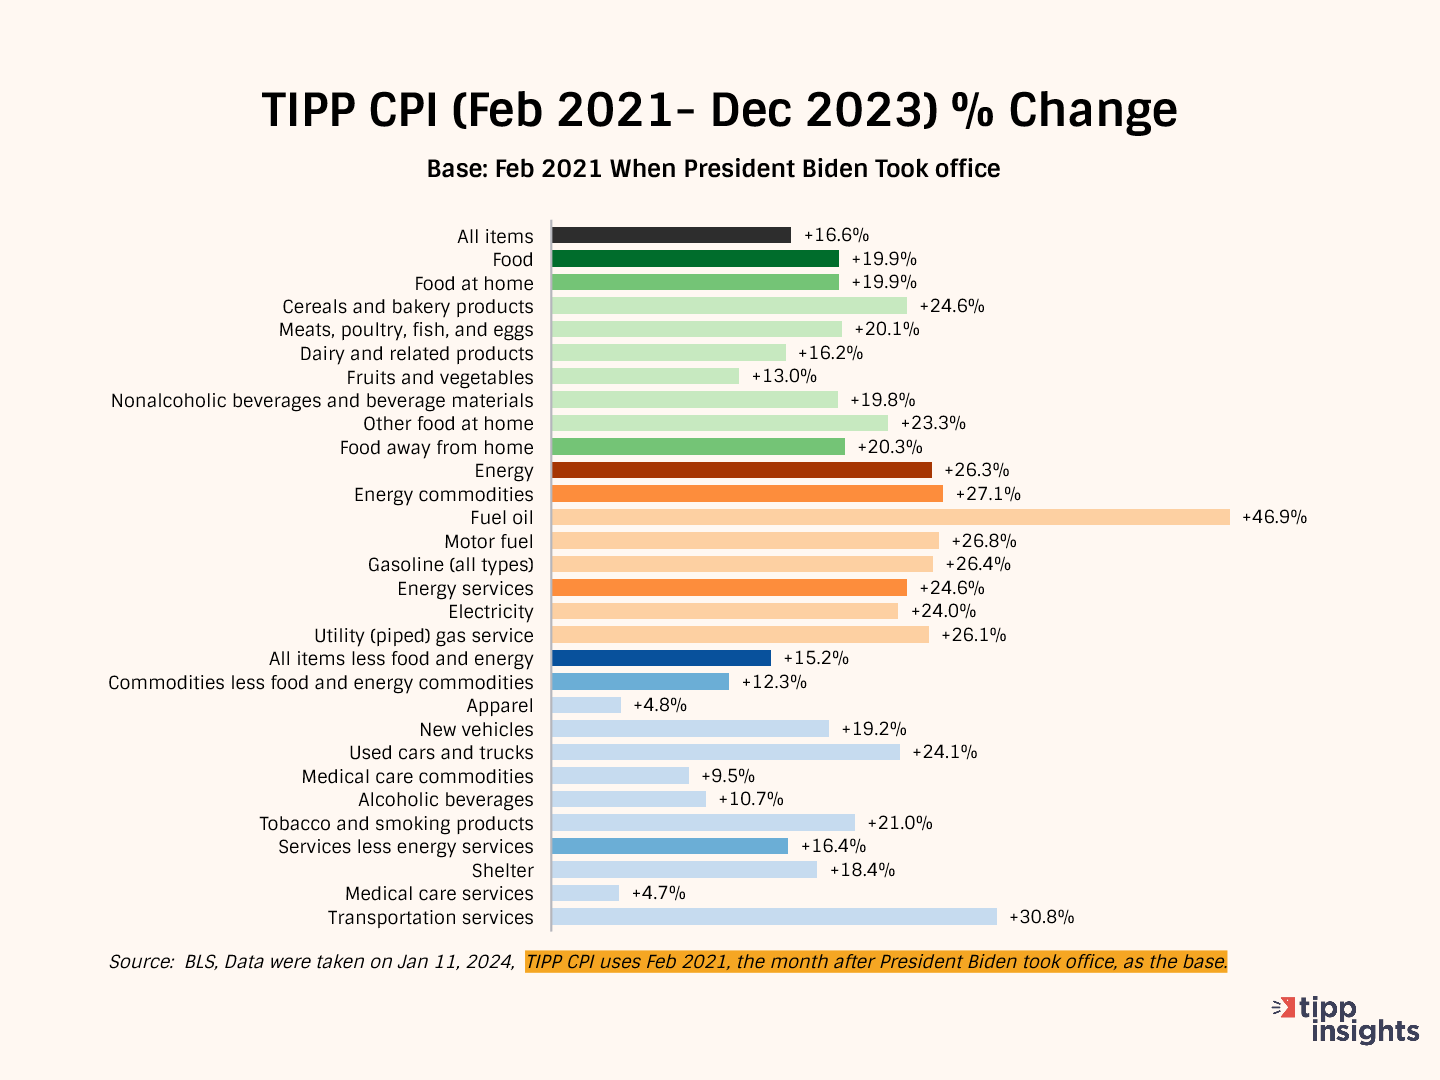
We developed the TIPP CPI, a metric that uses February 2021, the month after President Biden's inauguration, as its base. All TIPP CPI measures are anchored to the base month of February 2021, making it exclusive to the economy under President Biden's watch.
We use the relevant data from the Bureau of Labor Statistics (BLS) to calculate the TIPP CPI, but we adjust the period to Biden's tenure. When discussing the TIPP CPI and the BLS CPI, we convert the index numbers into percentage changes to better understand and compare them. CPIs are like index numbers that show how prices affect people's lives, similar to how the Dow Jones Industrial Average reflects the stock market.
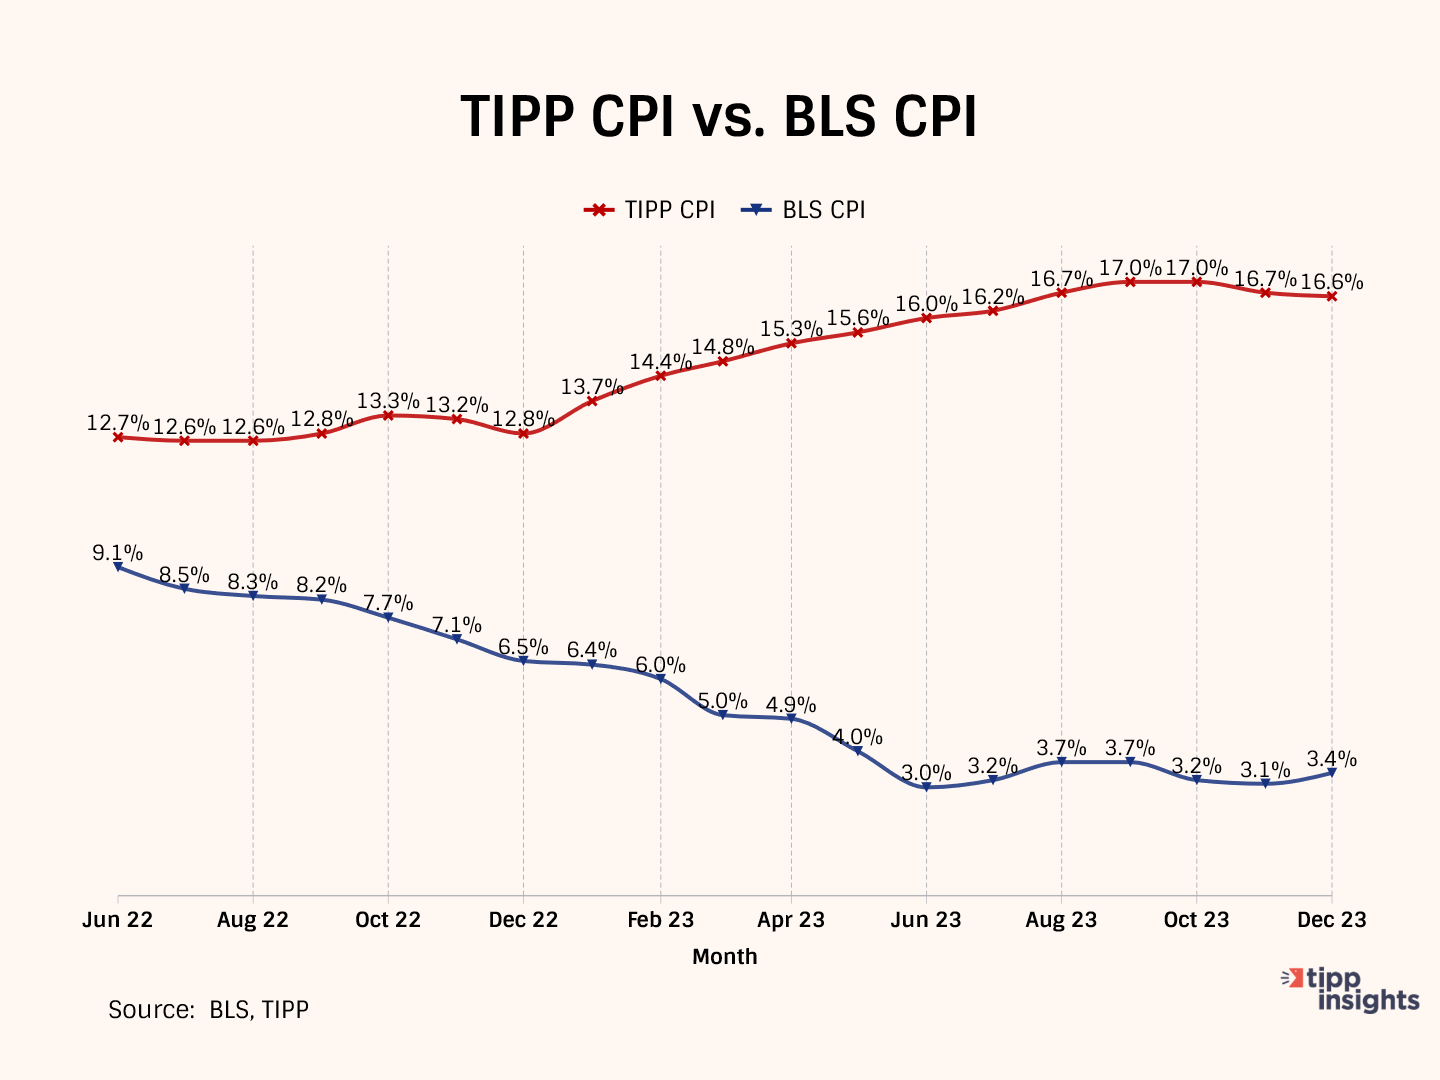
Bidenflation, measured by the TIPP CPI using the same underlying data, stayed steady at 16.6% in December. It was 16.7% in November, 17.0% in October and September, and 16.7% in August.
By the middle of 2022, significant inflation had already taken hold. In December 2022, CPI inflation stood at 6.5 percent. The official BLS CPI year-over-year increases will compare prices to already inflated bases in the coming months, so these statistics might mask the full impact.
TIPP CPI vs. BLS CPI
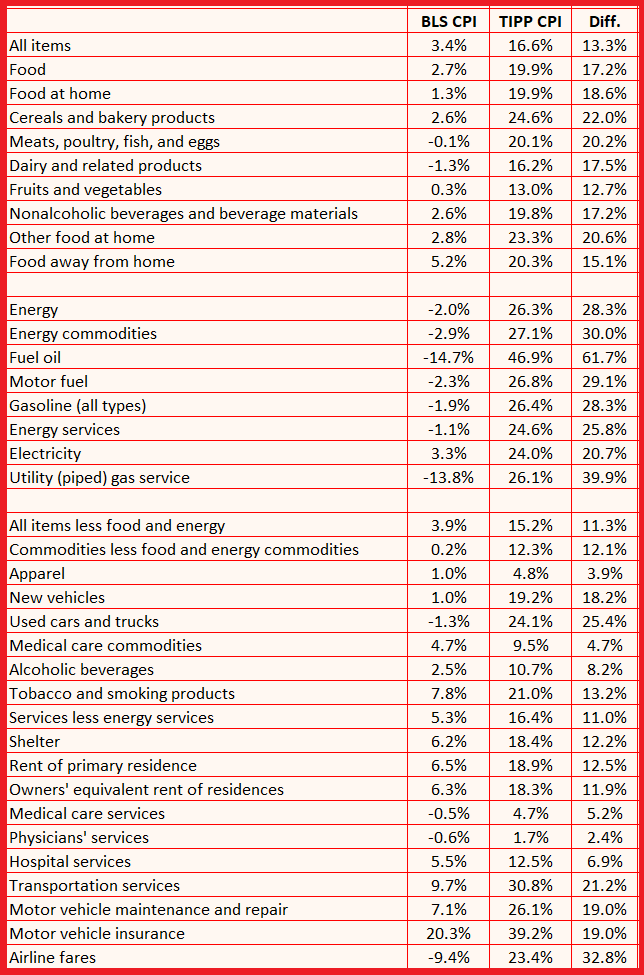
The following four charts present details about the new metric.
The annual CPI increase reported by BLS is 3.4% for December 2023. Compare this to the TIPP CPI of 16.6%, a 13.3-point difference. Prices have increased by 16.6% since President Biden took office. On an annual basis, TIPP CPI is 5.7%.
Food prices increased by 19.9% under Biden compared to only 2.7% as per BLS CPI, a difference of 17.2 points.
TIPP CPI data show that Energy prices increased by 26.3%. But, according to the BLS CPI, energy prices improved by 2.0%. The difference between the two is a whopping 28.3 points.
The Core CPI is the price increase for all items, excluding food and energy. The Core TIPP CPI is 15.2% compared to 3.9% BLS CPI in the year-over-year measure, an 11.3-point difference.
Further, gasoline prices have increased by 26.4% since President Biden took office, whereas the BLS CPI shows that gasoline prices have improved by 1.9%, a difference of 28.3 points.
TIPP CPI finds that Used car prices have risen by 24.1% during this President’s term. Meanwhile, the BLS CPI reports that the prices have dropped 1.3%, a difference of 25.4 points.
Inflation for air tickets is 23.4% compared to the BLS CPI’s finding of an improvement of 9.4%, a difference of 32.8 points.
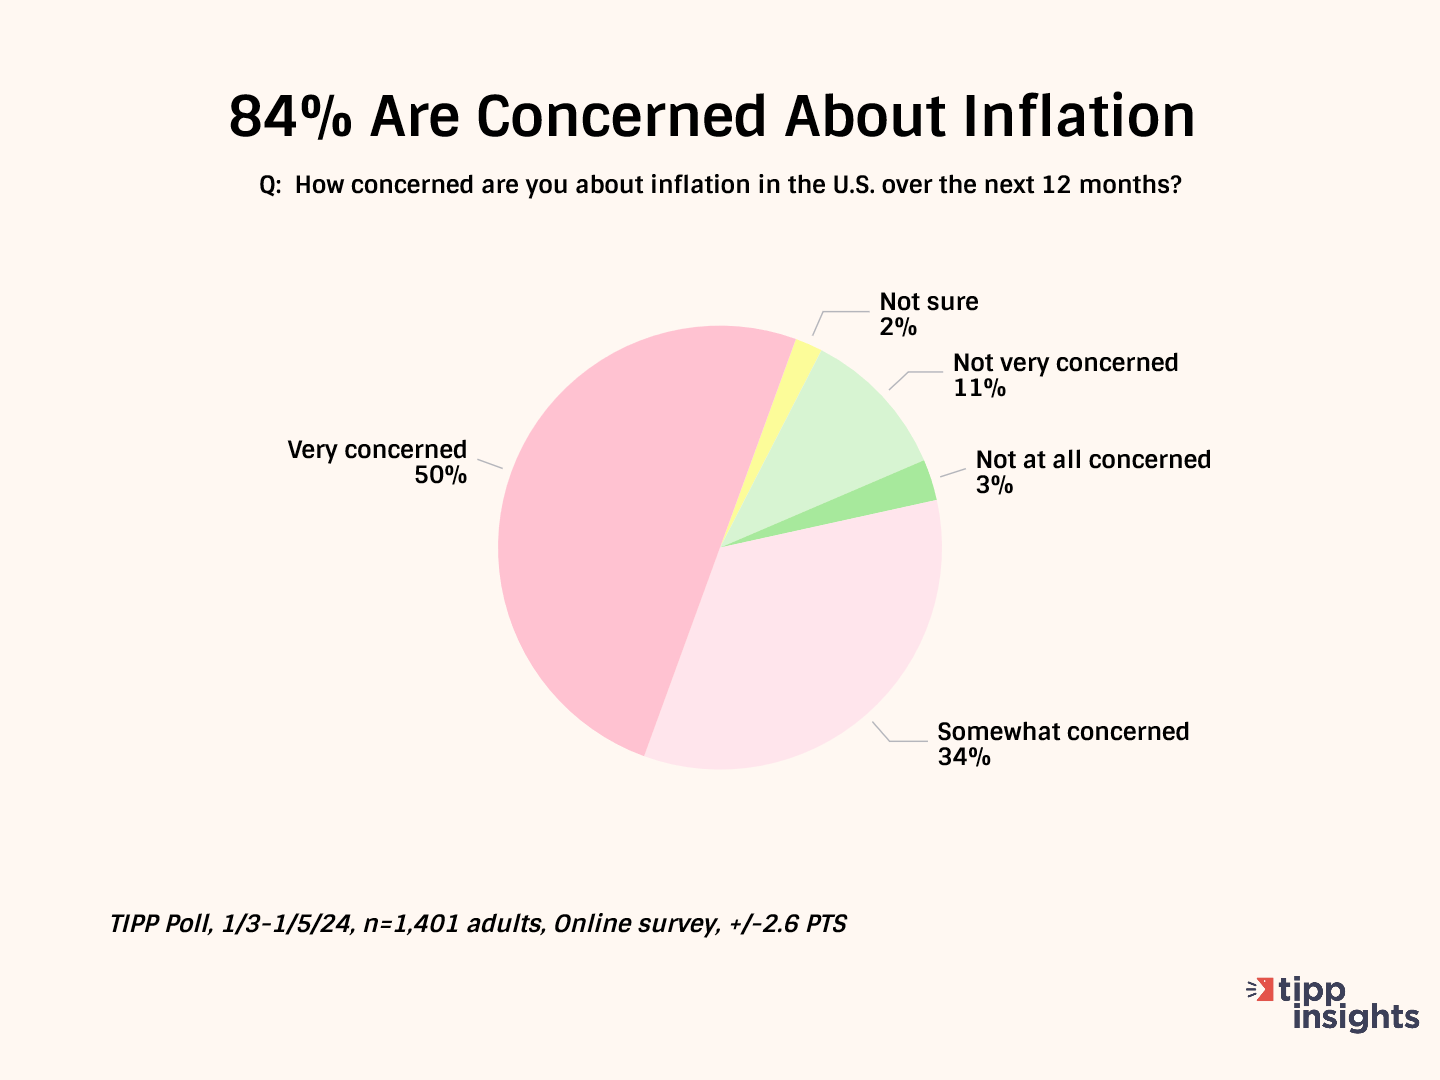
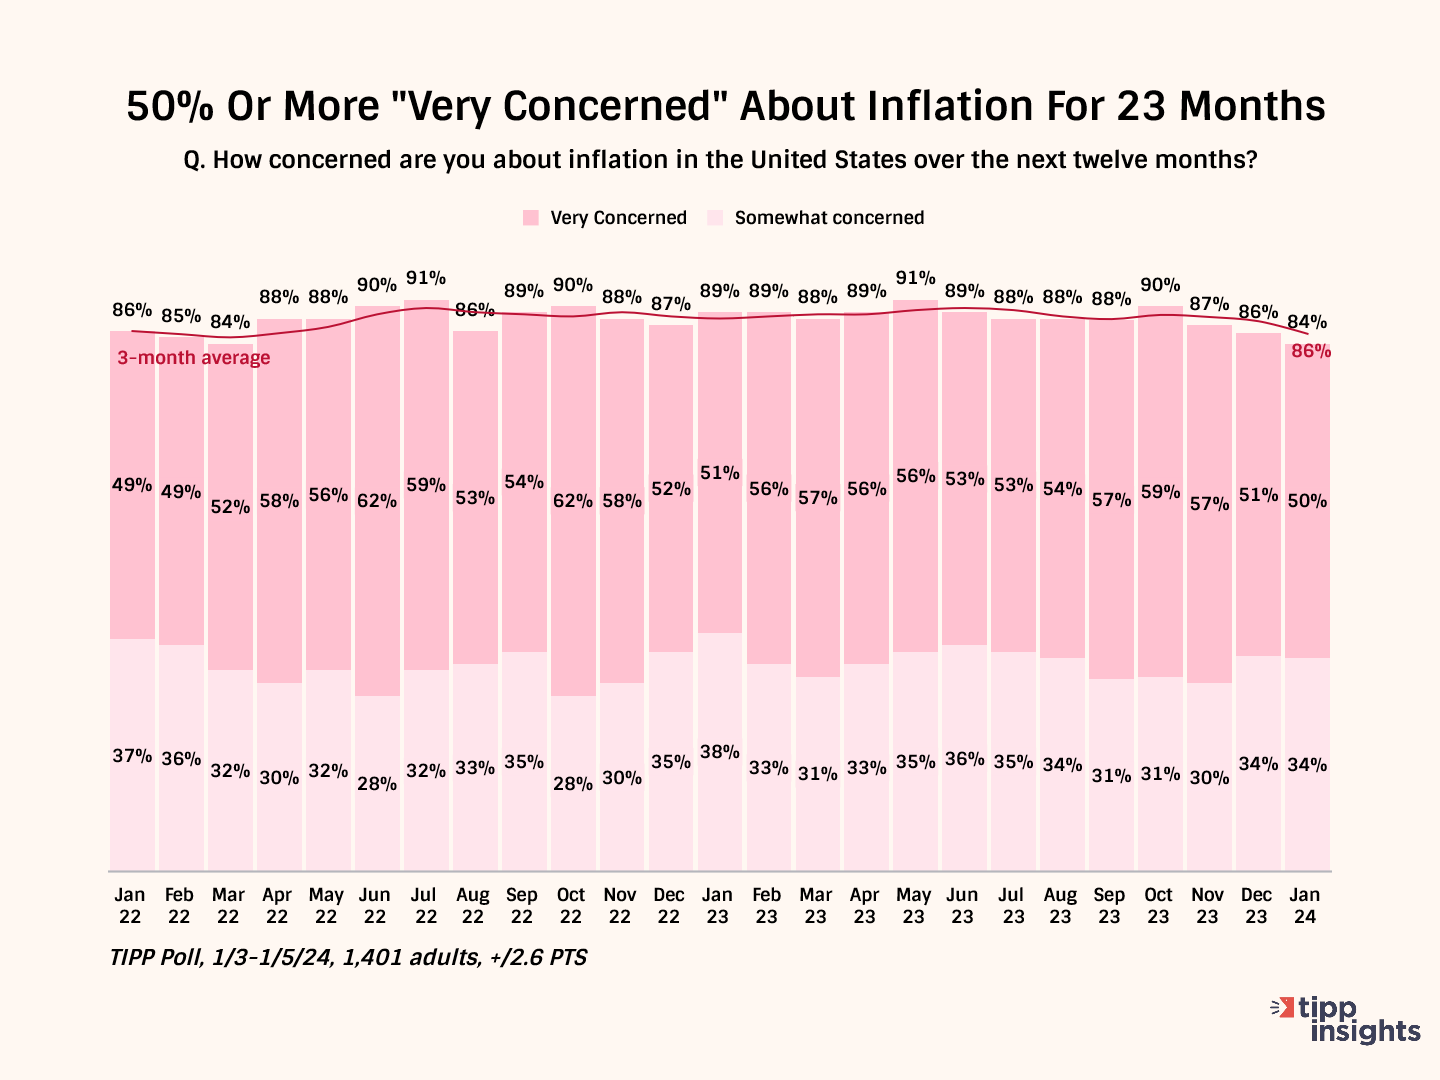
The latest TIPP Poll, completed earlier this month, shows nine in ten (84%) survey respondents are concerned about inflation. Since January 2022, inflation concerns have stayed above 80%. The "very concerned" share has been at least 50% for twenty-three months.
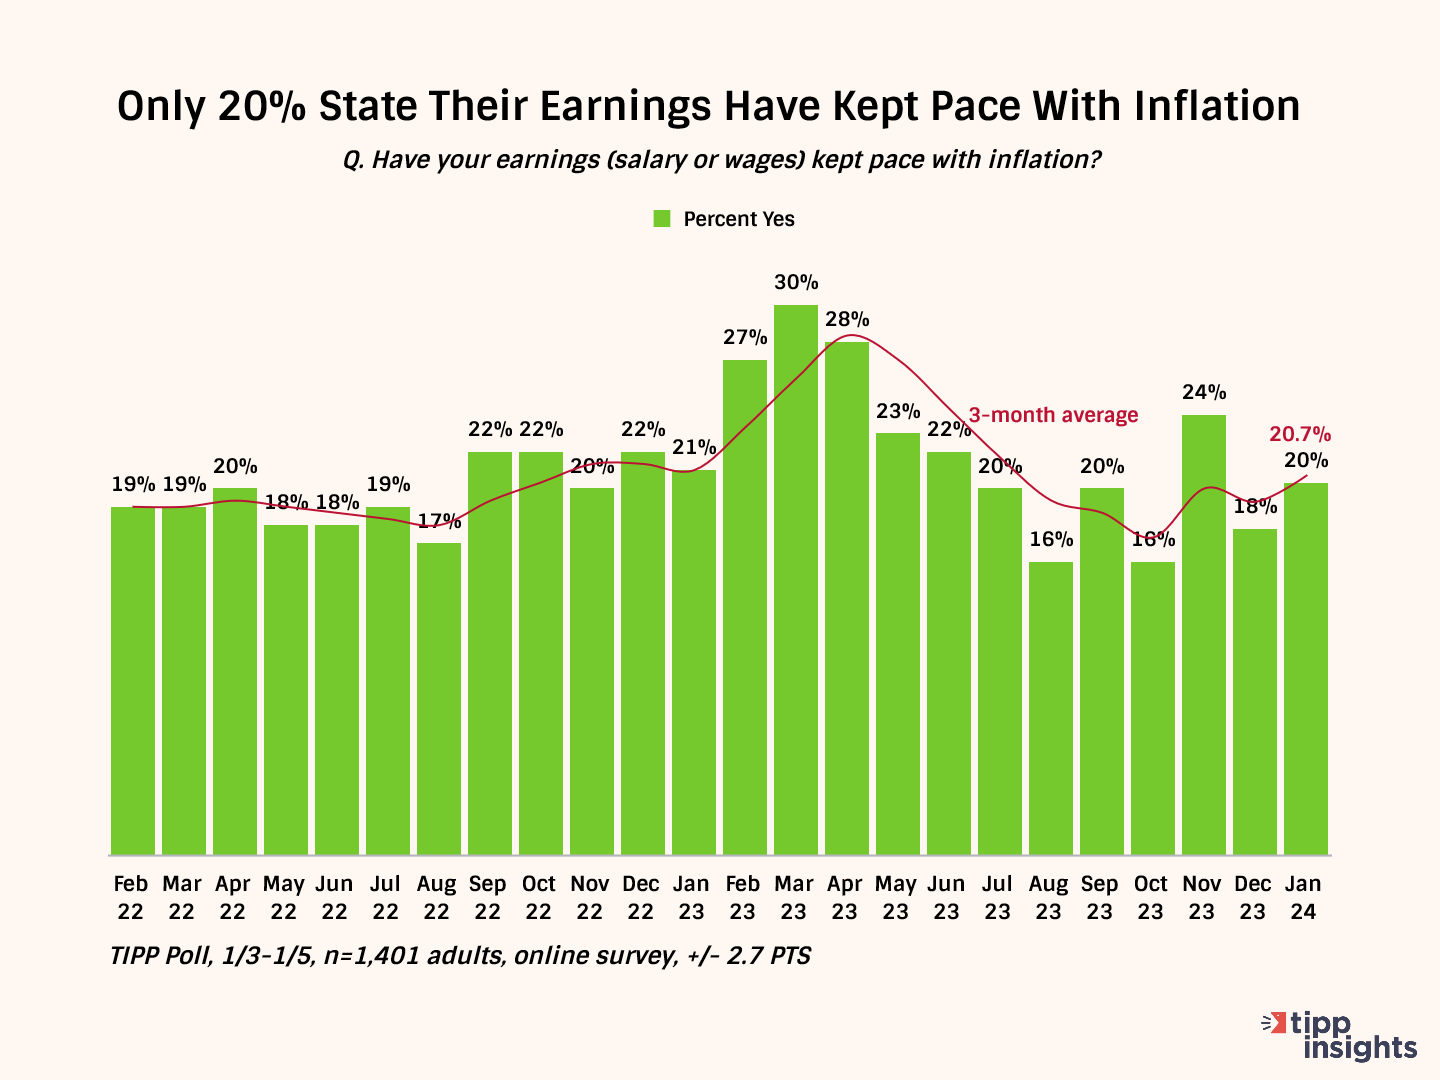
Nearly six in ten (55%) say their wages have not kept up with inflation. Only 20% say their income has kept pace with inflation.
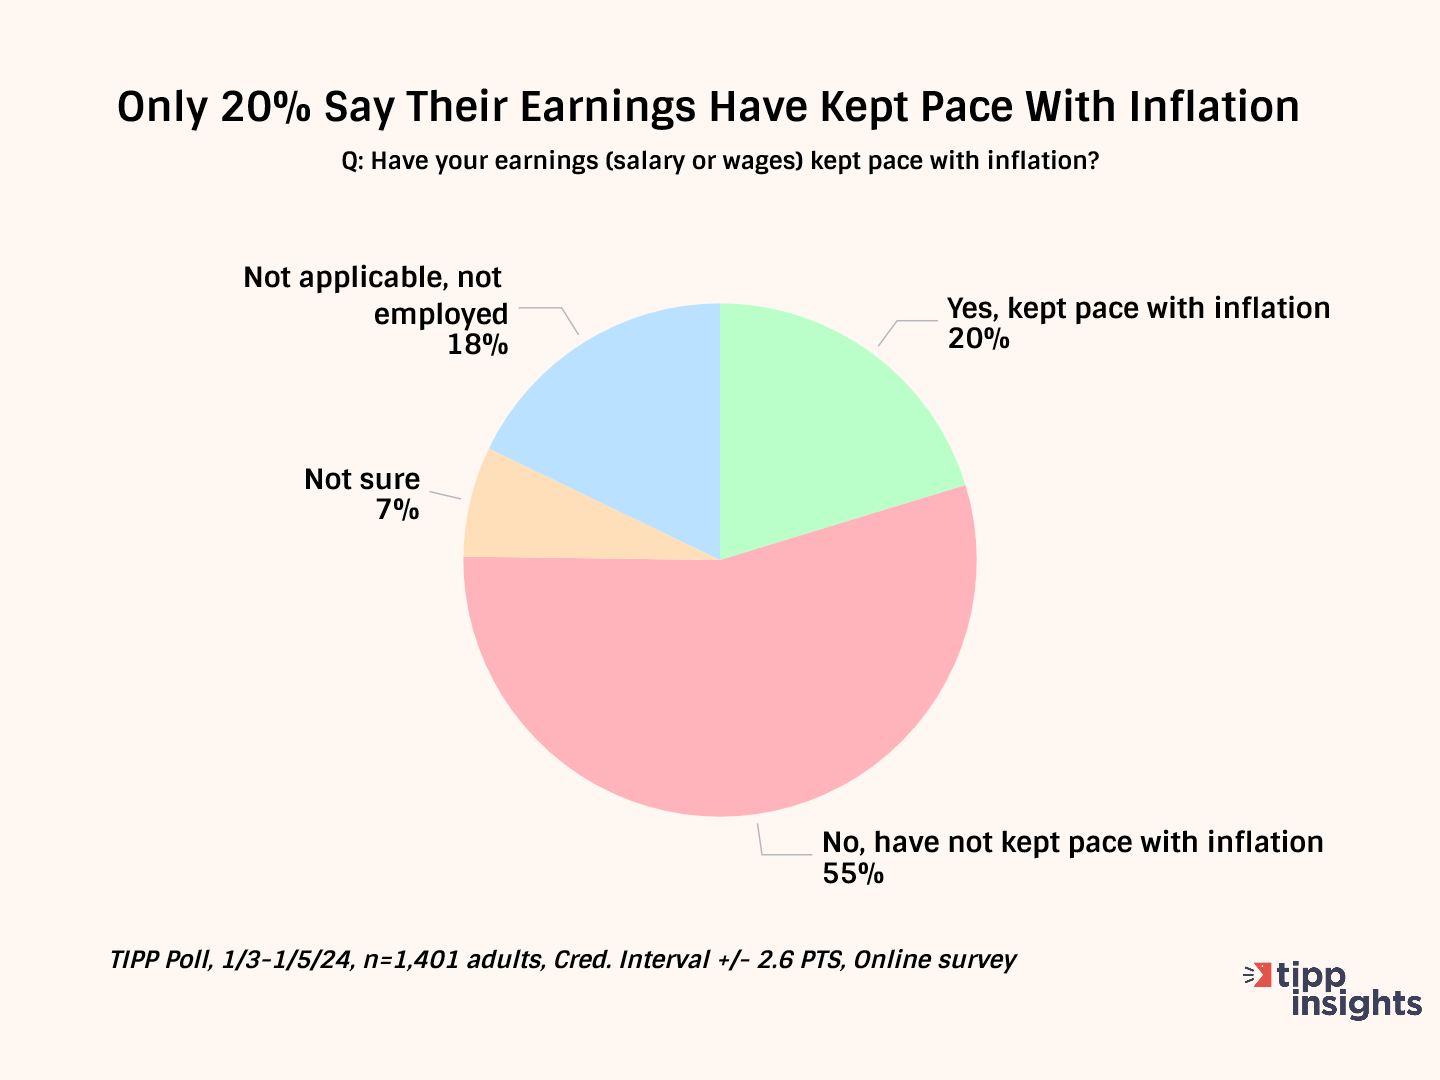
This statistic hovered in the low twenties for most of 2022. The positive change between January 2023 and March 2023 has petered out since May 2023. Notice the steady descent from March 2023. It dropped to 20% in January, with a three-month average of 20.7%.
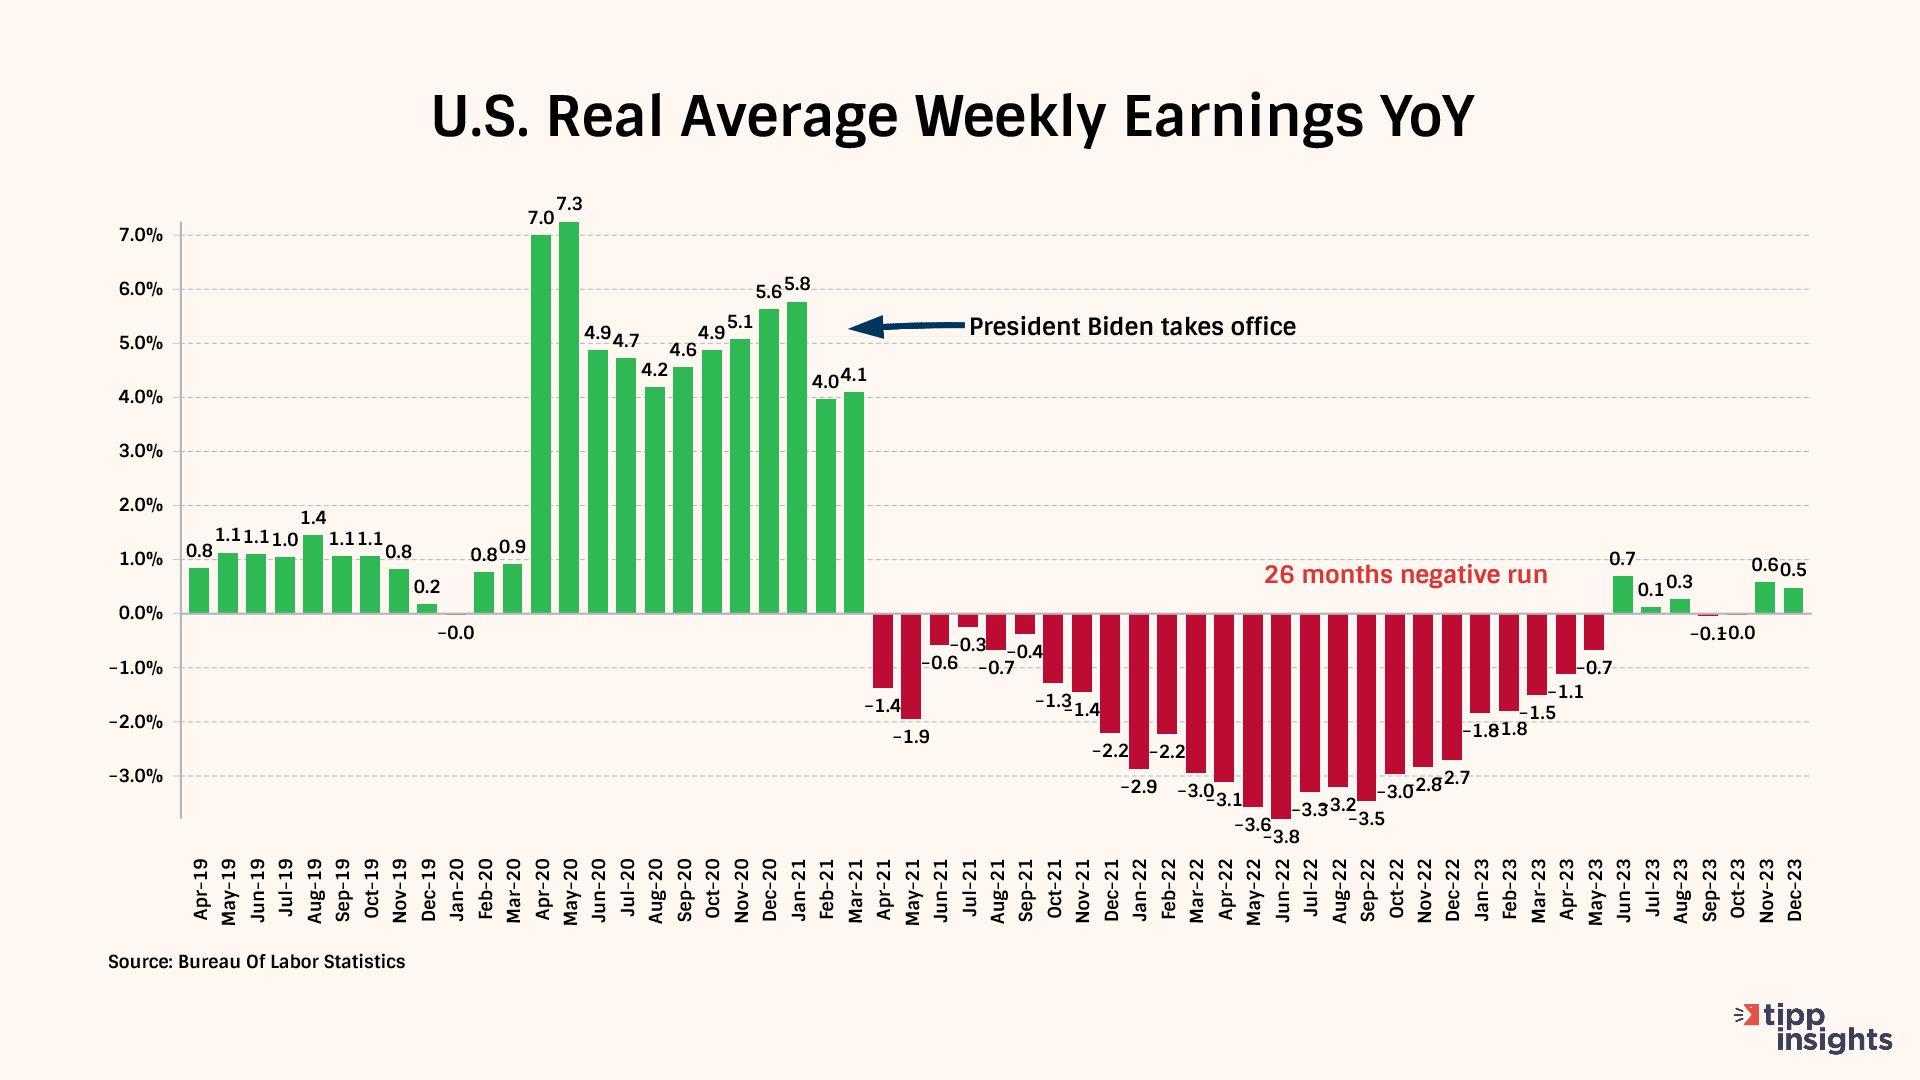
Nominal wages represent the amount of money one earns without considering changes in the cost of living. On the other hand, real wages consider inflation and measure the purchasing power of wages. Real wages provide a more accurate reflection of what is affordable with the income earned by factoring in the changes in the cost of living.
Real weekly wages, measured year-over-year, showed negative readings for 28 out of the 35 months during the Biden presidency from February 2021 to December 2023. The 26-month negative streak was broken in June, with only a 0.50% increase in December 2023.
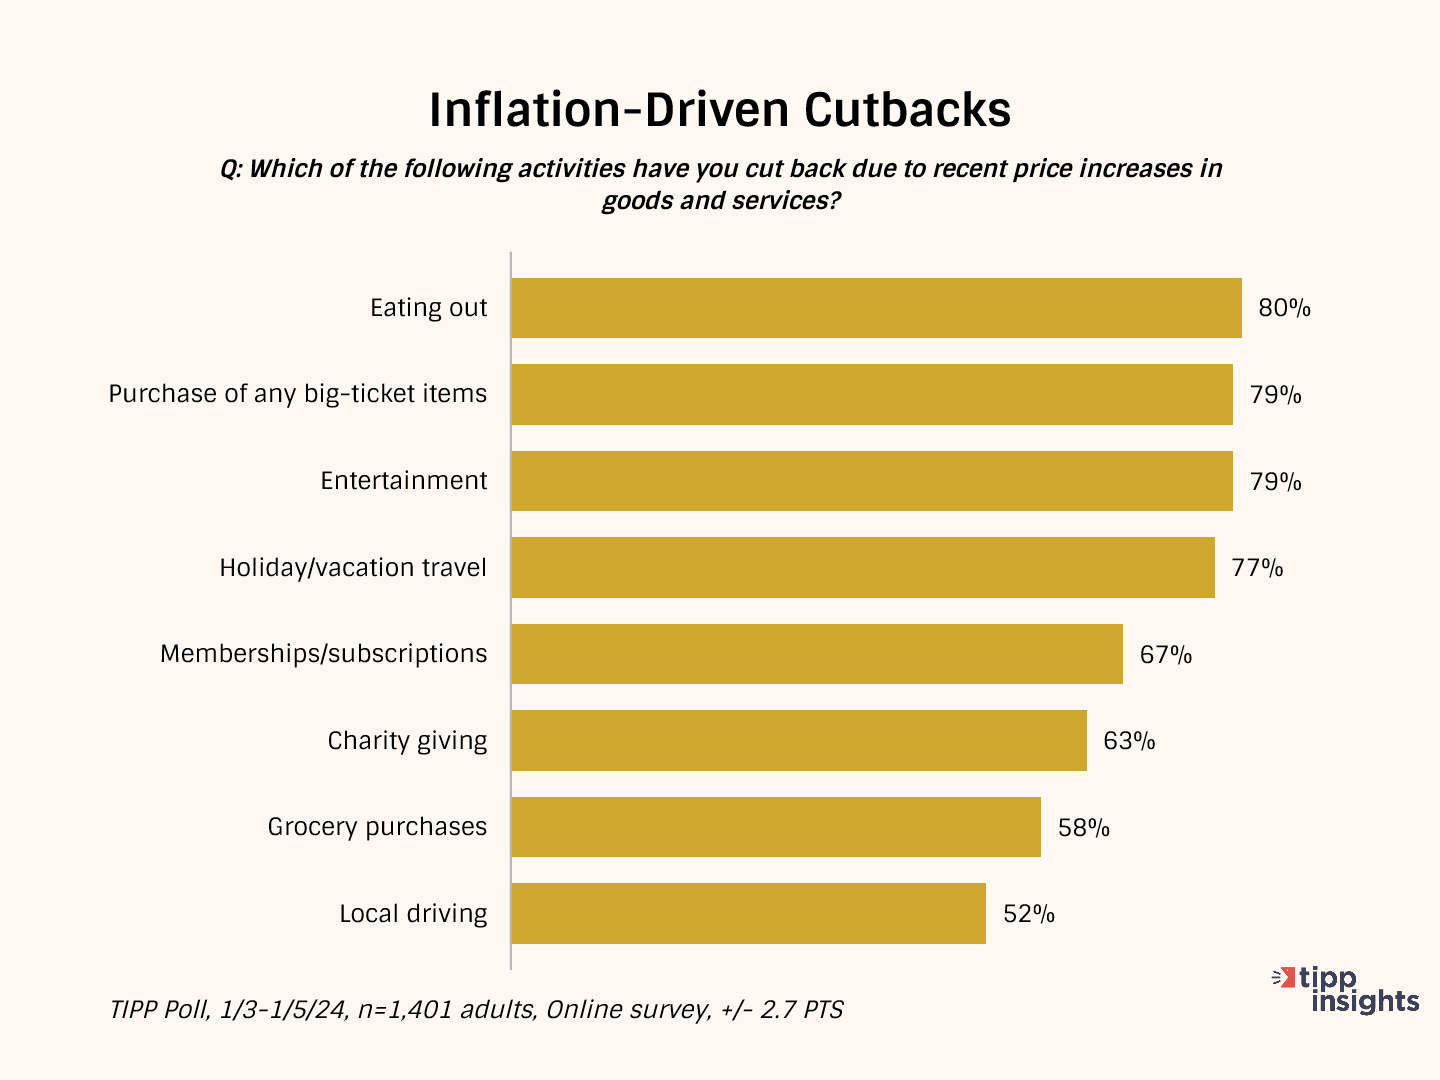
As a result of inflation, Americans are cutting back on household spending.
They are cutting back on eating out (80%), purchasing big-ticket items (79%), entertainment (79%), holiday/vacation travel (77%), and memberships/subscriptions (67%).
Nearly two-thirds (63%) are cutting back on even good causes such as charity giving. Over one-half (58%) of households spend less on groceries. The high gasoline prices forced 52% to cut back on local driving.
Inflation Direction
The chart below compares the 12-month average of monthly changes against the 6-month and the 3-month averages. We also show the reading for December 2023.
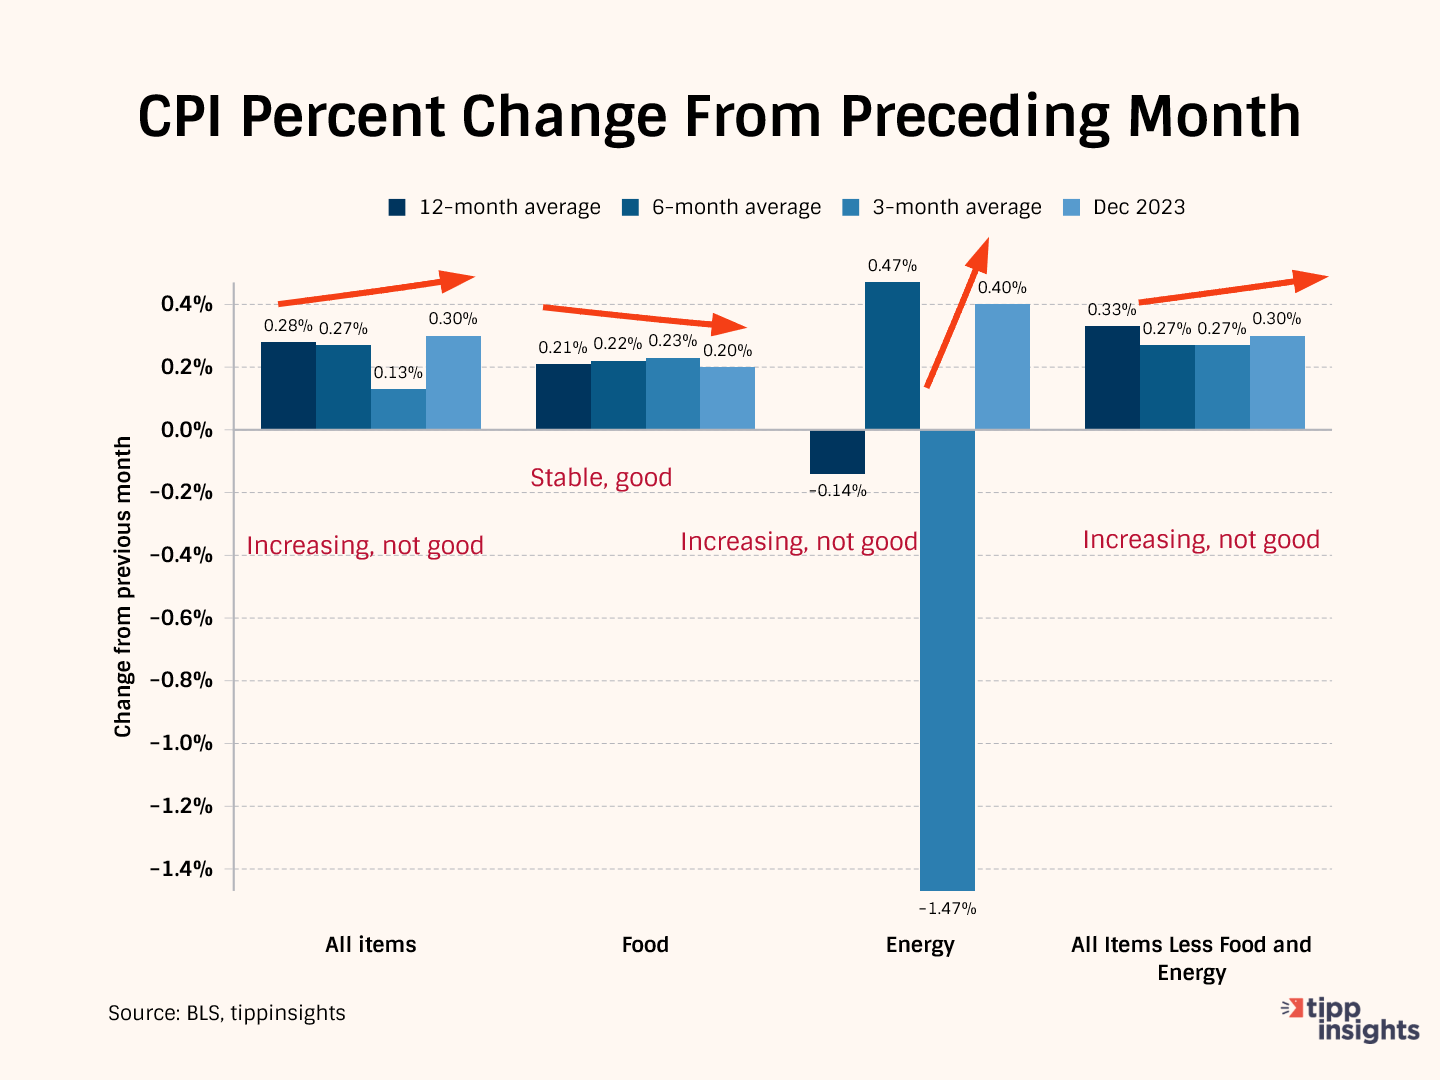
The 12-month average considers 12 data points and presents a long-term reference, while the six-month and three-month averages consider recent data points.
Typically, we compare the data from December 2023 to the three-month average to gain a clearer perspective. In December 2023, the price increase for All items was 0.30%, bigger than the three-month average of 0.13%. This shows a significant deterioration in December.
Meanwhile, the three-month average of 0.13% is lower than the six-month average of 0.27%, indicating a recent slowdown in the rate of increase over the last three months.
Furthermore, the six-month average of 0.27% is lesser than the twelve-month average of 0.28%, an improvement in the trend over the last six months.
This pattern suggests that price increases sharply accelerated in December, a cause for concern.
In December, Food prices rose by 0.20%, lower than the 3-month average of 0.23%, the 6-month average of 0.22%, and the 12-month average of 0.21%. The stability of the data is encouraging.
Meanwhile, Energy prices increased by 0.4%, more than the three-month average of -1.47%, indicating deterioration. It also outperformed the 12-month average of -0.14% but less than the six-month average of 0.47%. In summary, the energy situation is not good.
All items less food and energy, known as "core inflation," was 0.30%, higher than the three-month average of 0.27%, indicating deterioration for the month. Meanwhile, the three-month average of 0.27% was the same as the six-month average. However, they were less than the 12-month average of 0.33%. The recent December increase is worrisome.
In summary, except for food, we see deterioration in energy, core, and all items in December.
Monetary Policy
Since March 2022, the Fed has raised interest 11 consecutive times, bringing its benchmark interest rate to 5.25%, the highest level in 22 years.
With core CPI at 3.9% and geopolitical tensions that could lead to volatility in the energy markets, we are unsure of what lies ahead. With core inflation entrenched at the current rates, we believe it won't be easy to bring CPI inflation down to the Fed's target of 2.0% with interest rate cuts. The Fed has to strike a delicate balance between election-year pressures and achieving its goals.
The national debt crossed $34 trillion last week. On average, the government has borrowed $250,000 for each American household and is paying upwards of $1 trillion annually in interest—more than it spends on the nation’s defense!
One downside of ballooning federal debt is that refinancing becomes challenging. Supply and demand in the bond market will drive interest rates. If there is a high supply of government bonds (due to high debt levels), interest rates may need to stay high to attract investors and ensure that the government can continue borrowing money.
Most Americans are concerned about the sustainability of this trajectory. The high interest rates are also hurting Americans and sapping their confidence.
JPMorgan Chase CEO Jamie Dimon recently pointed out that extra COVID money keeping the consumer afloat will run out soon.
Credit is normalizing, but it's still lower. Stock prices are up. The consumer is in good shape. But the extra money that they got during COVID, trillions of dollars, that's kind of running out… It runs out this year. The government has a huge deficit which will affect the markets. But I'm a little skeptical in this kind of Goldilocks scenario.
It might be [a] mild recession or heavy recession. I think they did the right thing to raise rates. I think it was a little late, and I think they're doing the right thing just to wait and see what happens... It takes a while to see the full effect of that... but all of those factors may very well push us to recession, as opposed to a soft landing.
We agree with Jamie Dimon and believe a sluggish economy lies ahead in 2024.
To access the TIPP CPI readings each month, you can visit tippinsights.com. We'll publish the TIPP CPI and our analysis in the days following the Bureau of Labor Statistics (BLS) report. The upcoming release of TIPP CPI is on February 14, 2024. We'll also post a spreadsheet in our store for download.
Hey, want to dig deeper? Download data from our store for a small fee!
Want to understand better? We wrote an explainer on inflation that sixth graders could understand. Everyone can benefit from it. Milton Friedman's Priceless Lessons On Inflation.
We could use your help. Support our independent journalism with your paid subscription to keep our mission going.


