
The world has rarely been a riskier place to run a business than it is right now, and for the first time, there is a single number that says so.
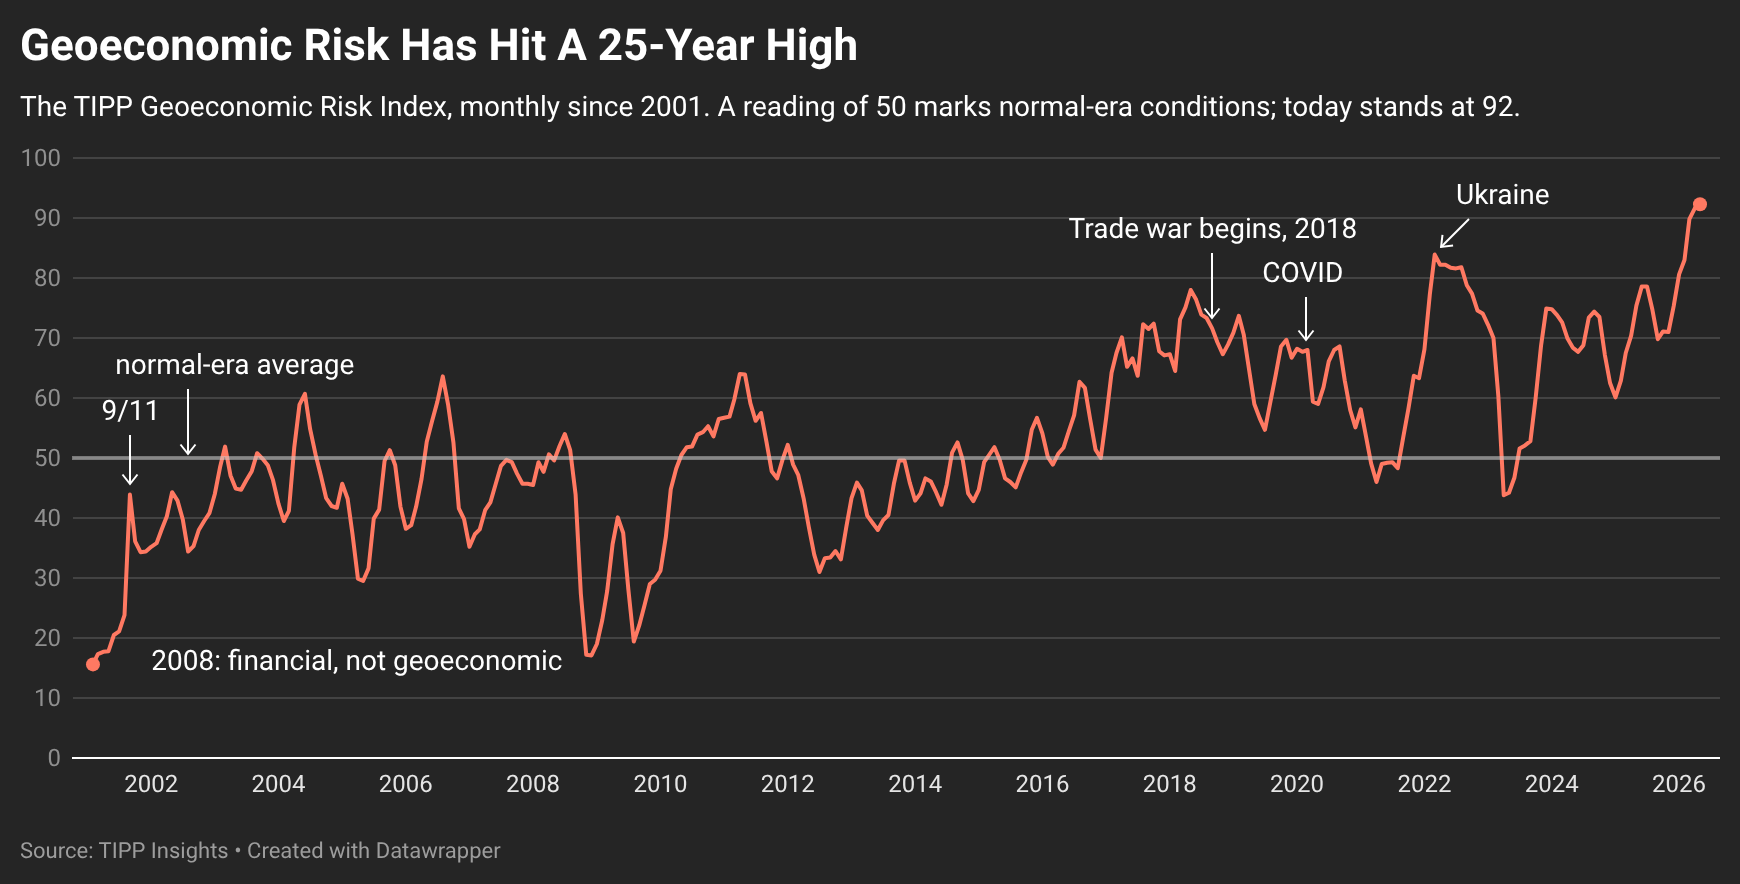
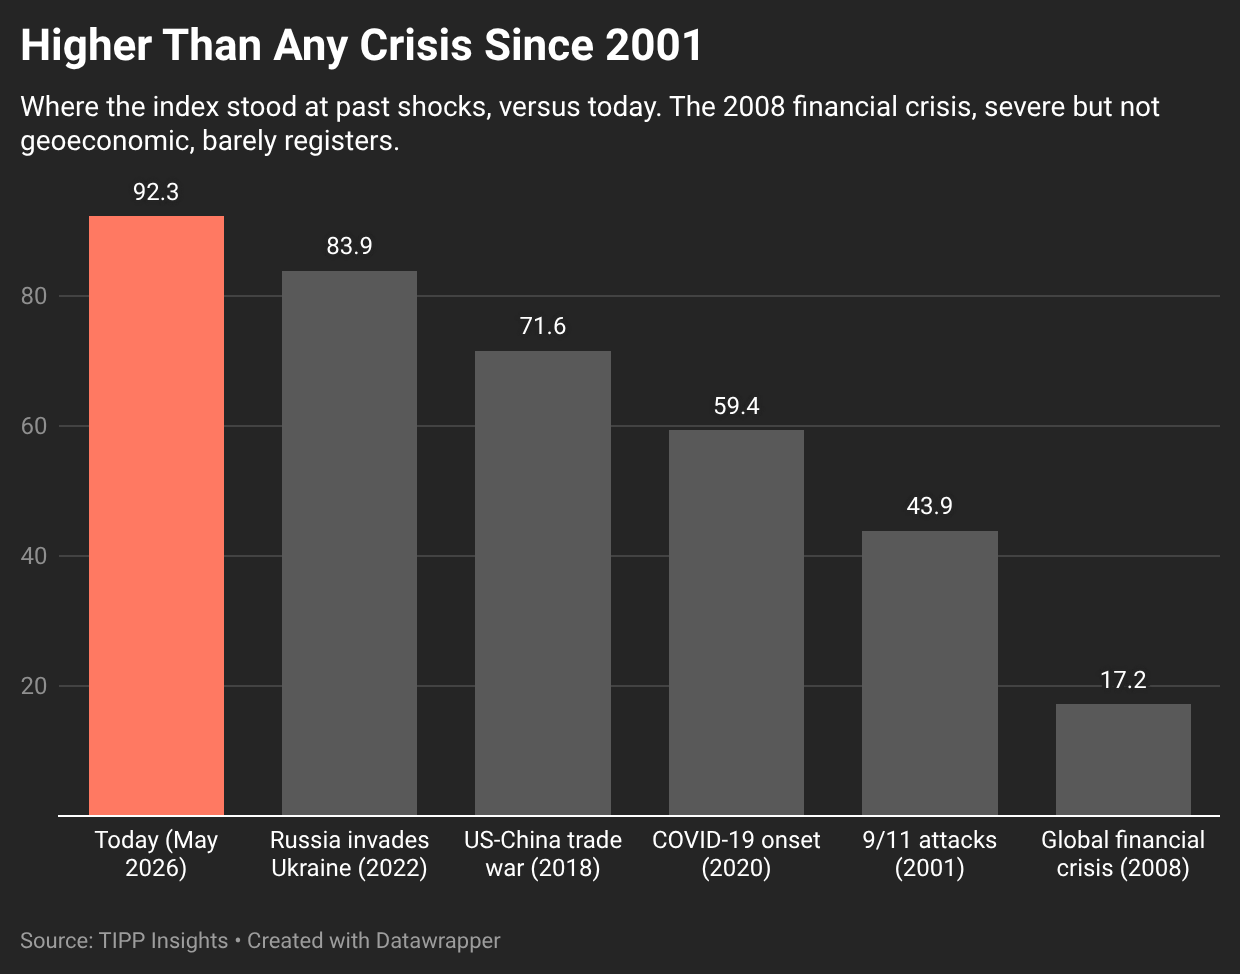
Today TIPP Insights launches the Geoeconomic Risk Index, a monthly gauge of the geopolitical, trade, and supply-chain pressures bearing down on the global economy. Its first published reading, for May 2026, is 92.3 out of 100, the highest in a record that stretches back to February 2001. It surpasses the previous high set in March 2022, in the weeks after Russia invaded Ukraine, and it sits far above where the index stood during the 2008 financial crisis, the 2016 Brexit shock, or the opening of the US-China trade war.
For the executives and investors who read Power & Capital, the headline is less the number itself than what is driving it.
The index rests on four measures. Three are external and widely used: a geopolitical risk gauge built from global news coverage of war and conflict; a trade-policy uncertainty measure that tracks turbulence in tariffs and trade rules; and the Federal Reserve's supply-chain pressure index, which reads the state of global shipping and manufacturing. The fourth is TIPP's own: a quarter-century of polling on America's standing in the world, the one component that captures how the country's global position is actually perceived. The four are weighted equally, so three-quarters of the index rests on independent, publicly published data: the supply-chain measure is the New York Fed's, and the geopolitical-risk and trade-policy gauges are the work of Federal Reserve economists. The full method is published separately for anyone who wants to verify it.
Trade policy is the engine
There is something unusual about this peak. Geoeconomic risk has historically spiked around wars and the threat of them, so a reading driven this time by trade policy marks a genuine break from the pattern. When we strip the index back to its component pressures, trade-policy uncertainty is the single largest contributor to today's reading, so much so that removing it entirely is the only adjustment that knocks May 2026 out of the top spot, and even then it remains among the four most stressed months on record.
The implication is concrete. The dominant risk facing cross-border commerce today is not a distant war but the rules of trade themselves: which goods are tariffed, at what rate, under what legal authority, and for how long. The flare-up around Iran and the persistent strain on shipping lanes add to the total, but it is the trade environment that has pushed the index past every prior peak. For a company that imports, exports, or sources anything across a border, that is the exposure to manage first.
Why this number can be trusted
A new index invites a fair question: why believe it? The answer is that we built it to be tested, and then we tested it against 25 years of history. The Geoeconomic Risk Index was developed by Raghavan Mayur, founder and president of TIPP Insights, drawing on the firm's quarter-century of polling.
What gives us confidence is how it behaves at the moments we already understand. It climbed after the September 11 attacks, through the Iraq invasion, around Brexit, into the trade war, and to its prior record when Ukraine was invaded. Just as importantly, it stayed calm during the one crisis it should have ignored: the 2008 financial meltdown. As markets collapsed that autumn, the index fell toward its all-time low, correctly, because the 2008 crisis, for all its severity, involved no war, no trade rupture, and no supply shock. It was a financial crisis, not a geoeconomic one. An index that screams at every piece of bad news is useless; one that distinguishes a banking panic from a trade war is telling you something real.
The index also rewards breadth. A narrow shock that strikes one front, a terror attack or a single annexation, moves it modestly. The extreme readings come when several pressures fire at once. Today's 92 reflects exactly that: trade conflict, geopolitical tension, and supply strain stacking on top of one another.
Where things stand now
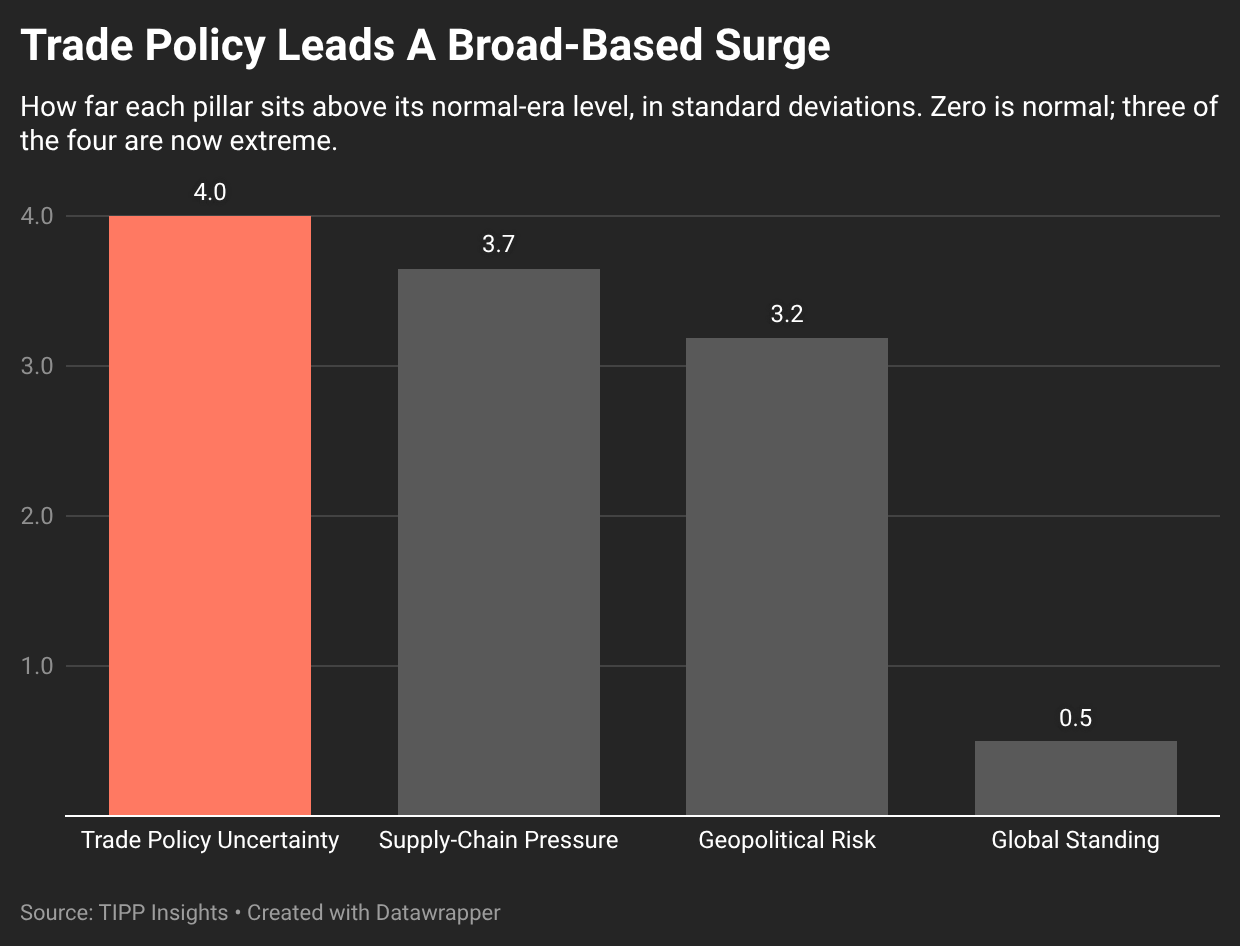
Beneath the headline number, the index is built from four pressures, and three of them are now at extremes. Trade-policy uncertainty is the most stretched, running about four standard deviations above its normal-era level, territory seen in only a sliver of the past 25 years. Supply-chain pressure and geopolitical risk follow close behind, both more than three standard deviations above normal. Only the fourth pillar, America's standing in the world as measured by TIPP's polling, sits nearer its historical range. The picture is not one acute emergency so much as several elevated pressures at once, with the rules of trade the sharpest among them. That combination, broad and trade-led, is what has carried the index past every prior peak.
What to watch
The index reports through May 2026, the last month for which all its public inputs are complete; June updates as those series publish mid-month. But the direction of travel is clear, and for decision-makers it sharpens a few questions worth carrying into the next planning cycle.
How much of your cost base sits behind a border that could be re-tariffed on short notice? Where in your supply chain would a single chokepoint closure hurt most? And how exposed is your demand to a slowdown in the economies most rattled by all of this?
We will publish a fresh reading every month, and we will return to the index whenever the news demands it. The goal is simple: to give the people who make decisions a steady, honest measure of how dangerous the world has become for the business of doing business.
The Geoeconomic Risk Index is a Power & Capital franchise. Figures as of 9 June 2026; the full methodology is published separately.
🧭 POWER & CAPITAL · June 9, 2026
Where state power meets the boardroom.
🔷 Metals Tariffs Reset Hits, Full Customs Value Now Bites: the revamped Section 232 regime on steel, aluminum and copper takes effect.
🔷 Chips Claw Back After Wall Street's Worst Day of the Year: semiconductors bounce, but jobs and inflation keep the Fed in focus.
🔷 Tehran Tries to Put a Price on the Strait of Hormuz: Iran signals it will reopen the chokepoint only on its own terms.
🔷 China's Super Buyer Widens Its Reach Beyond Iron Ore: Beijing taps CMRG to steer overseas mining deals.
🔷 Treasury Turns Its Sanctions Fire on Iran's Crypto Rails: OFAC blacklists Tehran-linked digital-asset exchanges.
📊 Market Mood · June 9, 2026
How the trading day is setting up.
🟩 Markets opened higher as easing tensions in the Middle East and a rebound in AI chip stocks helped restore investor confidence.
🟧 Hopes for a U.S.-Iran agreement improved after President Donald Trump said a “total victory” could come within two weeks, while both Iran and Israel paused direct attacks despite the fragile truce.
🟦 Investors are now focused on Wednesday’s CPI report, which could determine whether the Fed keeps rates higher for longer or gains room to ease policy later this year.
🟨 The AI investment boom regained momentum as OpenAI confidentially filed for an IPO, major memory-chip makers rebounded, and Applied Digital surged after securing a long-term hyperscaler lease.
🗓️ Key Economic Events
On today's U.S. data calendar.
🟧 10:00 a.m. ET — Existing Home Sales (May)
Forecast: 4.07 million vs. 4.02 million previous. Investors will watch whether the housing market is showing resilience despite elevated mortgage rates and tighter financial conditions, offering another gauge of the economy's underlying strength.
Letters to the editor email: editor-tippinsights@technometrica.com
Subscribe Today And Make A Difference. Consider supporting Independent Journalism by upgrading to a paid subscription or making a donation. Your support helps tippinsights thrive as a reader-supported publication. Contact us to discuss your research or polling needs.
Reach our audience. For sponsorship and advertising opportunities, visit our Partner With Us page.


