
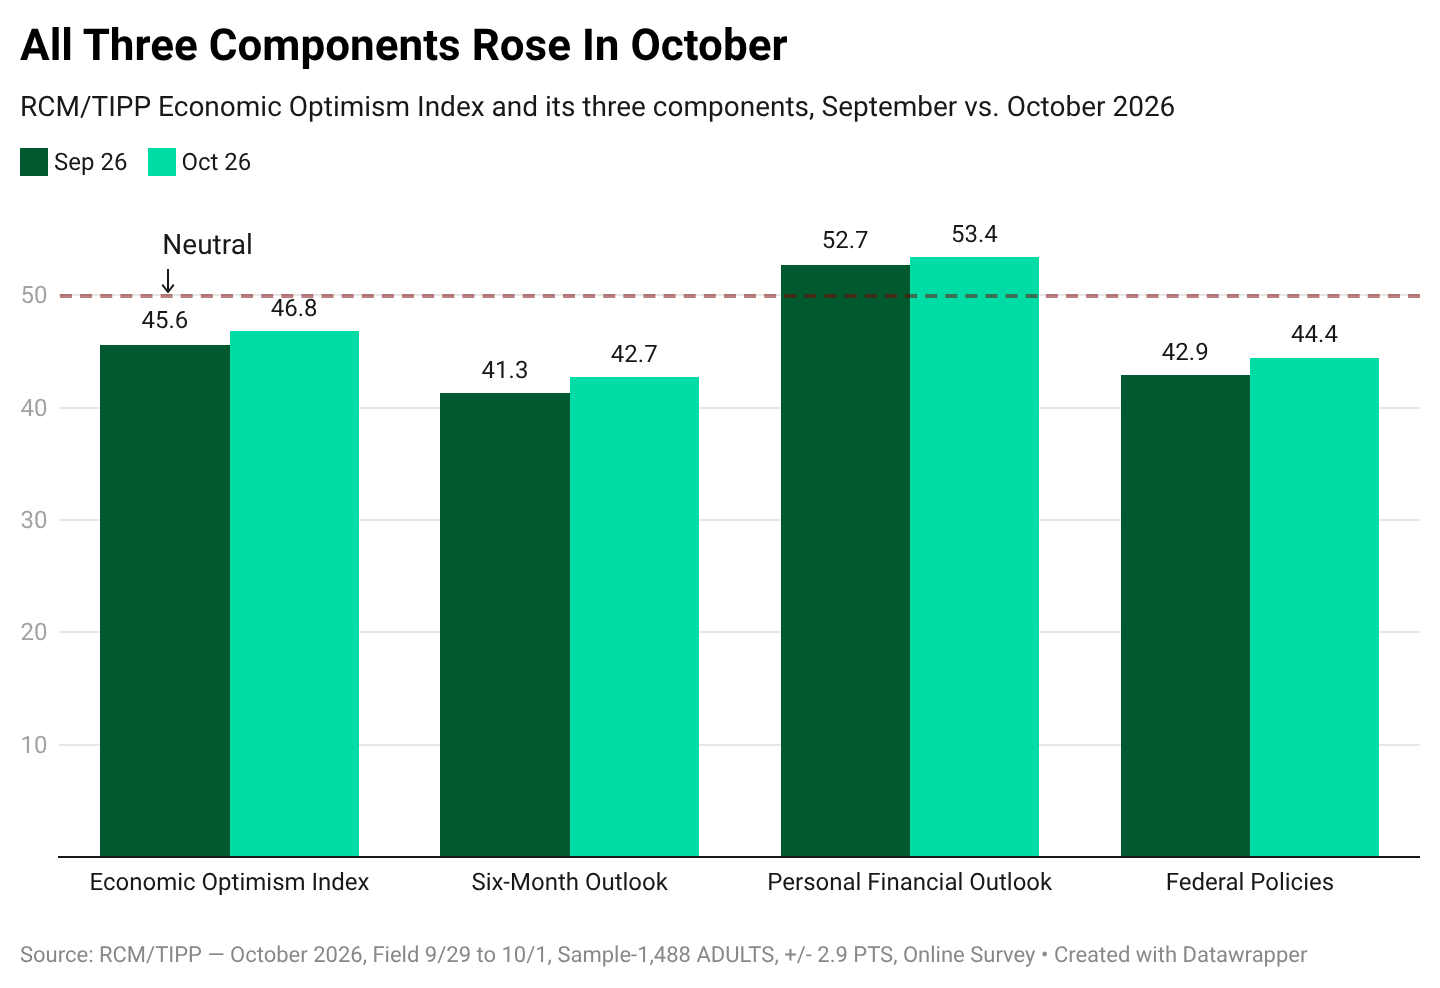
The RealClearMarkets/TIPP Economic Optimism Index rose 1.2 points to 46.8 in October, up from 45.6 in September, a 2.6% gain. It was the second straight monthly increase, lifting the index to its highest level since March. All three components advanced together for the first time since July.
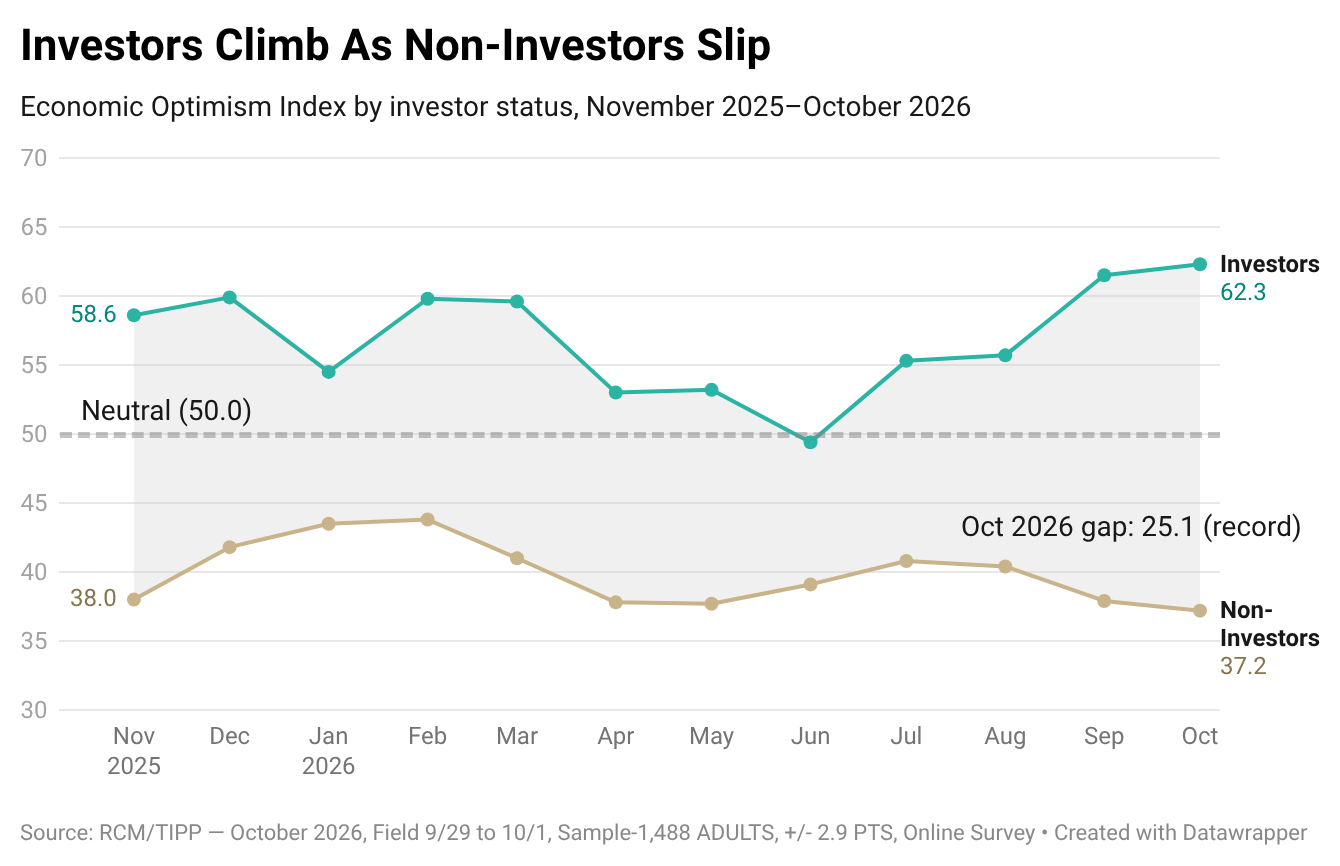
The improvement, however, did not reach everyone. Investors, college graduates, and households earning $75,000 or more drove the gains. Non-investors and every income group below $75,000 lost ground.
The index has now stayed below the neutral 50 mark for fourteen consecutive months. The last reading at or above 50 came in August 2025, at 50.9.
October’s 46.8 sits 4.5% below the 309-month historical average of 49.0. Since February 2001, the index has registered at or above 50 in 127 of 309 months, or 41.1% of the time. October’s reading is higher than about 35% of all monthly readings, which places it in the lower half of the index’s history but well above its record low of 35.8 in August 2011.
The RCM/TIPP Economic Optimism Index has a strong track record of anticipating the consumer confidence indicators released later each month by the University of Michigan and The Conference Board. From February 2001 to October 2023, TIPP produced the index in partnership with Investor’s Business Daily.
RCM/TIPP surveyed 1,488 adults from September 29 to October 1. The online survey was conducted using TIPP’s panel network, and the margin of error is ±2.9 percentage points. The index runs from 0 to 100: readings above 50 signal optimism, readings below 50 signal pessimism, and 50 is neutral.
The Components
All three components rose in October, and each reached its highest reading since March.
- Six-Month Economic Outlook: rose 3.4%, from 41.3 to 42.7, a second consecutive gain. The forward-looking measure has now recovered all the ground it lost in August.
- Personal Financial Outlook: rose 1.3%, from 52.7 to 53.4, its 28th consecutive month above the neutral 50 line. It remains the only component in optimistic territory.
- Federal Economic Policies: rose 3.5%, from 42.9 to 44.4, a fifth consecutive monthly gain. It is the longest winning streak among the three components.
Party Dynamics
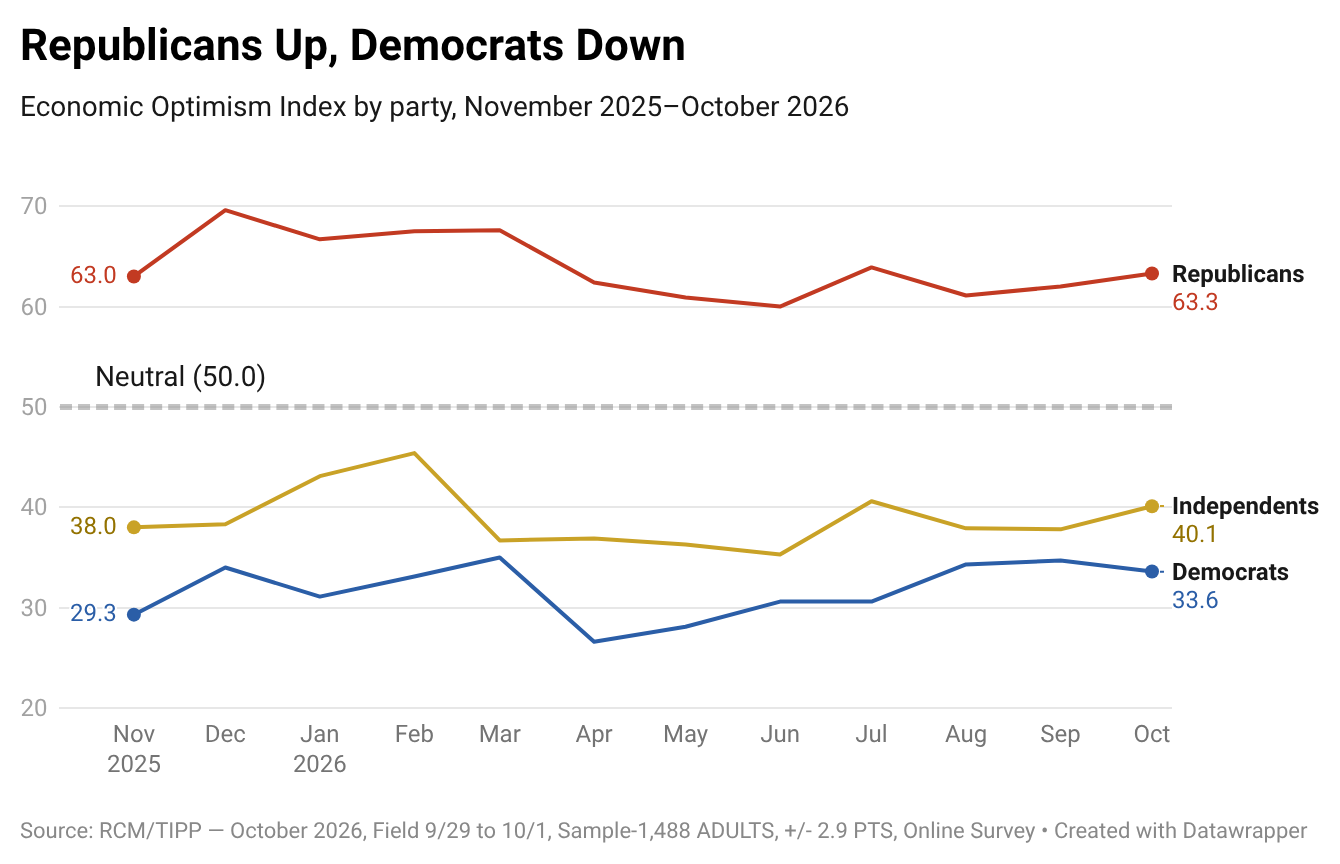
The partisan gap widened in October as Republicans and Democrats moved in opposite directions. Republican optimism rose 1.3 points to 63.3, while Democratic optimism slipped 1.1 points to 33.6. The gap between them grew from 27.3 to 29.7 points, though it remains well below the 37.0-point gap of October 2025.
Independents posted the largest gain of the three, rising 2.3 points to 40.1, their highest reading since July. Much of that came from the Six-Month Outlook, where independents jumped 4.2 points to 36.4.
Personal finances drove much of the partisan split this month. Republicans’ Personal Financial Outlook rose to 65.3 from 62.2, while Democrats’ fell to 43.8 from 46.5. Democrats’ confidence in federal economic policies was little changed at 29.6, against 63.6 for Republicans.
Investor Confidence
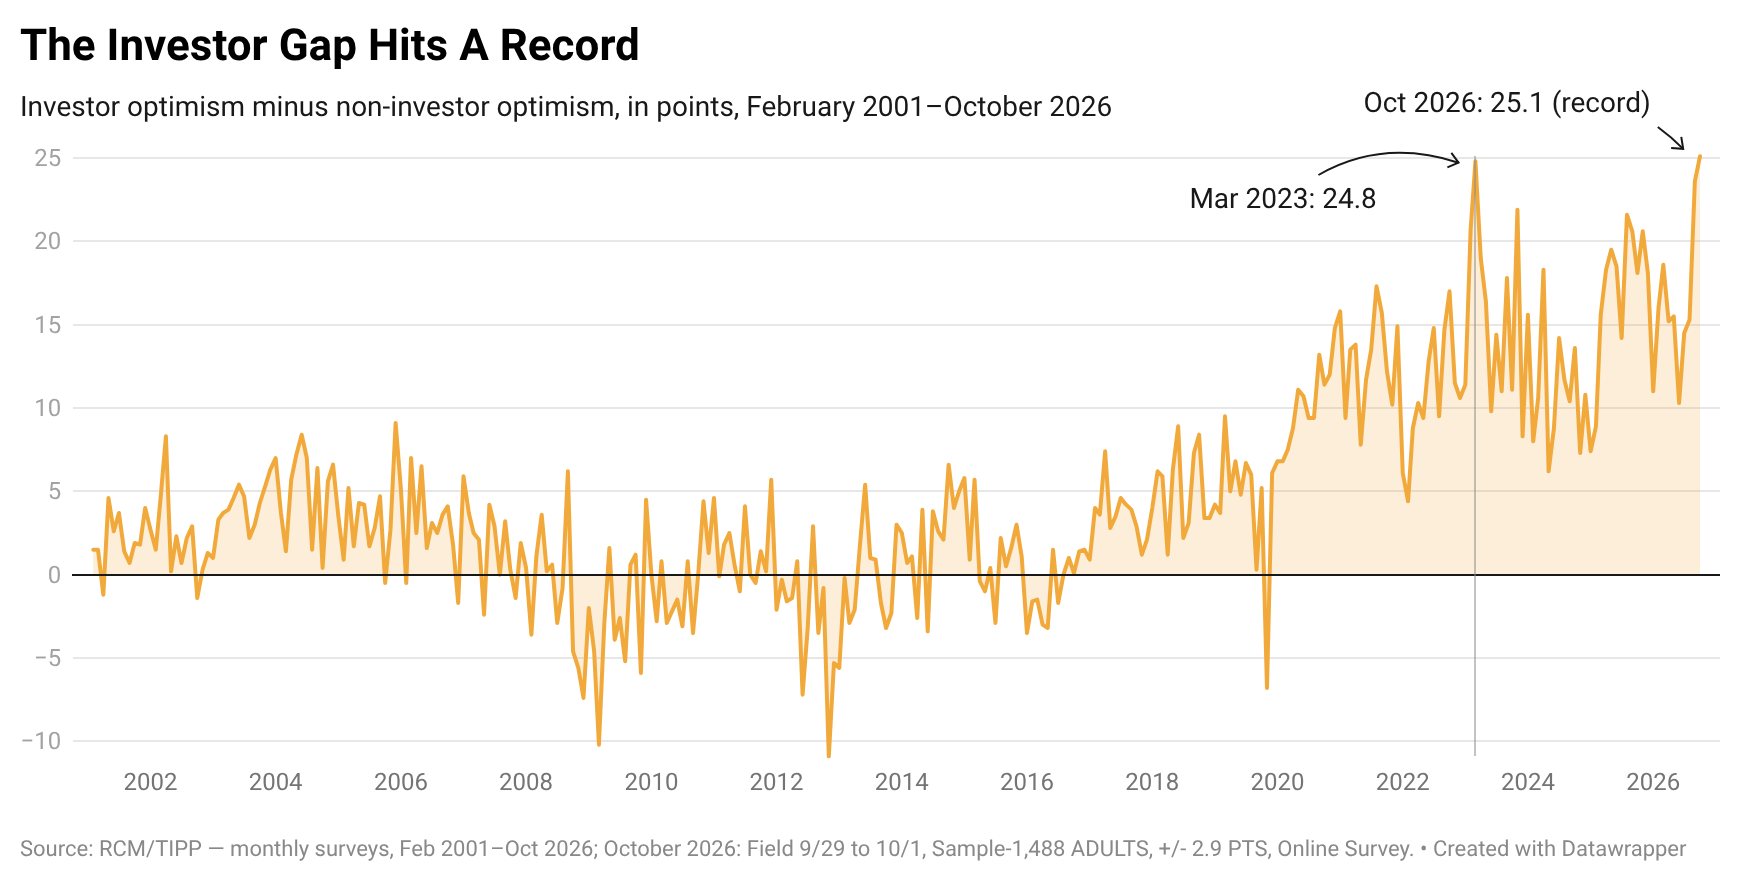
The gap between investors and non-investors reached a record in October. Investor optimism rose 0.8 points to 62.3, its highest reading since September 2025 and a fourth consecutive month above 50. Non-investor optimism fell 0.7 points to 37.2, its lowest since April 2024.
The resulting 25.1-point gap is the widest since the index began in February 2001. It surpasses the previous record of 24.8 points, set in March 2023, and follows September’s 23.6, now the third-widest on record. Three months ago, in July, the gap stood at 14.5 points.
The split runs through every component. Investors scored 60.0 on the Six-Month Outlook, 66.6 on Personal Finances, and 60.3 on Federal Policies. Non-investors scored 32.2, 45.4, and 34.1, all lower than in September.
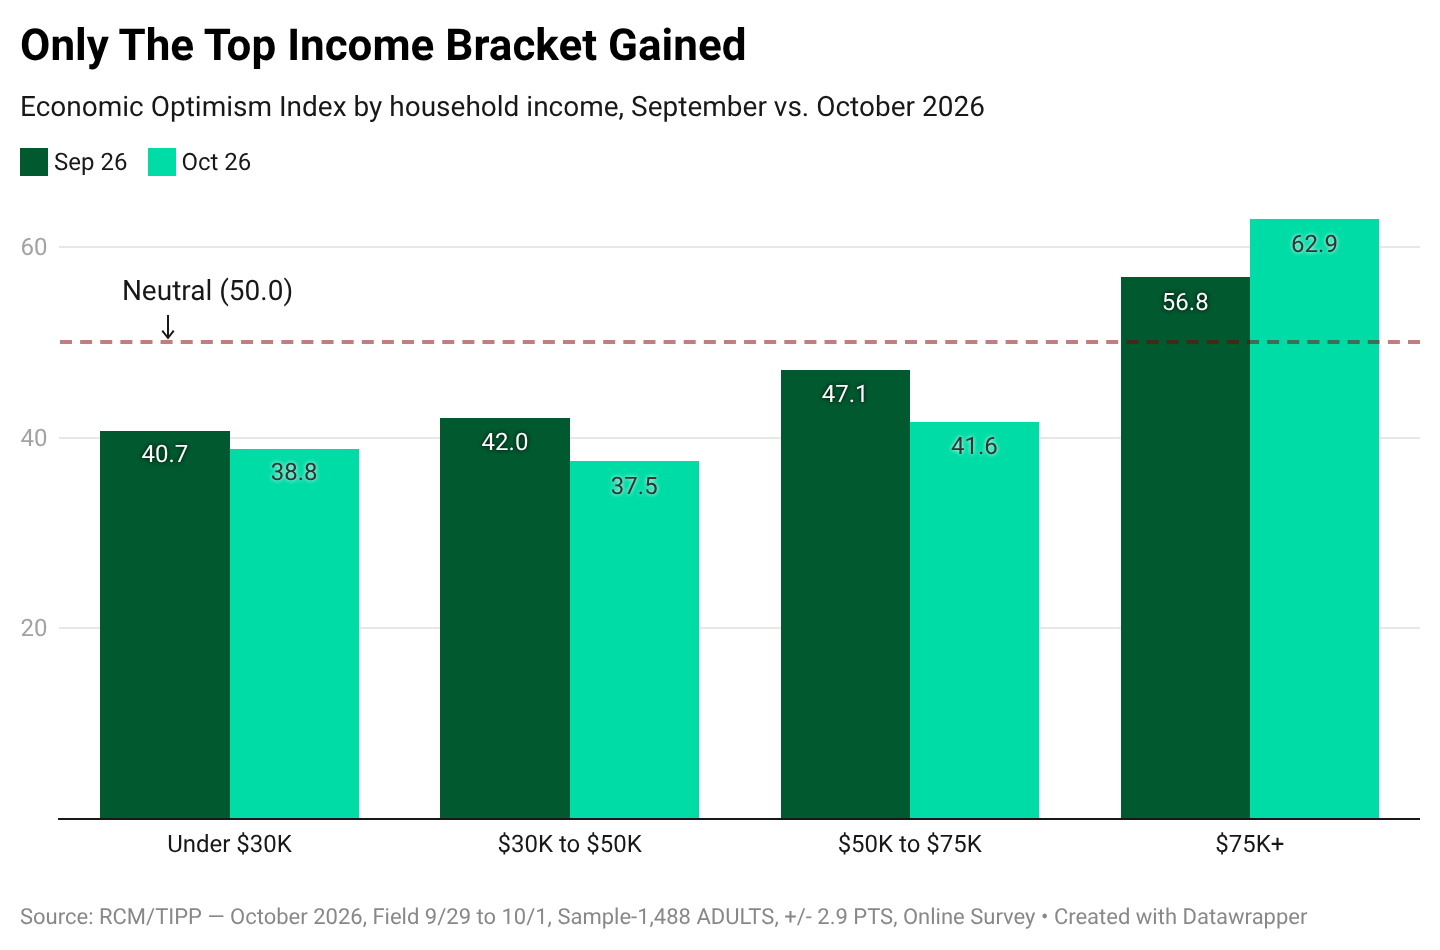
The income ladder tells the same story. Households earning $75,000 or more jumped 6.1 points to 62.9, their highest since August 2025. Every bracket below them fell: under $30,000 by 1.9 points to 38.8, $30,000 to $50,000 by 4.5 points to 37.5, and $50,000 to $75,000 by 5.5 points to 41.6. The 24.1-point spread between the top and bottom brackets is the third-widest on record, behind March 2023 and November 2023.
Momentum
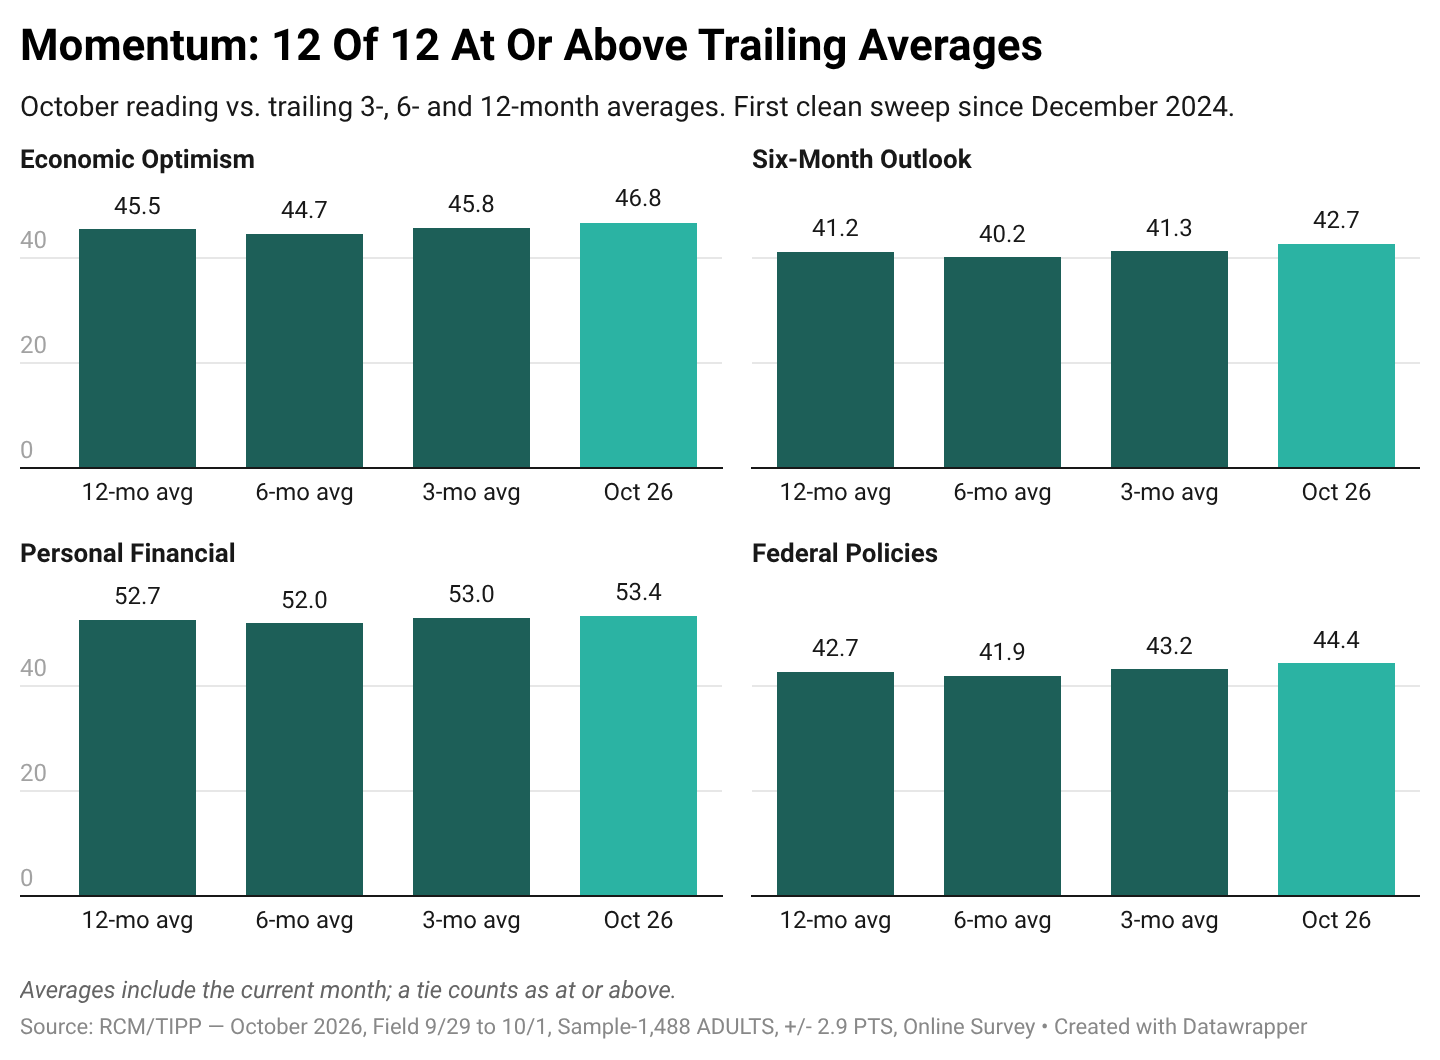
October’s readings ran at or above their trailing averages on all 12 momentum measures, the first clean sweep since December 2024. The scorecard compares the headline index and each component against its own three-, six-, and twelve-month averages.
The score has climbed steadily since early summer: 1 of 12 in June, 8 in July, 9 in August, 11 in September, and 12 in October.
Demographic Analysis
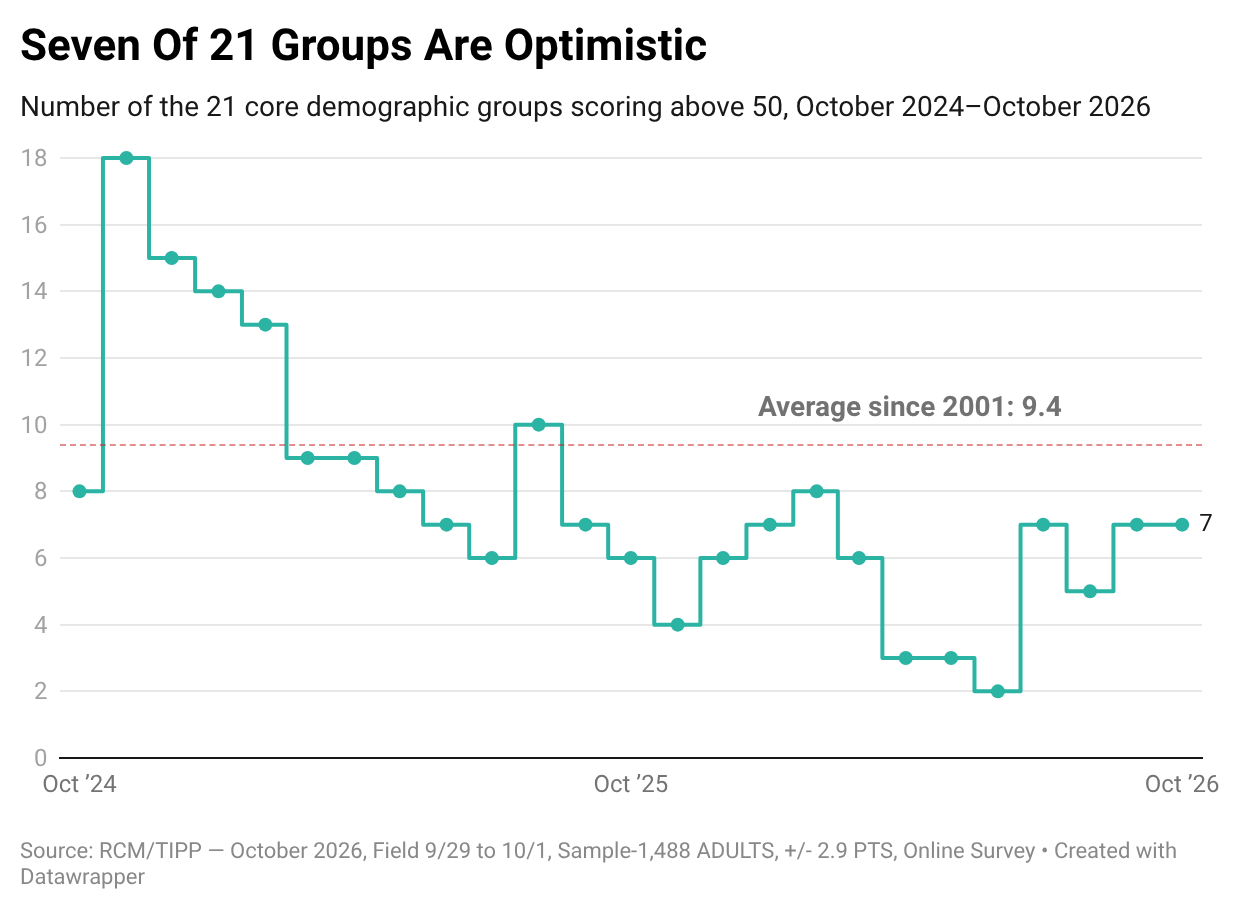
Seven of the 21 core demographic groups scored above 50 in October, the same as in September. The count has now stayed below its long-run average of 9.4 for fourteen consecutive months, the same span as the headline index’s run below 50.
The month’s other divides lined up with the investor split:
- Gender: Men rose to 54.9 and women to 38.9, widening the gender gap to 16.0 points from 15.2.
- Age: Adults 65 and older fell 3.6 points to 33.5, their lowest reading since October 2023 and the lowest of any age group.
- Education: College graduates rose 5.6 points to 56.6, while those with a high school education fell to 43.2 and those with some college fell to 38.1.
- Area type: Urban residents climbed 5.9 points to 57.1. Suburban residents fell 3.3 points to 41.5, and rural residents held at 38.8.
- Region: The Northeast posted the largest regional gain, rising 4.6 points to 49.9, just short of the neutral line.
Financial Stress
The RCM/TIPP Financial-Related Stress Index edged down 0.2 points to 64.5 in October, a 0.3% decline from September’s 64.7. On this index, higher readings mean more stress.
The index has averaged 60.6 since December 2007, and October’s reading sits 6.4% above that norm. It has run above its long-run average for 22 consecutive months. The last reading below 50 came in February 2020, before the pandemic, at 48.1.
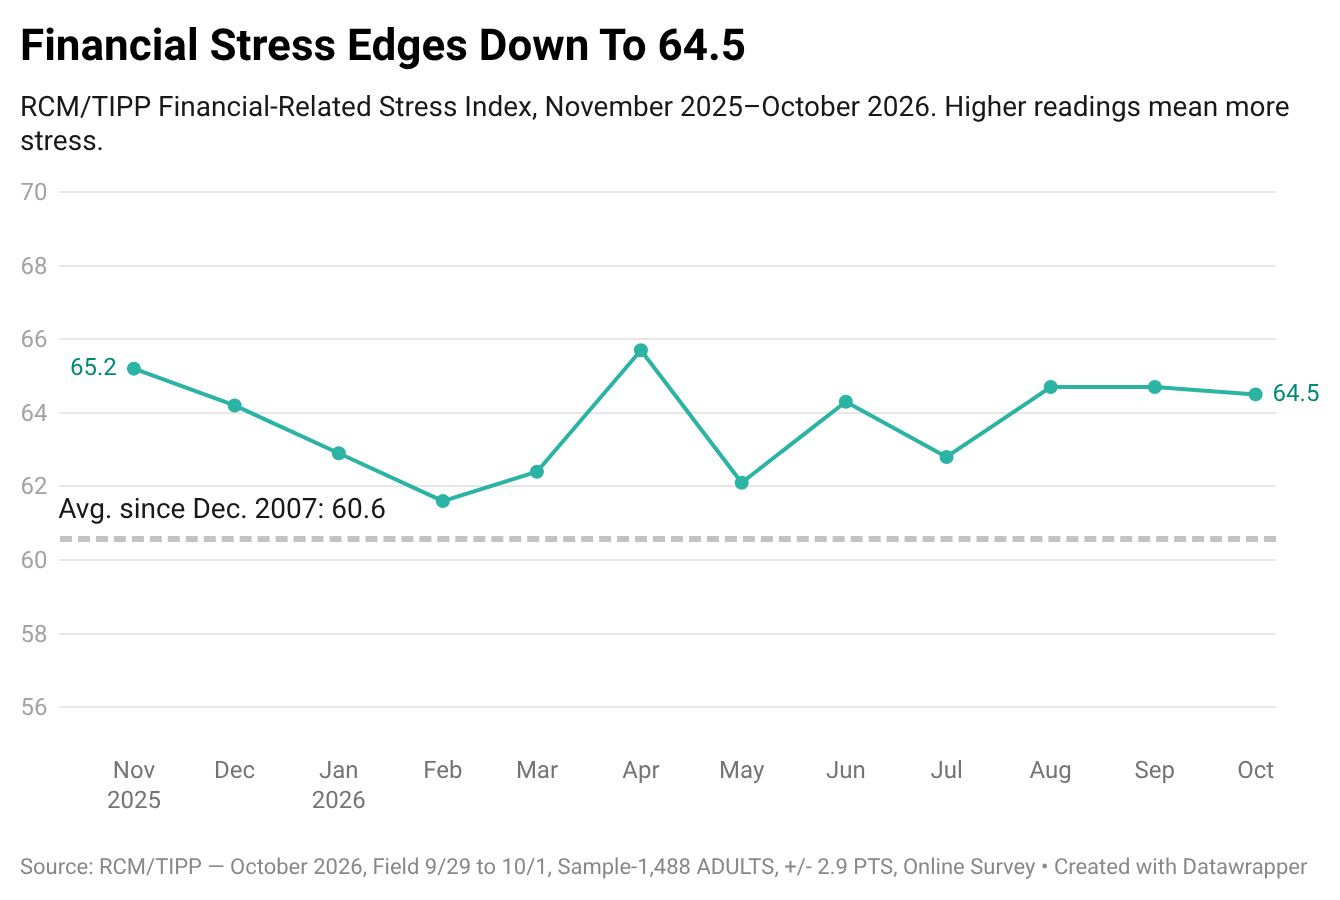
The headline decline was narrow. Stress rose for 13 of the 21 core groups, eased for seven, and was unchanged for one. Most of the overall drop came from adults aged 18 to 24, whose stress fell 15.1 points to 54.6, a large move for a small subgroup whose readings tend to swing widely.
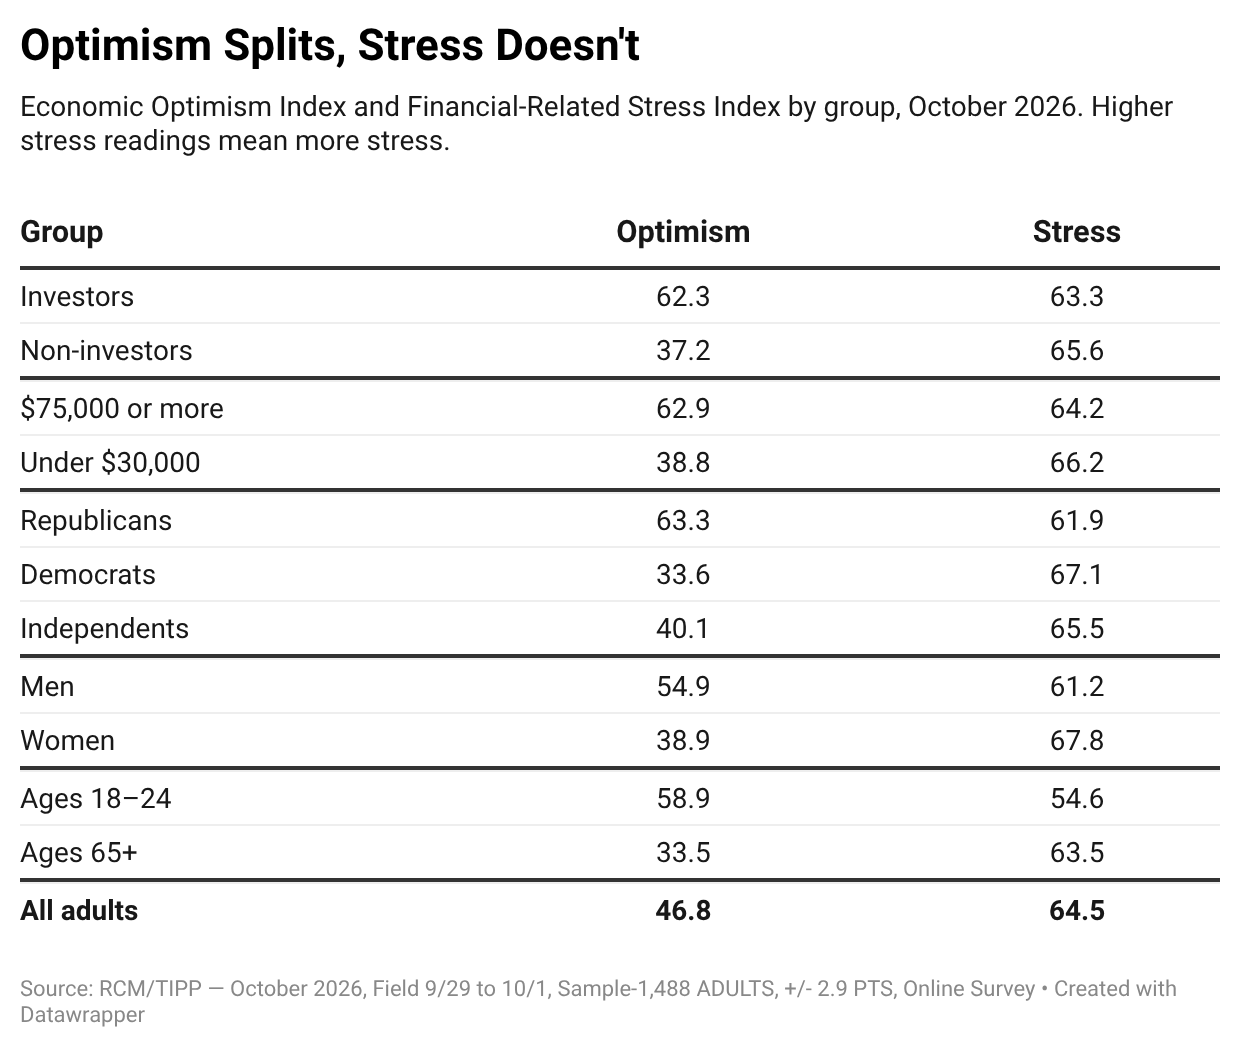
Stress rose among several groups whose optimism also improved. Households earning $75,000 or more saw stress climb 3.7 points to 64.2, and Republicans rose 2.1 points to 61.9. Adults aged 45 to 64 rose 2.7 points to 68.7, and those 65 and older rose 2.5 points to 63.5.
The most stressed groups were single women at 69.8, white women at 68.8, and adults aged 45 to 64 at 68.7.
Stress And Optimism Side By Side
Optimism split sharply in October, but financial stress barely did. Investors outscored non-investors by 25.1 points on optimism, yet their stress readings differed by only 2.3 points. The top and bottom income brackets were 24.1 points apart on optimism and 2.0 points apart on stress.
In other words, the groups pulling ahead are more confident about the economy without feeling much less financial pressure. Every one of the 21 core groups registered stress above 50.
The next RCM/TIPP Economic Optimism Index will be released at 10 a.m. EST on November 3, 2026. Full methodology is available here.
🧭 Power & Capital · October 8, 2026
Where state power meets the boardroom.
🔷 US Regulator Investigates Wells Fargo Over Race-Based Homeownership Programs – Power & Capital Desk, TIPP Insights
🔷 Michigan Republican Mike Rogers Calls For End To Canada Tariff War – Power & Capital Desk, TIPP Insights
🌍 Global Affairs
The world's flashpoints, in motion.
🟥 Trump Says U.S. Does Not Suspect Bioweapon In Russian Plague Case – TIPP News
🟥 Libertarian Realism As Foreign Policy – Joseph Solis-Mullen, Mises Wire
🟥 Scientists Identify New Ancient Crocodile Species From Rock Used To Build Great Sphinx – TIPP News
🏛️ National Affairs
The fights shaping America right now.
🟫 Trump Approves Firing Squad For Radical Islamic Terrorist – Elizabeth Troutman Mitchell, The Daily Signal
🟫 Why Did ICE Review 99 Million Records For Suspected Noncitizen Voters – TIPP News
🟫 International Students Could Face $70,000 Fee Under New US Proposal – TIPP News
🟫 Two Suspects Identified In Stabbing Of Off-Duty NYPD Detective – TIPP News
🟫 What Is The Golden Dome Actually Providing? – Caroline Berkness, The Daily Signal
🟫 Arizona University Halts Fraternity Activities Amid Hazing Investigations – TIPP News
🟫 Man Sentenced To 18 Months For $8 Million AI Streaming Fraud – TIPP News
🟫 American Airlines Flight Diverts After Six Of Eight Bathrooms Fail – TIPP News
📈 Economy
Prices, policy, and the pressure on your wallet.
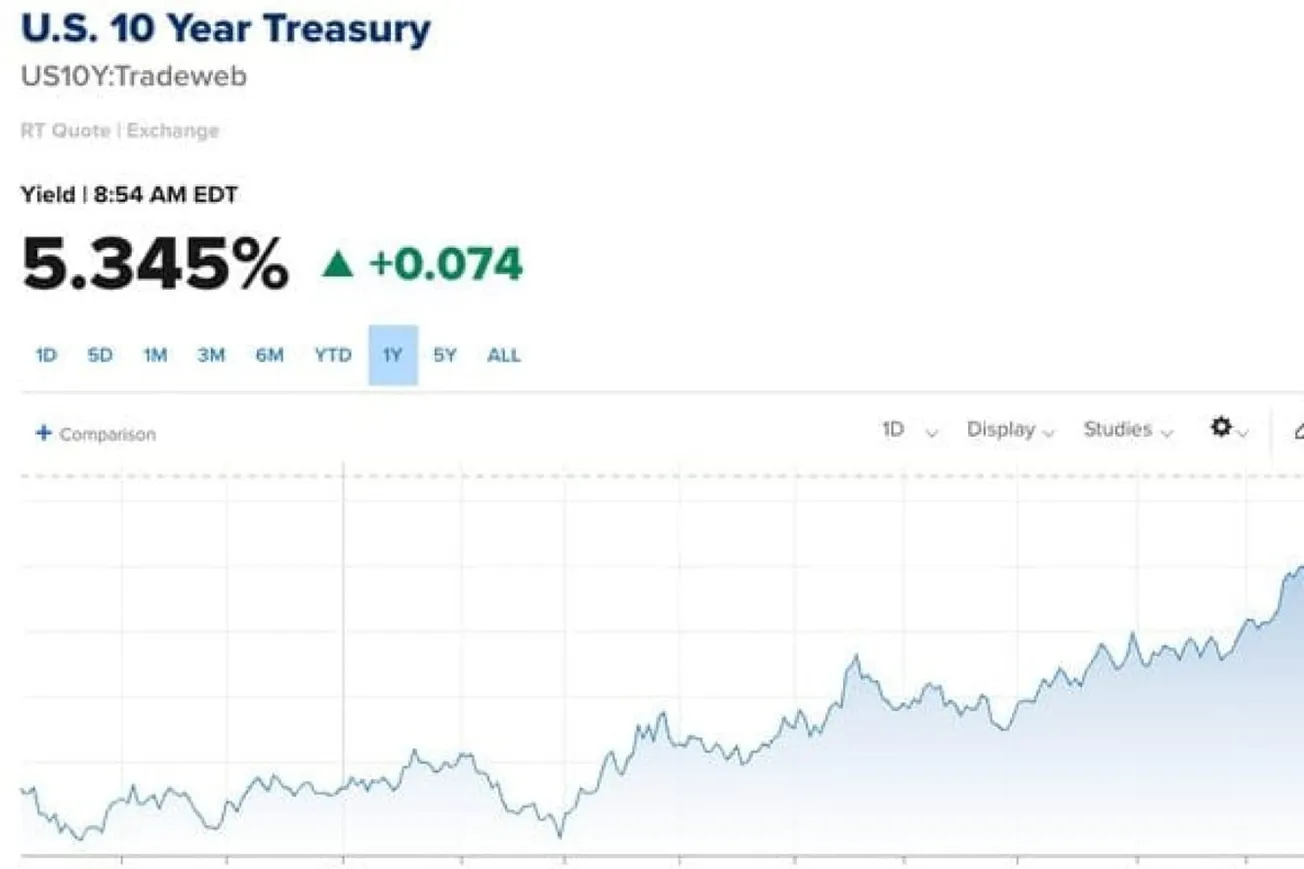
🟩 10-Year Treasury Yield Hits Highest Level Since 2002 – TIPP News
🟩 U.S. Inflation Expectations Hit Highest Level Since May 2023 – TIPP News
🟩 Debt Arising From Central Bank Credit Leads To Economic Crises – Frank Shostak, Mises Wire
🟩 Social Security Is Just A Transfer Payment From Workers To Retirees – Ryan McMaken, Mises Wire
🟩 Government Should Liquidate Itself – George Ford Smith, Mises Wire
🟩 Get Off My Lawn (And Out Of My Lungs): A Property-Rights View Of Pollution – Xavier Kanji, Mises Wire
🟩 Equality Before The Law Does Not Mean Equality Of Subjective Feelings – Wanjiru Njoya, Mises Wire
📊 Market Mood · October 8, 2026
How the trading day is setting up.
🟥 Oil is surging again as Middle East tensions intensify. Brent has climbed above $103 a barrel following another reported tanker attack near Qatar, renewing concerns about energy supplies and inflation.
🟧 Treasury yields remain a major threat to stocks. The 10-year yield is around 5.3%, while the 30-year approaches 5.7%, as inflation concerns and heavy borrowing keep pressure on bond markets.
🟦 The Fed is signaling more tightening ahead. Minutes from September's meeting show most policymakers expect another rate hike this year, although markets see only about a 19% chance of a move in October.
🟨 AI's financing boom is raising new questions. SpaceX, Broadcom and Oracle are seeking billions in debt to fund AI infrastructure, supporting chip demand but raising concerns about borrowing costs, credit risks and competition for capital.
🗓️ Key Economic Events
On today's U.S. data calendar.
🟧 8:30 a.m. ET — Initial Jobless Claims
Forecast: 200K | Previous: 197K
Claims are expected to edge higher but remain historically low, providing another indication of labor-market conditions following September's weak jobs report.
🟧 1:00 p.m. ET — 30-Year Treasury Bond Auction
With long-term yields near multidecade highs, the auction will test investor appetite for U.S. government debt and could influence borrowing costs.
Letters to the editor email: editor-tippinsights@technometrica.com
Subscribe Today And Make A Difference. Consider supporting Independent Journalism by upgrading to a paid subscription or making a donation. Your support helps tippinsights thrive as a reader-supported publication. Contact us to discuss your research or polling needs.
Reach our audience. For sponsorship and advertising opportunities, visit our Partner With Us page.