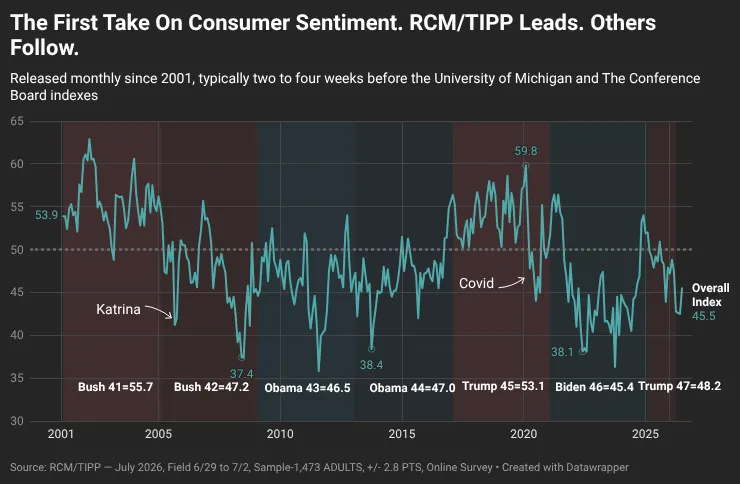

Consumer sentiment improved in September. The RealClearMarkets/TIPP Economic Optimism Index, the first monthly read on U.S. consumer confidence, rose to 45.6 from 45.1 in August, a gain of 0.5 points, or 1.1%. It is the index’s highest reading since March. The past five months read 42.6, 42.5, 45.5, 45.1, and 45.6.
Even so, the index has now spent thirteen consecutive months below the neutral 50 mark, keeping the nation in what we classify as the pessimism zone. The last reading at or above 50 was August 2025, at 50.9.
September’s 45.6 is 6.9% below the 308-month historical average of 49.0. Of the 308 monthly readings since the index began in February 2001, 217 have been higher and 87 lower. The 45.6 mark itself has been matched exactly three times before, in August 2006, August 2012, and July 2014.
The RCM/TIPP Economic Optimism Index has a strong track record of anticipating the consumer-confidence indicators later released by the University of Michigan and The Conference Board. From February 2001 to October 2023, TIPP released this index monthly in collaboration with its former sponsor and media partner, Investor’s Business Daily.
RCM/TIPP surveyed 1,481 adults for the September index from August 25 to August 28, using TIPP’s panel network; the margin of error is ±2.9 percentage points. Results range from 0 to 100, with readings above 50 indicating optimism, below 50 signaling pessimism, and 50 neutral.
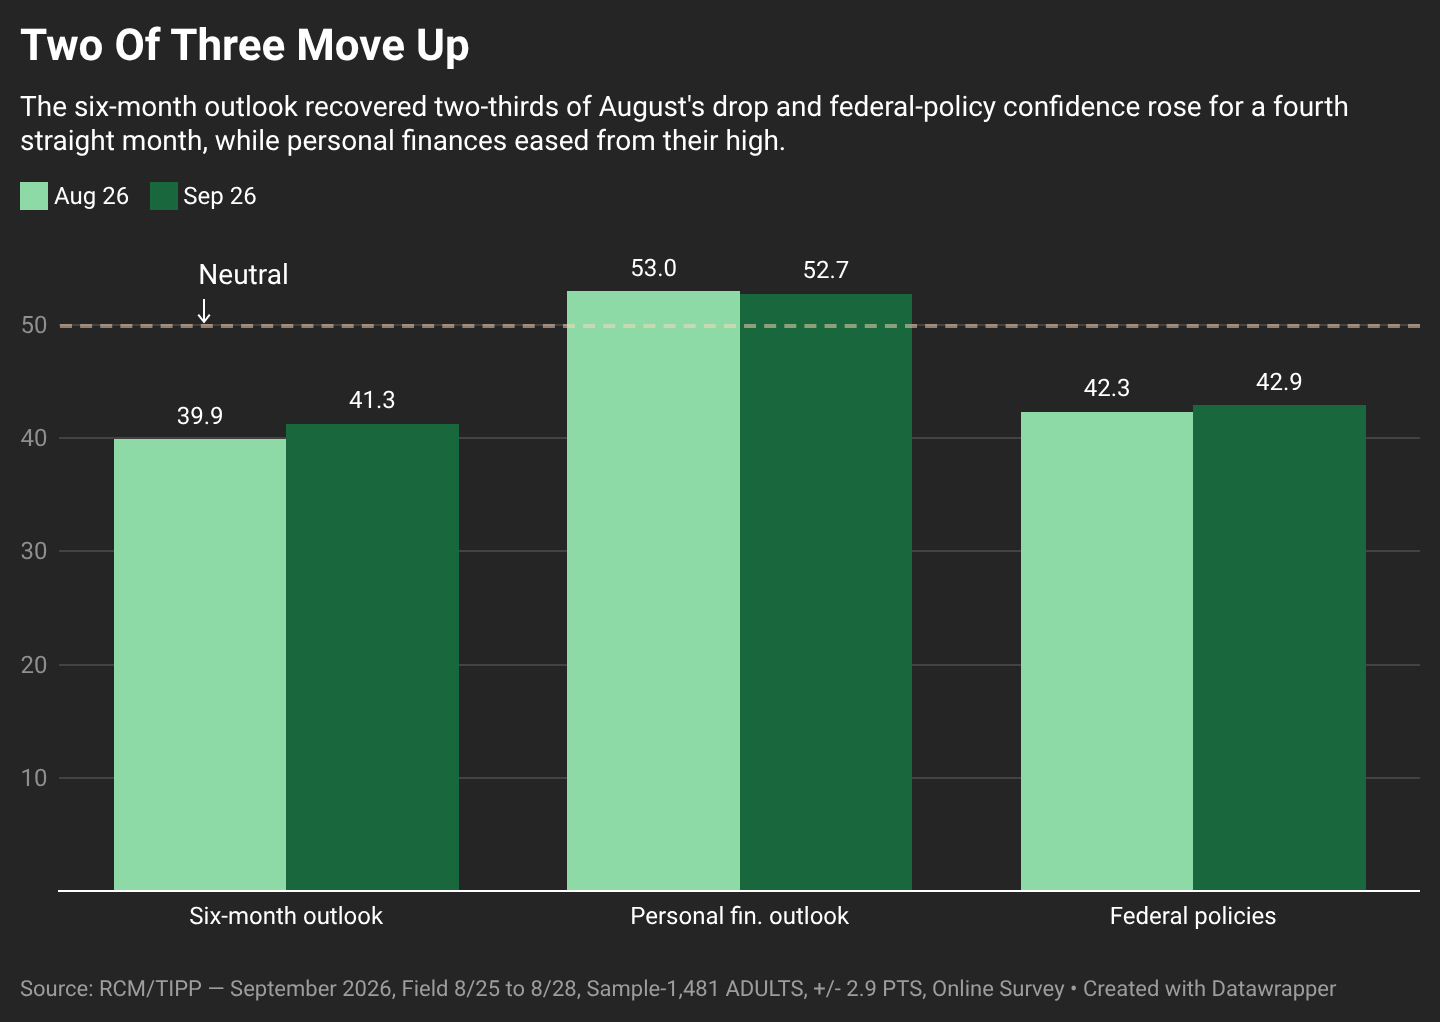
The RCM/TIPP Economic Optimism Index has three key components. In September, two of the three rose and one fell. August had the same split, but different components were involved. This time the six-month outlook and federal-policy confidence climbed, while personal finances eased.
- The Six-Month Economic Outlook, which measures how consumers perceive the economy’s prospects over the next six months, rose 3.5%, from 39.9 in August to 41.3 in September, recovering 1.4 of the 2.2 points it had surrendered the month before.
- The Personal Financial Outlook, a measure of how Americans feel about their own finances over the next six months, declined 0.6%, from 53.0 to 52.7, easing off August’s high but holding above the neutral 50 line for a 27th consecutive month.
- Confidence in Federal Economic Policies, a proprietary RCM/TIPP measure of views on the effectiveness of government economic policies, rose 1.4%, from 42.3 to 42.9, a fourth consecutive monthly gain and its highest reading since March.
Party Dynamics
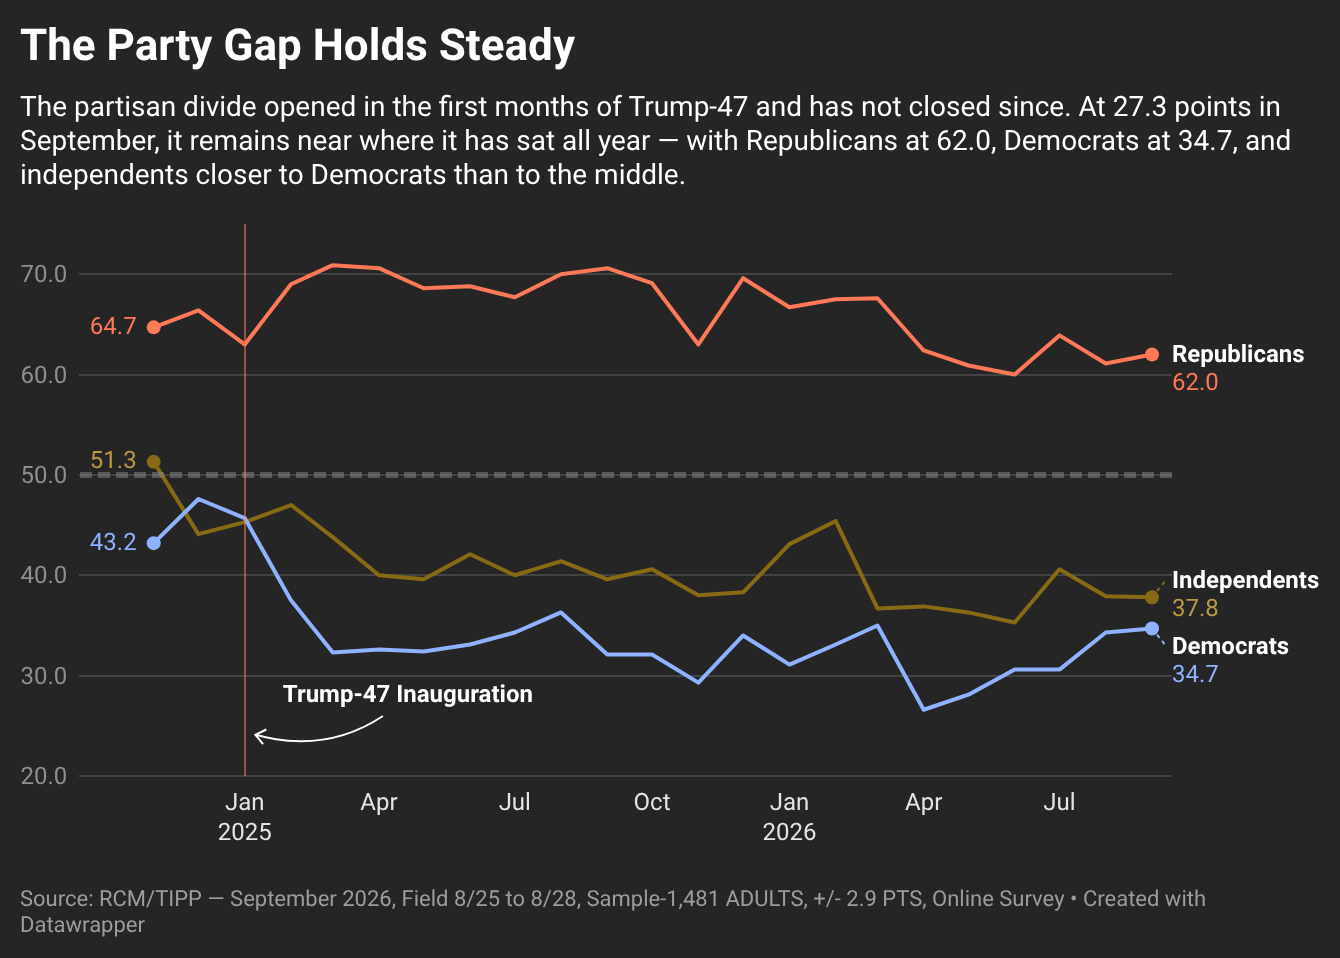
Democrats rose 0.4 points to 34.7, Republicans rose 0.9 to 62.0, and independents were flat at 37.8, down 0.1. The Democrat-Republican gap widened from 26.8 points in August to 27.3.
The gap widened, closed, and widened again over the previous three months, each turn driven by a different group. In September, all three groups moved less than a point. The divide that opened in the first months of Trump-47 has not closed since, and this month it held where it was. Independents at 37.8 sit 3.1 points from Democrats and 24.2 points from Republicans. They remain closer to the most pessimistic group we track than to the middle.
Investor Confidence
Respondents are counted as “investors” if they hold at least $10,000 in the stock market, personally or jointly, directly or through a retirement plan. They are typically the most confident segment we track.
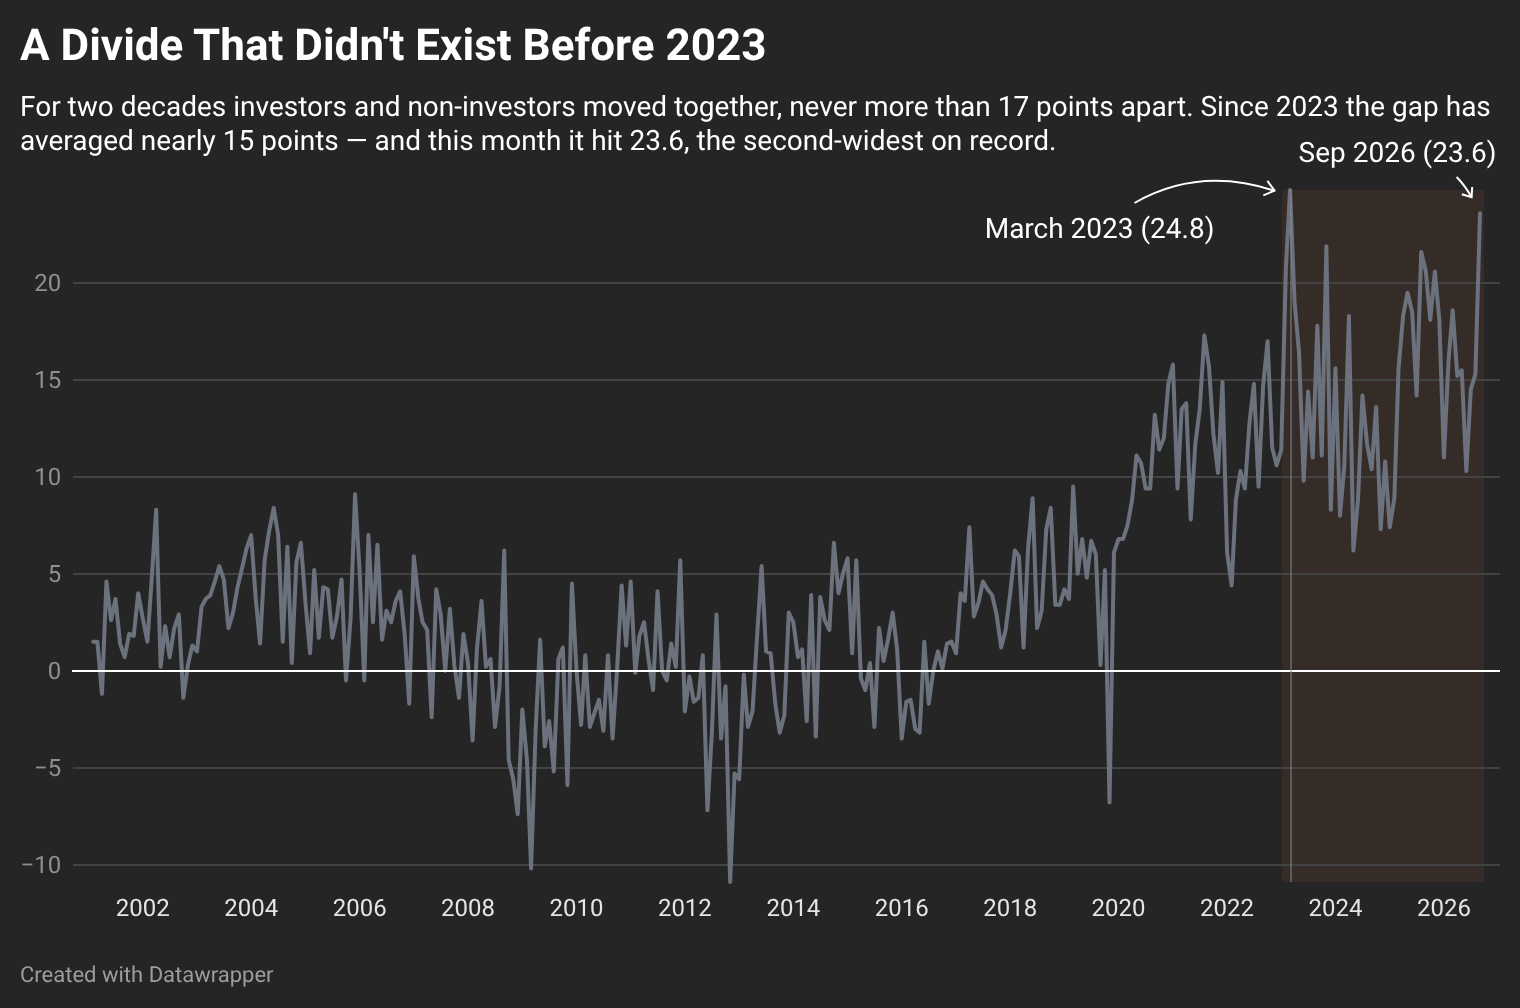
In September investors pulled away with their confidence gaining 5.8 points to 61.5, its highest reading since September 2025 and a third consecutive month above the neutral line. Non-investor confidence went the other way, falling 2.5 points to 37.9. The gap between the two widened from 15.3 points to 23.6.
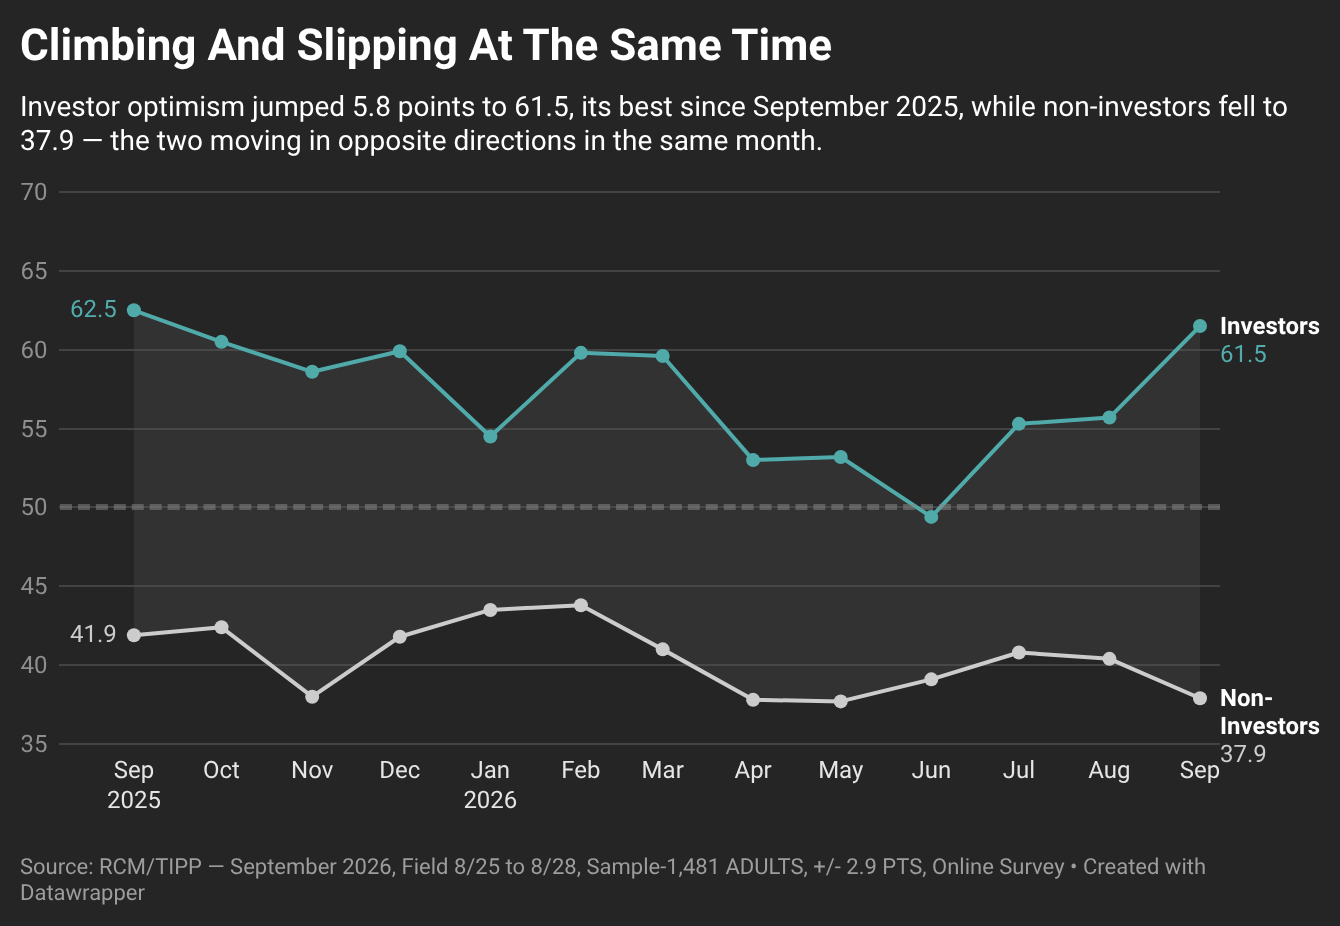
That 23.6-point spread is the second-widest in the history of the index, behind only March 2023 at 24.8. It is also part of a newer pattern: from February 2001 through the end of 2022, the gap between investors and non-investors averaged 3.0 points and never once exceeded 17.3. It ran negative in stretches of 2009 and 2012, when non-investors were the more optimistic group. Since January 2023, it has averaged 14.7 points, and over the last 12 months, 16.4 points.
All ten of the widest readings on record have come since February 2023. For the first twenty-two years of the index, investors and non-investors reported broadly similar levels of confidence. They no longer do.
Momentum
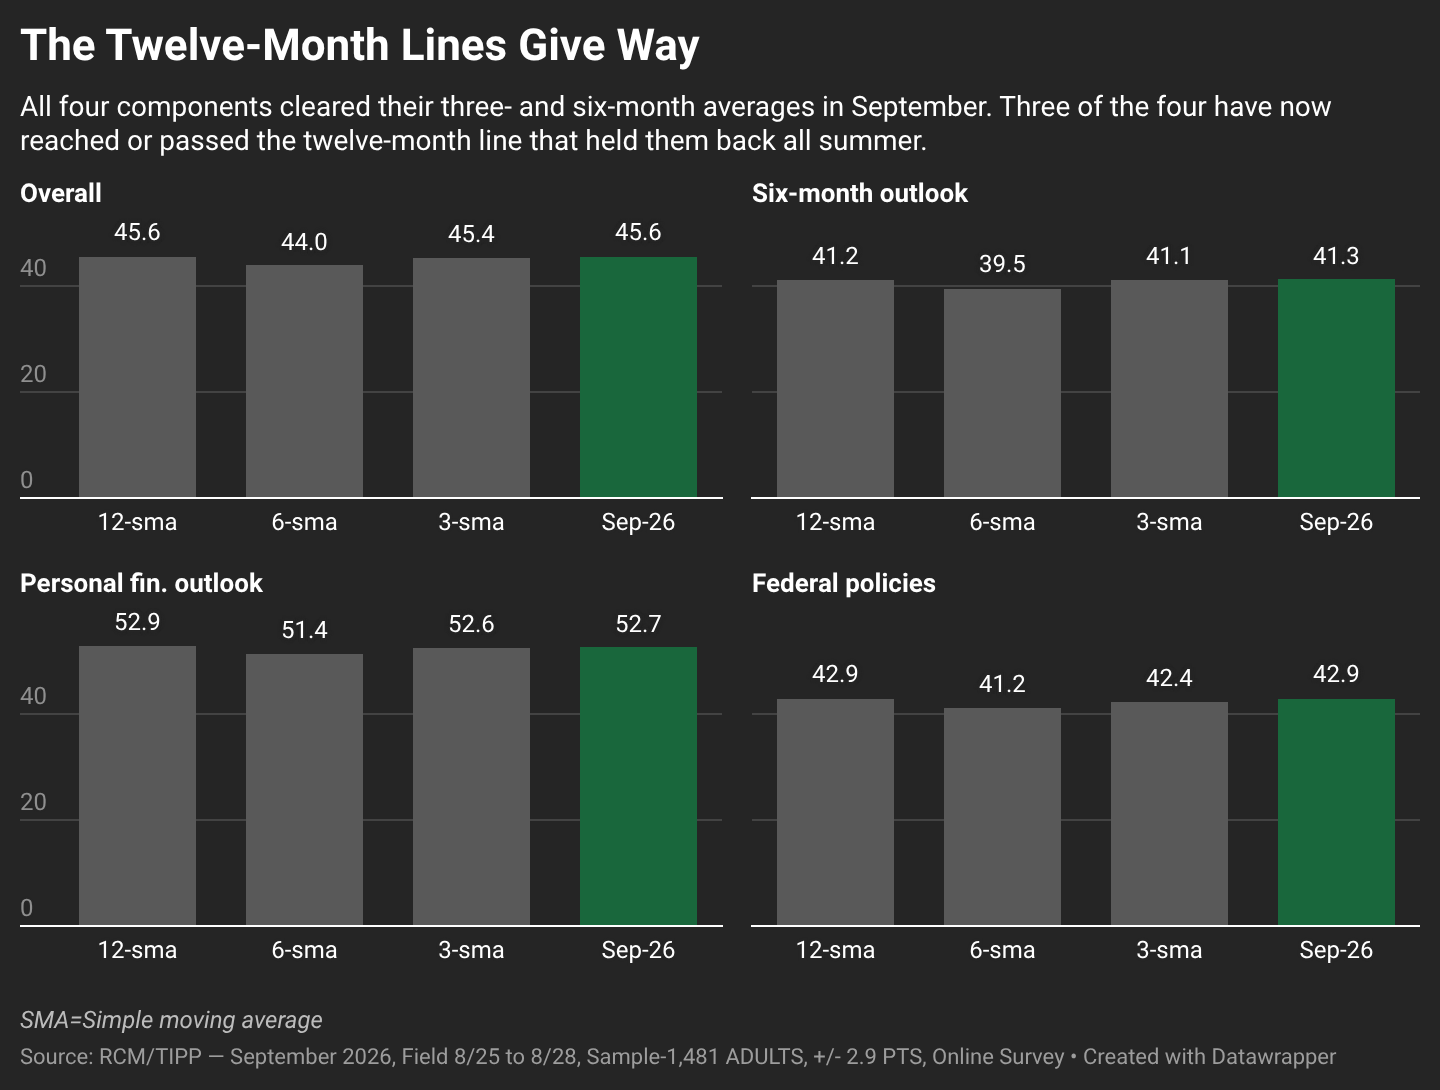
The Optimism Index at 45.6 sits above its three-month (45.4) and six-month (44.0) averages and matches its twelve-month (45.6). The Six-Month Outlook at 41.3 clears all three of its benchmarks, which stand at 41.1, 39.5, and 41.2. Personal Financial Outlook at 52.7 tops its three- and six-month averages of 52.6 and 51.4 but trails its twelve-month of 52.9. Confidence in Federal Policies at 42.9 exceeds its three- and six-month figures of 42.4 and 41.2 and matches its twelve-month exactly.
On eleven of twelve component-to-average comparisons, September reads at or above its trailing baseline, up from nine in August and eight in July. The twelve-month lines were the holdout through the summer. Three of the four have now been reached or cleared.
Demographic Analysis
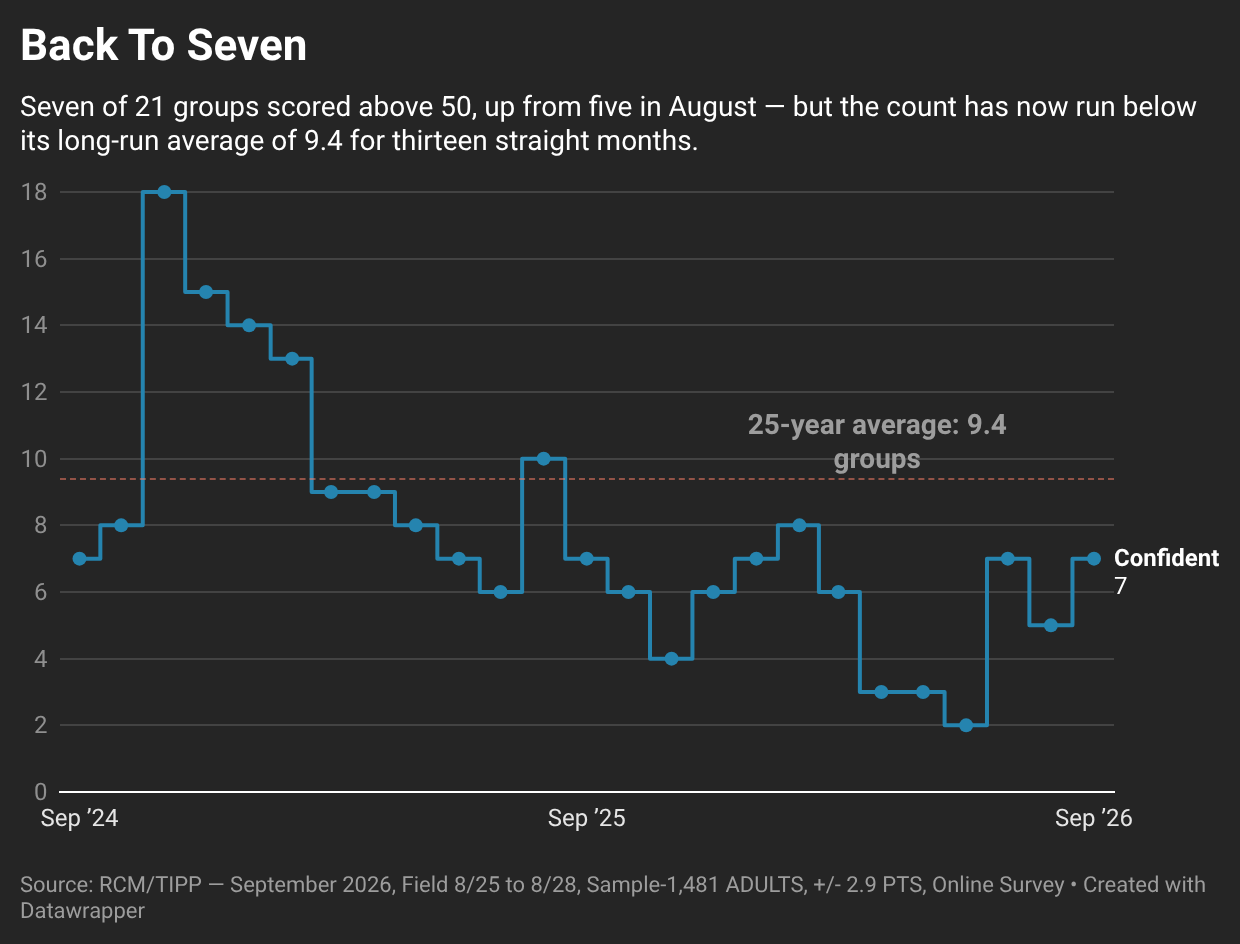
The number of groups in positive territory measures the breadth of optimism across American society. This month, seven of the 21 demographic groups RCM/TIPP tracks scored above 50 on the Economic Optimism Index, up from five in August and matching July’s high. The seven: adults aged 25-44, men, households earning $75,000 or more, Republicans, investors, the West, and Black and Hispanic respondents. The last two are new to the list, and no group dropped off it. Thirteen groups improved month over month, up from eight in August.
Even so, the count has now run below its long-run average of 9.4 groups for thirteen straight months, the same thirteen the headline index has spent below 50. Both measures turned in August 2025 and neither has recovered.
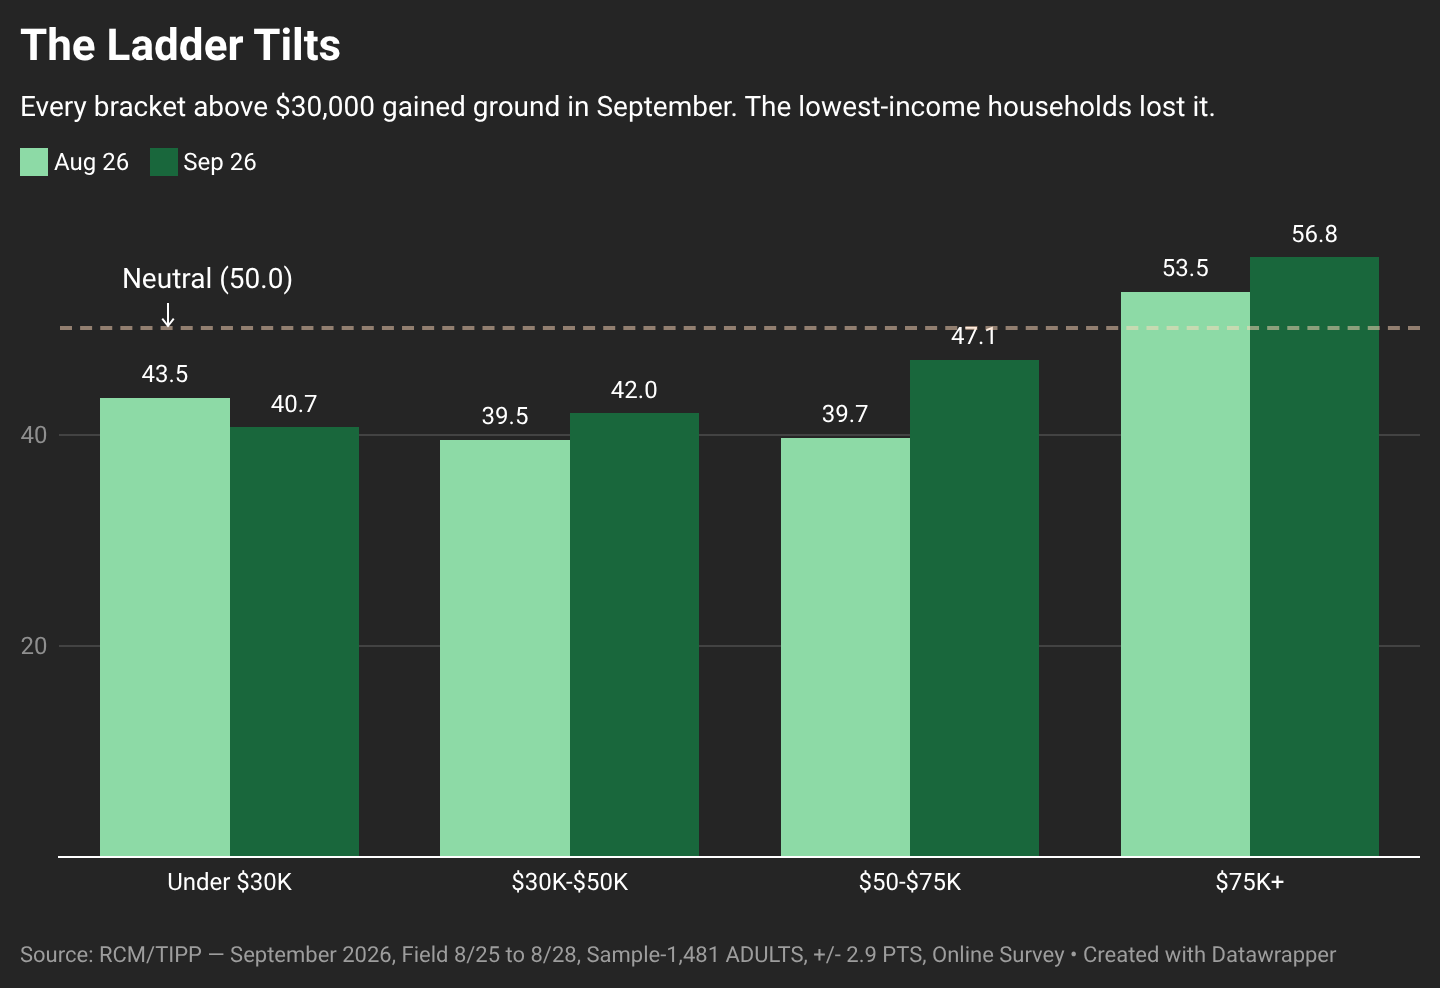
The month’s movement followed the income ladder closely. Households earning $50,000-75,000 rose 7.4 points, the largest gain of any group, to 47.1. Those earning $75,000 or more rose 3.3 to 56.8, and the $30,000-50,000 bracket rose 2.5 to 42.0. Households earning under $30,000 fell 2.8 points to 40.7, the only bracket to decline. Investors gained 5.8 points and non-investors lost 2.5.
Other gains were regional and generational. The West rose 4.8 points to 51.1, crossing into optimistic territory, the Northeast rose 4.0, and adults aged 18-24 recovered 3.7 of the 7.9 points they gave up in August. The declines were narrow. The Midwest fell 3.1, adults aged 45-64 fell 2.3, and the South fell 1.5. September’s improvement was real but not broad. It went to households in the upper half of the income distribution and to people who own assets.
Financial Stress
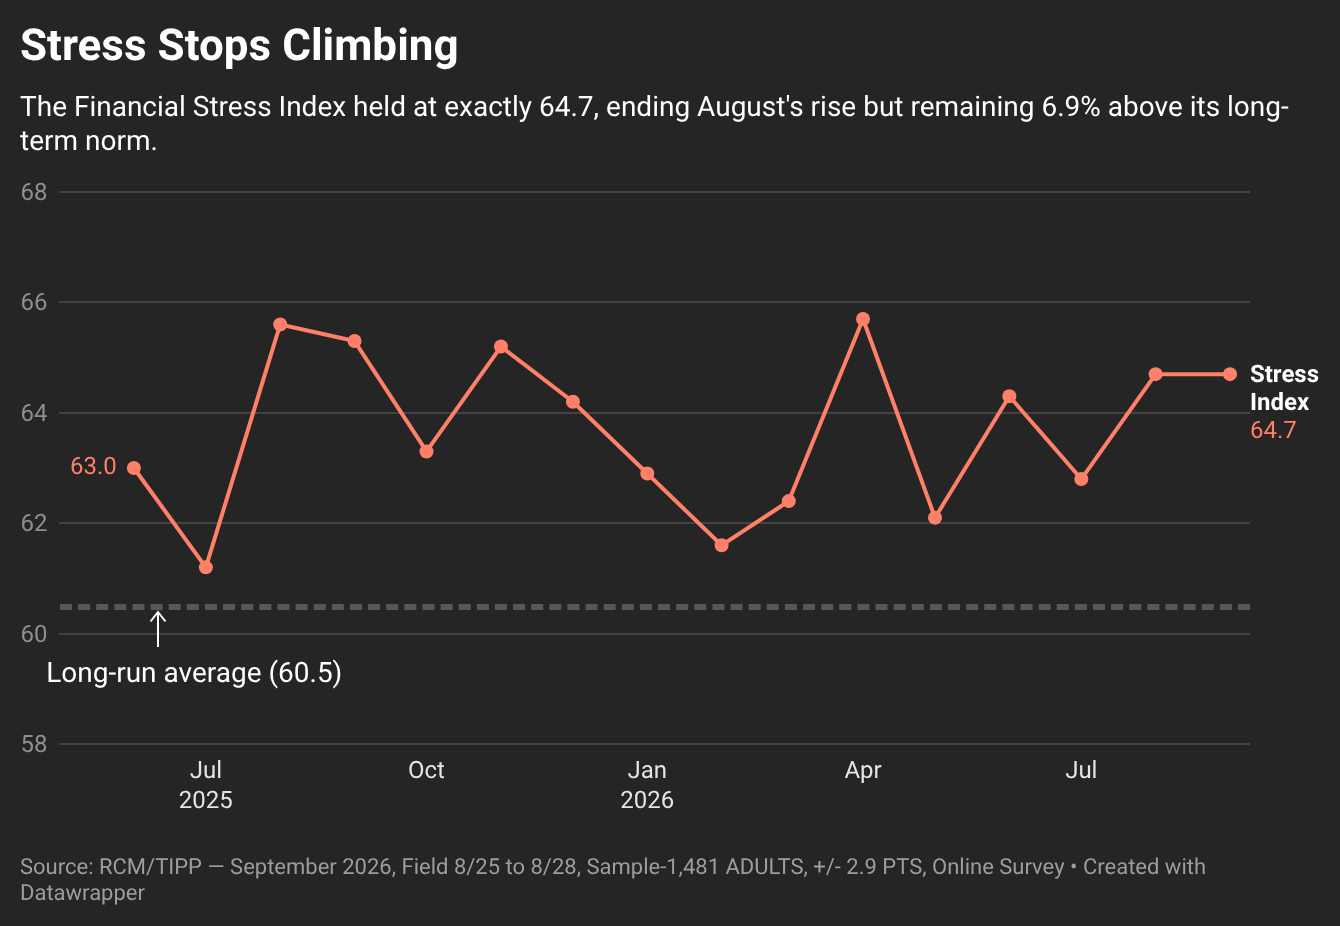
RCM/TIPP also releases a companion measure, the RCM/TIPP Financial-Related Stress Index, the only monthly metric tracking the financial stress Americans feel. The gauge runs opposite to the optimism index: the higher the number, the more stress, with readings above 50 signaling elevated strain and 50 neutral.
The Stress Index was unchanged in September, holding at 64.7 and ending August’s 1.9-point climb. It has averaged 60.5 since December 2007, and September’s reading sits 6.9% above that long-term norm. The last time the index fell below 50 was February 2020, just before the pandemic, at 48.1.
The flat headline conceals movement underneath. Twelve of the 21 groups we track reported less stress in September and nine reported more, close to an even split that netted to nothing. The largest declines came from adults 65 and older, down 3.8 points, Black and Hispanic respondents, down 3.5, and Democrats, down 3.2. The largest increase came from the youngest cohort. Adults aged 18-24 saw stress jump 8.8 points to 69.7, the highest of any group, while their optimism rose 3.7 points in the same month. The 18-24 volatility we have flagged since May has not settled.
Stress And Optimism, Side By Side
The two gauges converged slightly. Optimism rose 0.5 and stress held flat, narrowing the distance between them from 19.6 points to 19.1, still wider than July’s 17.3.
The larger movement this month was within the indexes rather than between them. Both headline numbers were produced by groups moving hard in opposite directions and cancelling out. Investors and higher-income households reported a better September. Non-investors and households earning under $30,000 reported a worse one. The headline falls between the two and describes neither well.
Whether that gap narrows or holds is the question October will answer.
RealClearMarkets will release the next report at 10 a.m. EST on Tuesday, October 6, 2026.
Loved it, hated it, or somewhere in between — tell us. Grade this article here and help shape what lands in your inbox next.
🧭 Power & Capital · September 3, 2026
Where state power meets the boardroom.
🔷 Canada Is Picking The Wrong Fight With Trump – Victor Davis Hanson, The Daily Signal
🌍 Global Affairs
The world's flashpoints, in motion.
🟥 Bahri Says Two Crew Members Killed In Strait Of Hormuz Incident – TIPP News
🟥 China Seeks Answers After Man Dies Shortly After Entering ICE Custody – TIPP News
🏛️ National Affairs
The fights shaping America right now.
🟫 The WNBA Became A DEI Circus—Now Caitlin Clark Could Pull The Plug – Victor Davis Hanson, The Daily Signal
🟫 Utah Judge Finds Probable Cause In Charlie Kirk Murder Case – TIPP News
🟫 Two Killed, Several Injured In Shooting At Minneapolis Apartment Complex – TIPP News
🟫 ‘The Supreme Court Failed’: Roy’s Birthright Citizenship Hearing Will Scrutinize SCOTUS Ruling – Pedro Rodriguez, The Daily Signal
🟫 192 Democrats Vote Against Resolution Condemning Socialism, Supporting Constitution And Secure Elections – Virginia Grace McKinnon, The Daily Signal
🟫 House Weighs Senate Funding Bill That Would Delay New White House - Funding Rules To Combat ‘Wasteful Spending’ – Tyler O’Neil, The Daily Signal
🟫 Even After Affirmative Action’s Fall, DEI Thrives At Elite Law Schools – Jarrett Stepman, The Daily Signal
🟫 Ken Paxton Launches College Student Initiative Ahead Of Texas Senate Race – Emily Medeiros, The Daily Signal
🟫 Latino Merchants Are Fighting Against An Atheist’s Lawsuit To Remove Century-Old Cross In Historic Los Angeles – Angelina Delfin, The Daily Signal
🟫 Republicans Can’t Afford To Waste September – Daniel West & Chip Wyatt, The Daily Signal
🟫 The Check Is (Lost) In The Mail – Rich Tucker, The Daily Signal
🟫 Woodrow Wilson’s Vision Of ‘Progress’ Was At Odds With Human Nature – Gillian Richards, The Daily Signal
🟫 Resistance Becomes Revolution: North Carolina, 1776 – Jim Sanderlin, The Daily Signal
🟫 Lake Tahoe Swimmer Injured In Rare Otter Attack – TIPP News
🟫 Shedd Aquarium Reports Deaths Of Two More Beluga Whales – TIPP News
📈 Economy
Prices, policy, and the pressure on your wallet.
🟩 Employer Health Benefit Costs Expected To Rise Sharply In 2027 – TIPP News
🟩 US Factory Orders Rise More Than Expected In July – TIPP News
📊 Market Mood · September 3, 2026
How the trading day is setting up.
🟩 Stocks and bonds are finding some relief this morning. Global equities are higher and the 10-year Treasury yield has eased to around 4.77% after this week’s sharp bond selloff, although markets still price roughly a 60% chance of a Fed rate hike this month.
🟦 The yen is surging again, extending its two-day gain to nearly 2%, its strongest move since the U.S.-Japan intervention in early August. The move is adding to expectations that the Bank of Japan could tighten policy this month.
🟧 Oil remains the inflation wild card. Crude has edged lower this morning but remains around $95 as uncertainty continues over renewed U.S.-Iran fighting, keeping energy-driven inflation risks firmly in the picture.
🟨 Today's services and labor data set the stage for Friday's jobs report. ISM Services and jobless claims could move Fed expectations, but tomorrow's payrolls report remains the week's decisive economic test.
🗓️ Key Economic Events
On today's U.S. data calendar.
🟧 8:30 a.m. ET — Initial Jobless Claims
Forecast: 205K | Previous: 203K
Claims remain historically low, so any meaningful increase would strengthen the case that the labor market is beginning to soften.
🟧 10:00 a.m. ET — ISM Services PMI (August)
Forecast: 53.8 | Previous: 54.1
Services dominate the U.S. economy, making this today's most important activity reading, with particular attention on employment and prices paid.
🟧 8:30 a.m. ET — U.S. Trade Balance (July)
The trade report provides an early read on third-quarter growth, although markets are likely to give greater weight to jobless claims and ISM Services today.
Letters to the editor email: editor-tippinsights@technometrica.com
Subscribe Today And Make A Difference. Consider supporting Independent Journalism by upgrading to a paid subscription or making a donation. Your support helps tippinsights thrive as a reader-supported publication. Contact us to discuss your research or polling needs.
Reach our audience. For sponsorship and advertising opportunities, visit our Partner With Us page.