
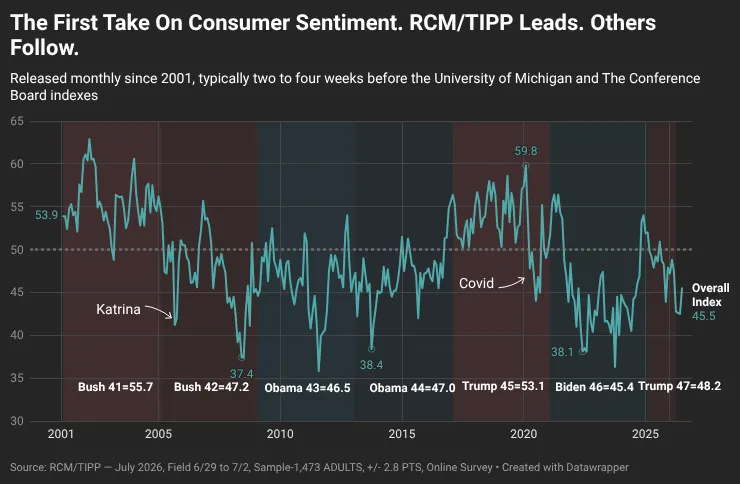
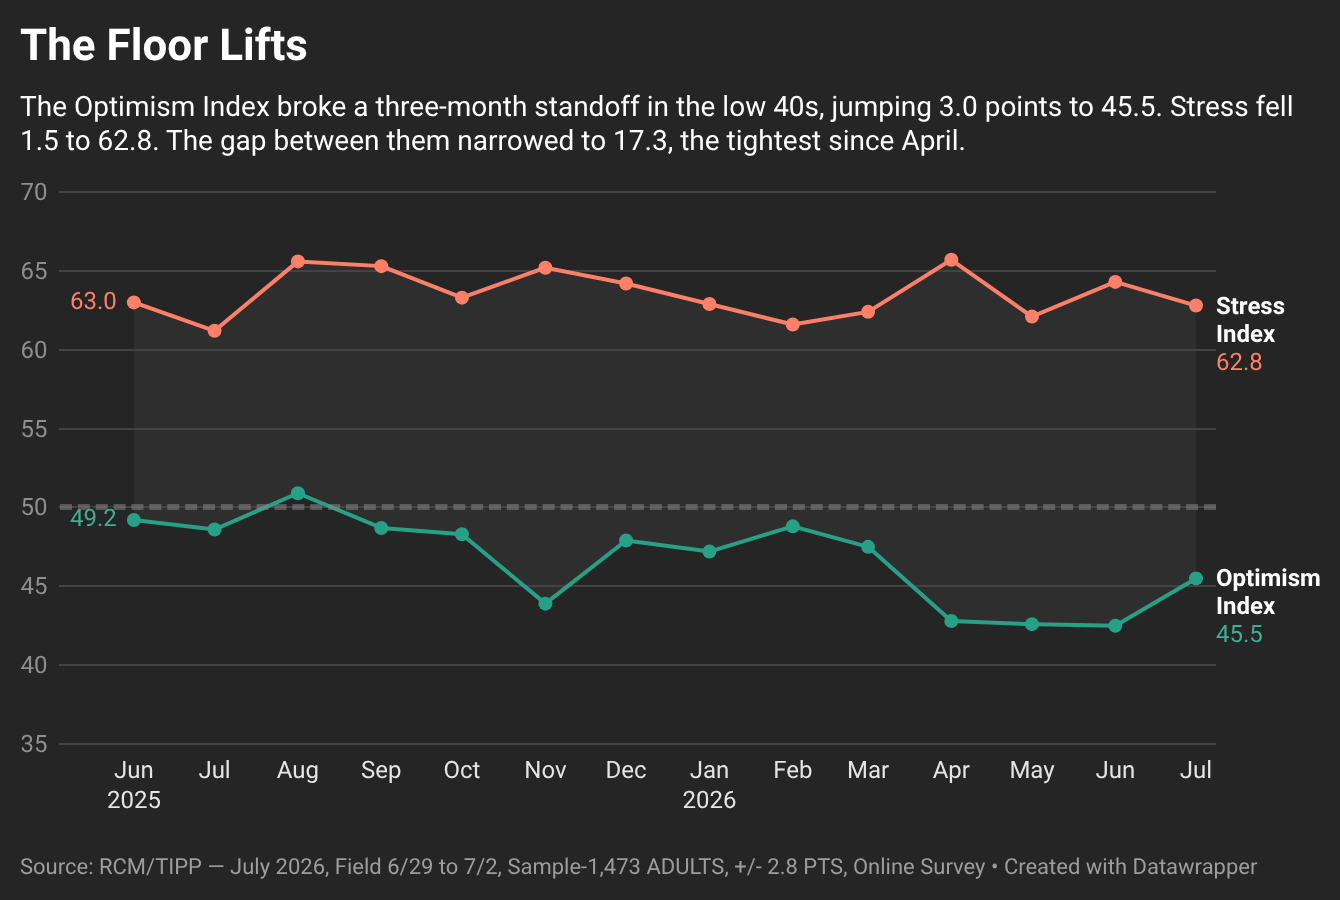
Consumer sentiment jumped in July. The RealClearMarkets/TIPP Economic Optimism Index, the first monthly read on U.S. consumer confidence, climbed to 45.5 from 42.5 in June, a gain of 3.0 points, or 7.1%. It is the largest monthly move for the headline since November 2024, and it broke a three-month stretch of readings parked in the low 40s: 42.8, 42.6, 42.5, and now 45.5.
Even after the jump, the index has now spent eleven consecutive months below the neutral 50 mark, keeping the nation in what we classify as the pessimism zone. The last reading at or above 50 was August 2025, at 50.9.
July's 45.5 is 7.3% below the 306-month historical average of 49.1. Of the 306 monthly readings since the index began in February 2001, 220 have been higher and 85 have been lower. July shares its 45.5 reading with four other months in the historical record: April 2007, November 2015, July 2016, and April 2022.
The RCM/TIPP Economic Optimism Index has a strong track record of anticipating the consumer-confidence indicators later released by the University of Michigan and The Conference Board. From February 2001 to October 2023, TIPP released this index monthly in collaboration with its former sponsor and media partner, Investor’s Business Daily.
RCM/TIPP surveyed 1,473 adults for the July index from June 29 to July 2, using TIPP’s panel network; the margin of error is ±2.8 percentage points. Results range from 0 to 100, with readings above 50 indicating optimism, below 50 signaling pessimism, and 50 neutral.
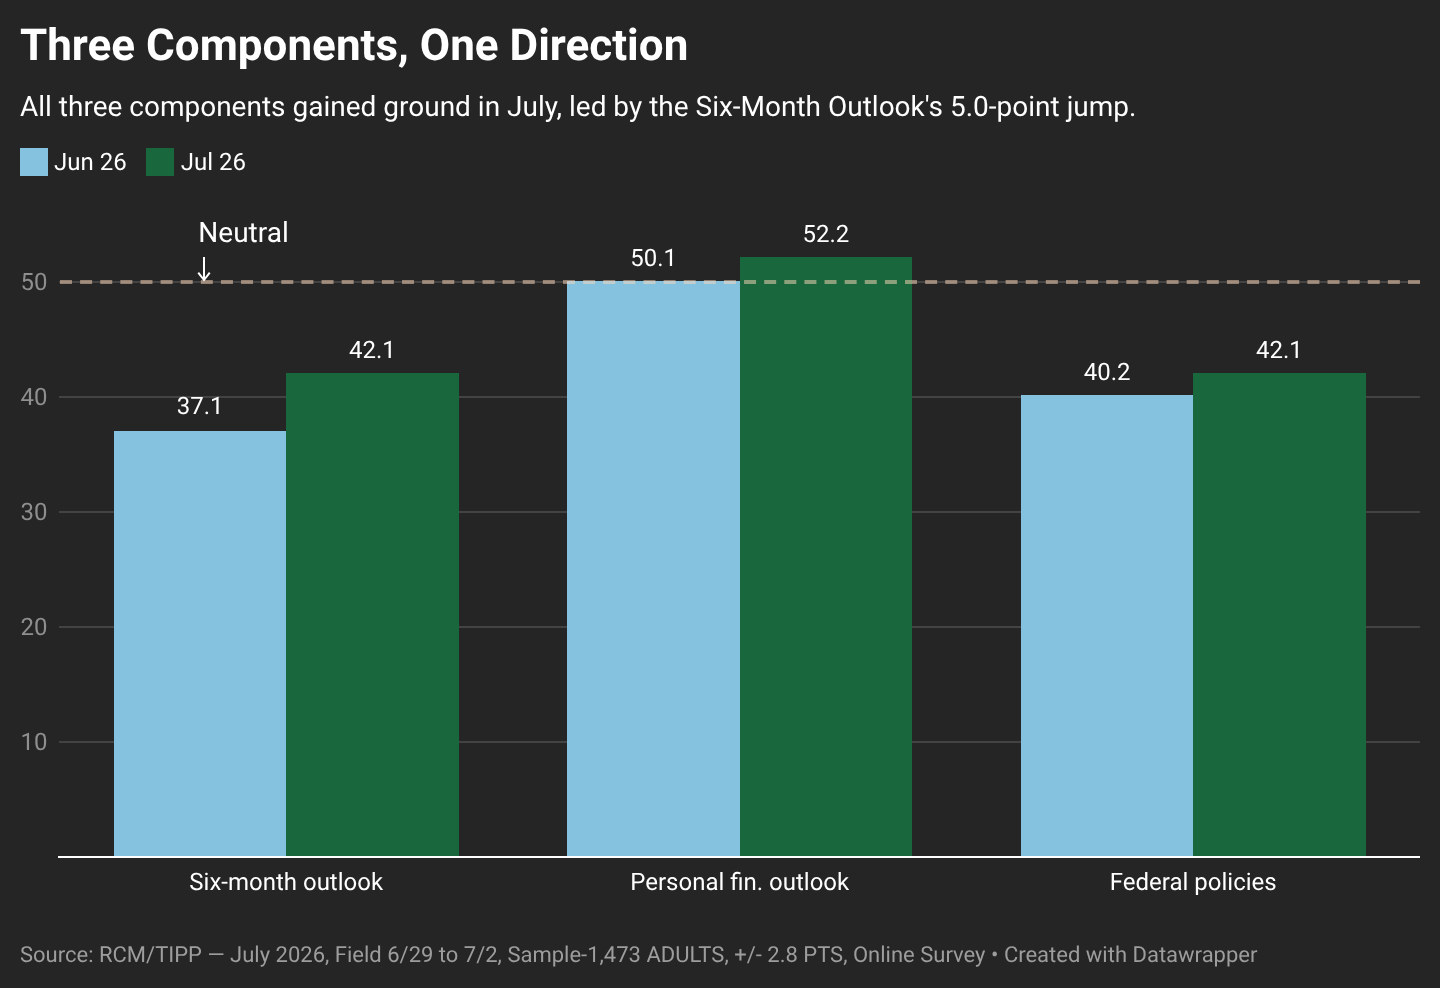
The RCM/TIPP Economic Optimism Index has three key components. In July all three rose together for the first time in the current cycle, with the Six-Month Outlook doing most of the lifting.
- The Six-Month Economic Outlook, which measures how consumers perceive the economy’s prospects over the next six months, climbed 13.5%, from 37.1 in June to 42.1 in July, its highest reading in seven months. Every one of the 21 demographic groups we track improved on this component.
- The Personal Financial Outlook, a measure of how Americans feel about their own finances over the next six months, rose 4.2%, from 50.1 to 52.2, its firmest reading above the neutral 50 line in five months.
- Confidence in Federal Economic Policies, a proprietary RCM/TIPP measure of views on the effectiveness of government economic policies, rose 4.7%, from 40.2 to 42.1, its second consecutive monthly gain.
Party Dynamics
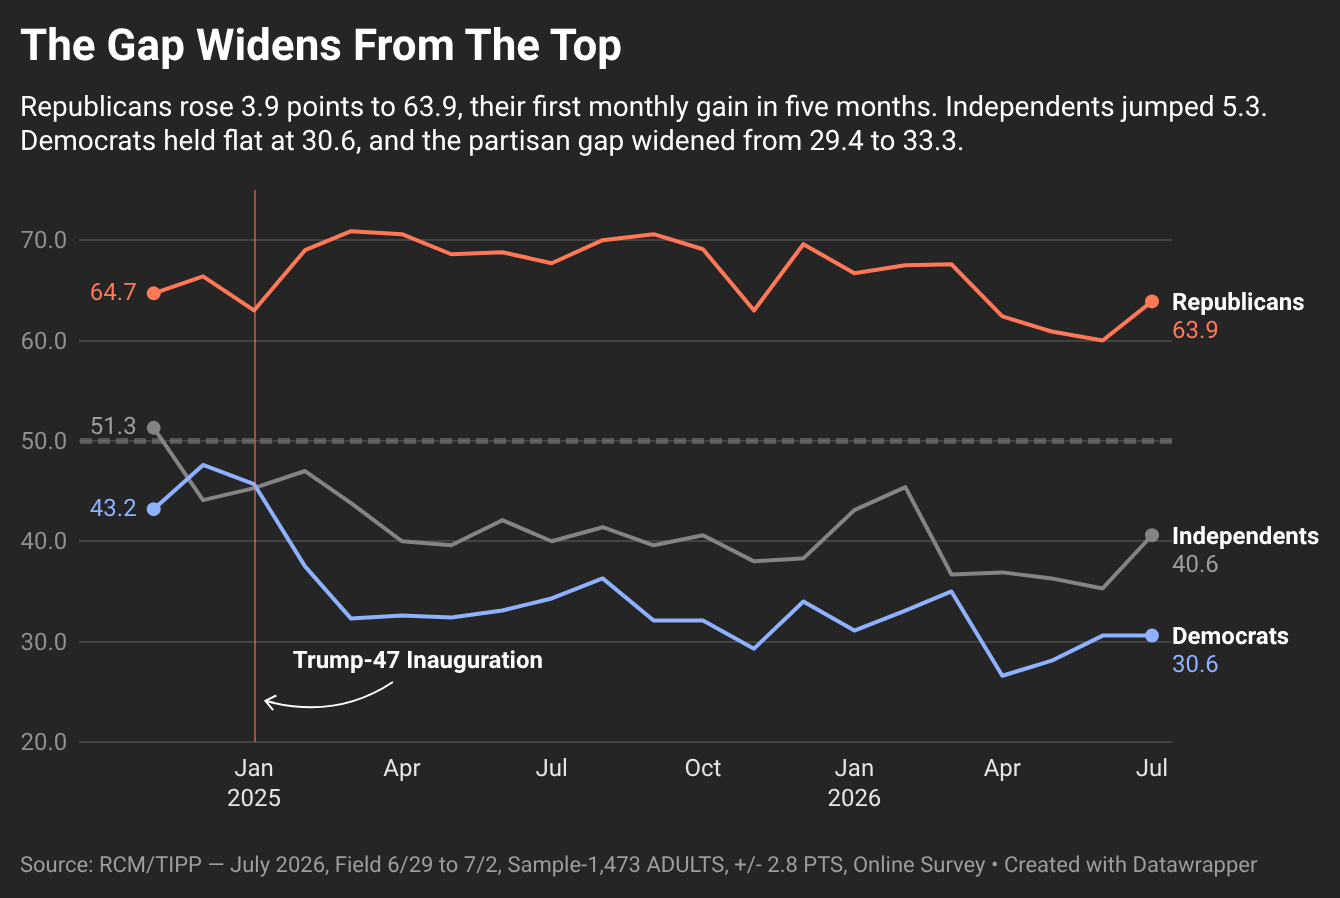
Republicans rose 3.9 points to 63.9, their first monthly gain in four months and their highest reading since March. Independents jumped 5.3 points to 40.6. Democrats held flat at 30.6, unchanged from June, and remain deeply pessimistic. The Democrat-Republican gap widened from 29.4 points in June to 33.3 in July.
Where June’s narrowing gap reflected Republican fatigue against a small Democratic gain, July’s widening reflects Republican recovery and Democratic stasis. The rebound has Republican and independent participants; it does not yet have Democratic ones.
Investor Confidence
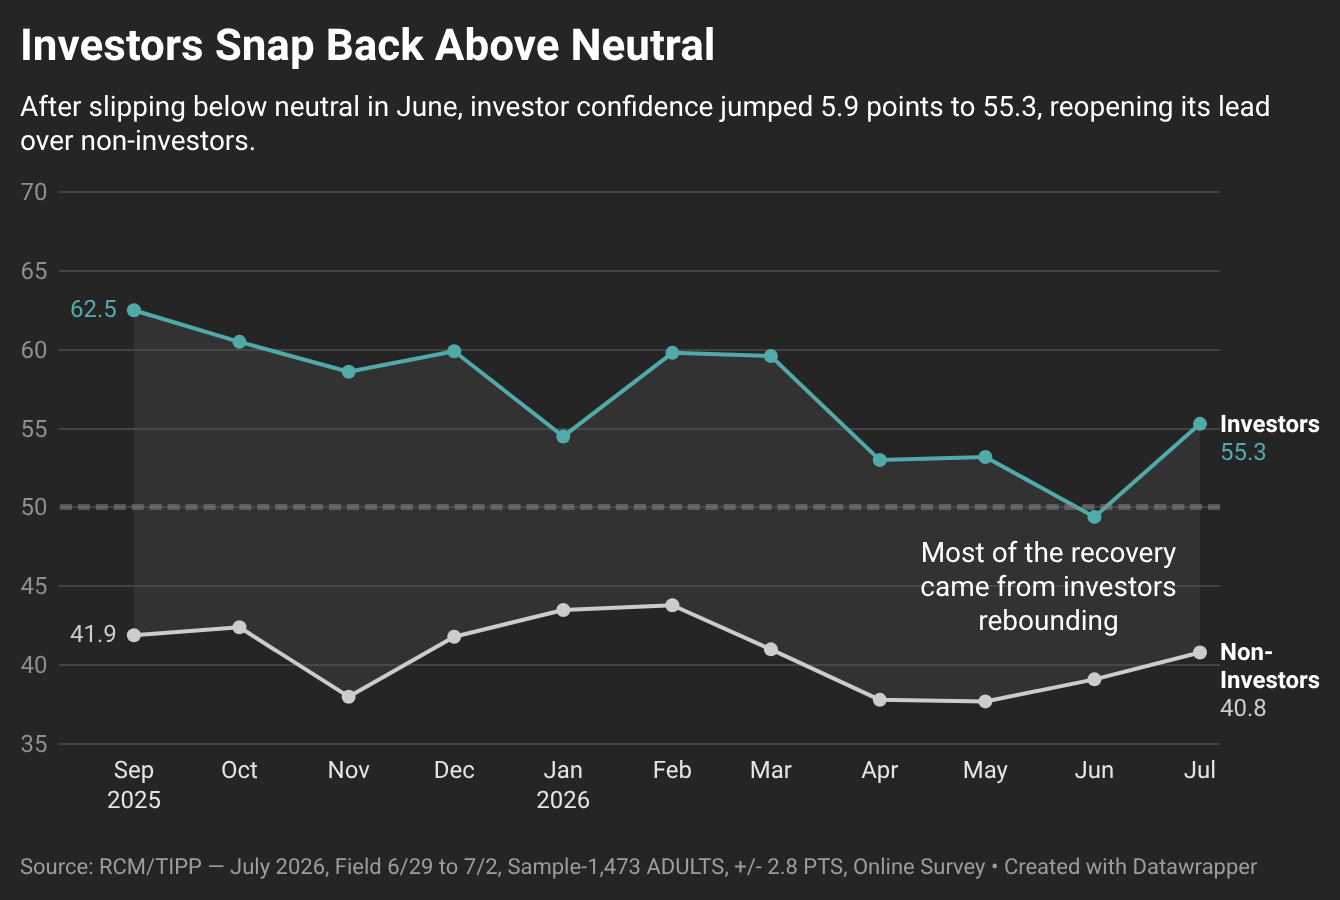
Respondents are counted as “investors” if they hold at least $10,000 in the stock market, personally or jointly, directly or through a retirement plan. They are typically the most confident segment we track. In June, that confidence had slipped into pessimism for the first time in two years.
In July, it snapped back. Investor confidence rose 5.9 points to 55.3, recovering above the neutral line and posting the sharpest monthly move for this segment since August 2025. Non-investor confidence also rose, to 40.8 from 39.1, but the more modest 1.7-point move was overshadowed. The gap between the two widened from 10.3 points in June to 14.5 in July.
The recovery shows up across investors’ own readings: their six-month outlook rose 7.9 points, their personal-finances reading rose 4.6, and their confidence in federal policies rose 2.9. Where June’s decline showed weakness at the top and modest gains beneath, July’s recovery shows strength at the top and modest gains beneath. The direction reversed cleanly; the pattern of who moves most did not.
Momentum
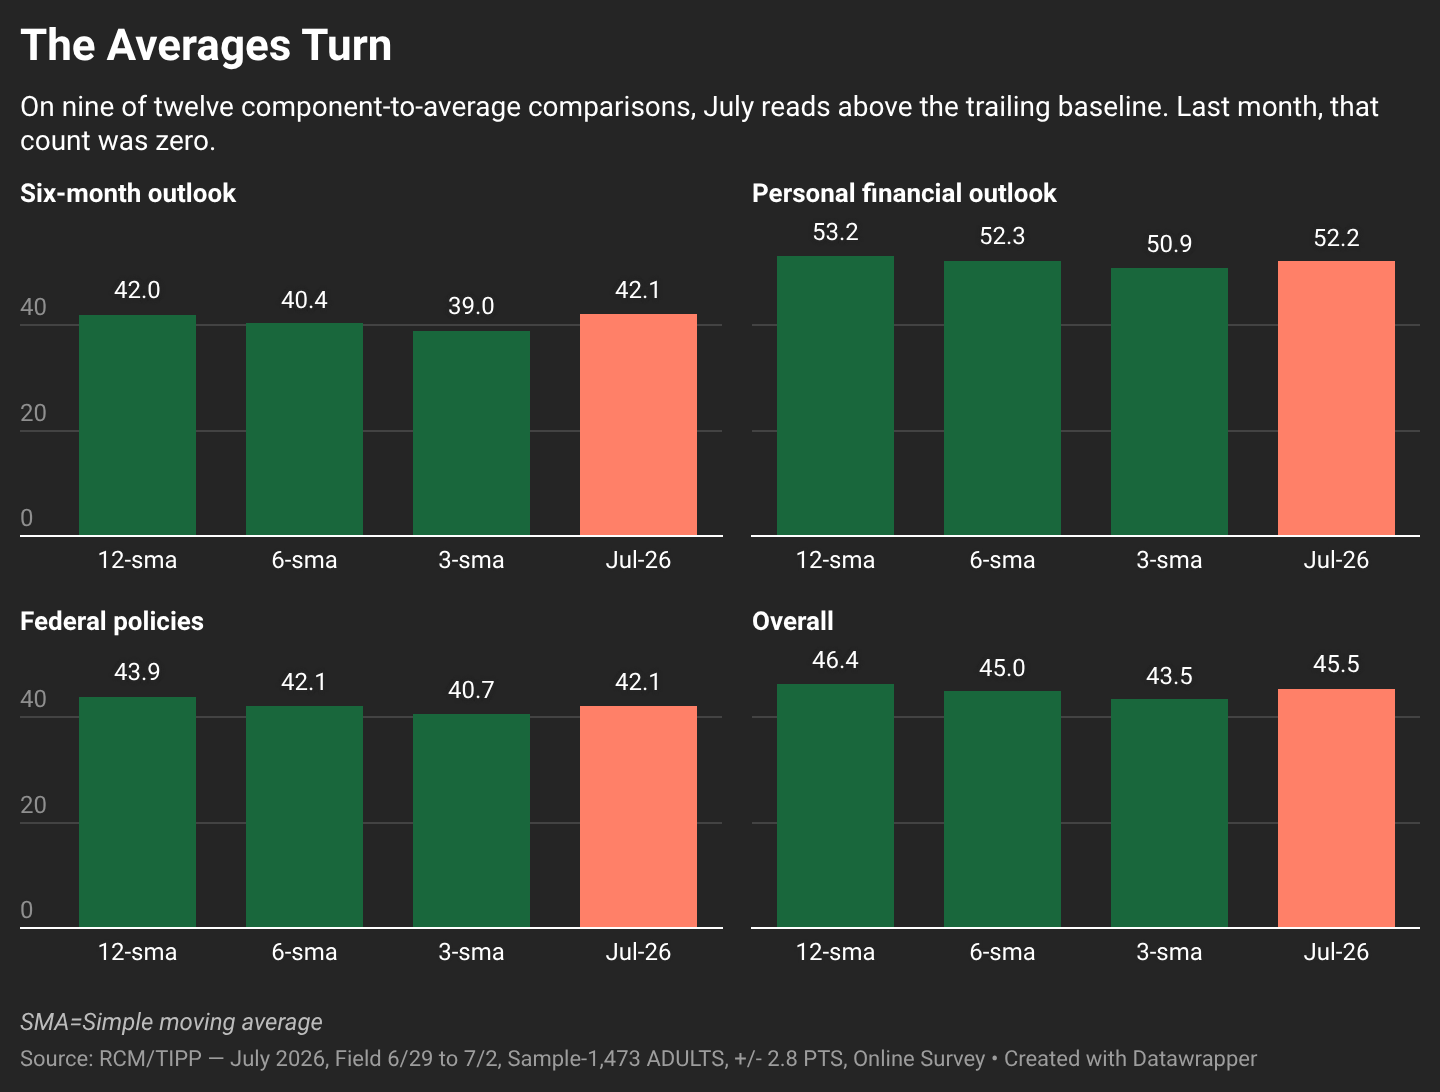
The Optimism Index at 45.5 now sits above its three-month (43.5) and six-month (45.0) averages, and below its twelve-month average (46.4). The Six-Month Outlook at 42.1 sits just above all three of its trailing averages (39.0, 40.4, and 42.0). Personal Financial Outlook at 52.2 is above its three-month benchmark of 50.9 and remains below its six- and twelve-month averages, reflecting the strength of the same measure earlier in the cycle. Confidence in Federal Policies at 42.1 is above its three-month average of 40.7, matches its six-month, and trails its twelve-month of 43.9. On eight of twelve component-to-average comparisons, July reads at or above trailing baseline. Last month, that count was zero.
Demographic Analysis
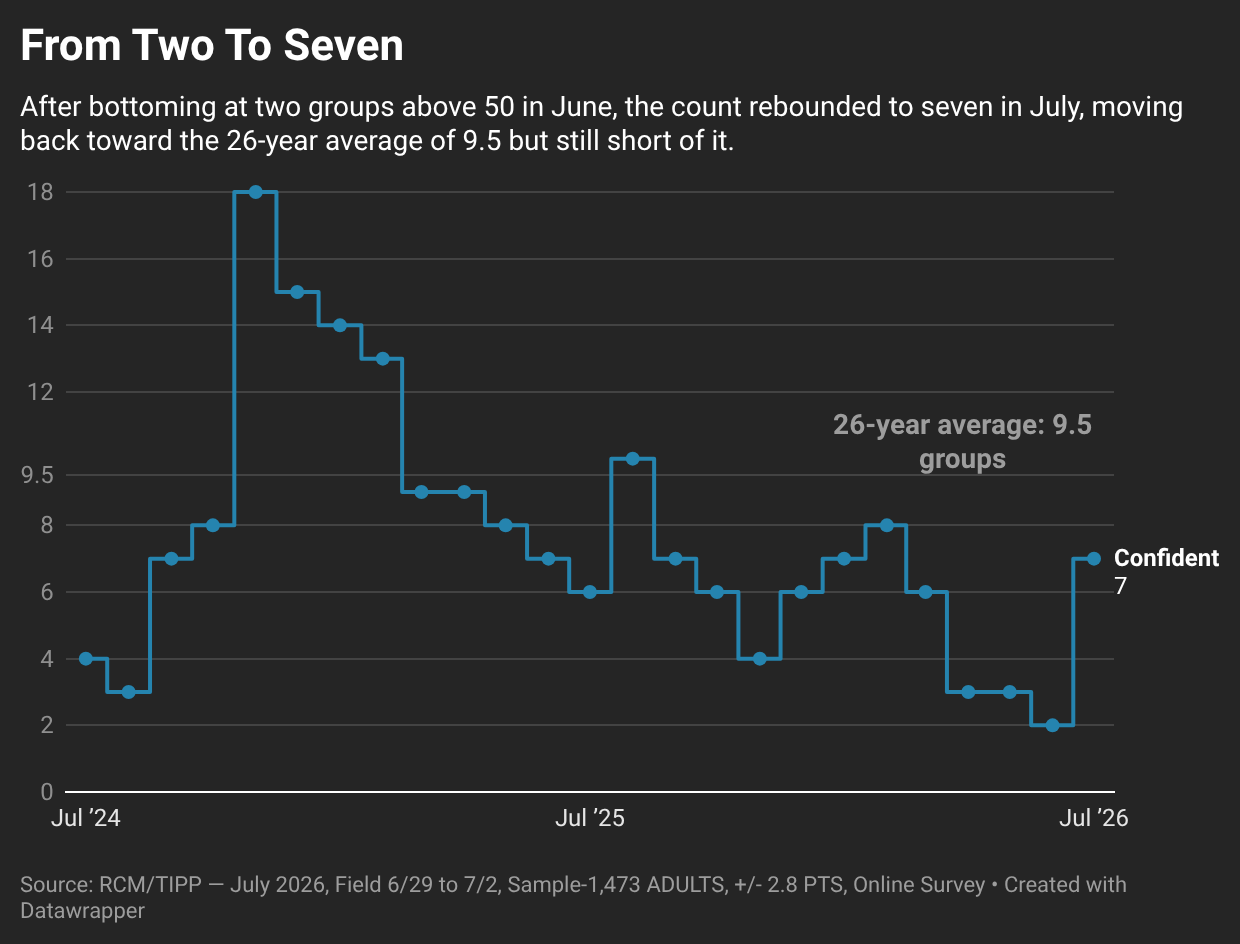
The number of groups in positive territory measures the breadth of optimism across American society. This month, seven of the 21 demographic groups RCM/TIPP tracks scored above 50 on the Economic Optimism Index, up from two in June and three in May. The list has expanded to include households earning $75,000 or more, Republicans, investors, adults aged 25–44, men, adults aged 18–24, and Black and Hispanic respondents. Seventeen groups improved their reading month over month, up from nine in June.
The biggest gains came from segments that had registered the sharpest declines this spring: the West rose 8.5 points, households earning $75,000 or more rose 7.1, middle-income households earning $50,000–75,000 rose 6.3, and investors rose 5.9. Three groups moved the other way. Adults aged 18–24 fell 1.9 points to 52.0, off an elevated June base. Households earning under $30,000 fell 1.0 to 40.6, a second consecutive monthly decline for the lowest-income segment. Democrats held flat. The rebound was broad, but not universal, and its edges are worth watching.
Financial Stress
RCM/TIPP also releases a companion measure, the RCM/TIPP Financial-Related Stress Index, the only monthly metric tracking the financial stress Americans feel. The gauge runs opposite to the optimism index: the higher the number, the more stress, with readings above 50 signaling elevated strain and 50 neutral.
The Stress Index fell 1.5 points, or 2.3%, from 64.3 in June to 62.8 in July, reversing part of June’s rebound in strain. It has averaged 60.5 since December 2007, and July’s reading sits 3.7% above that long-term norm. The last time the index fell below 50 was February 2020, just before the pandemic, at 48.1.
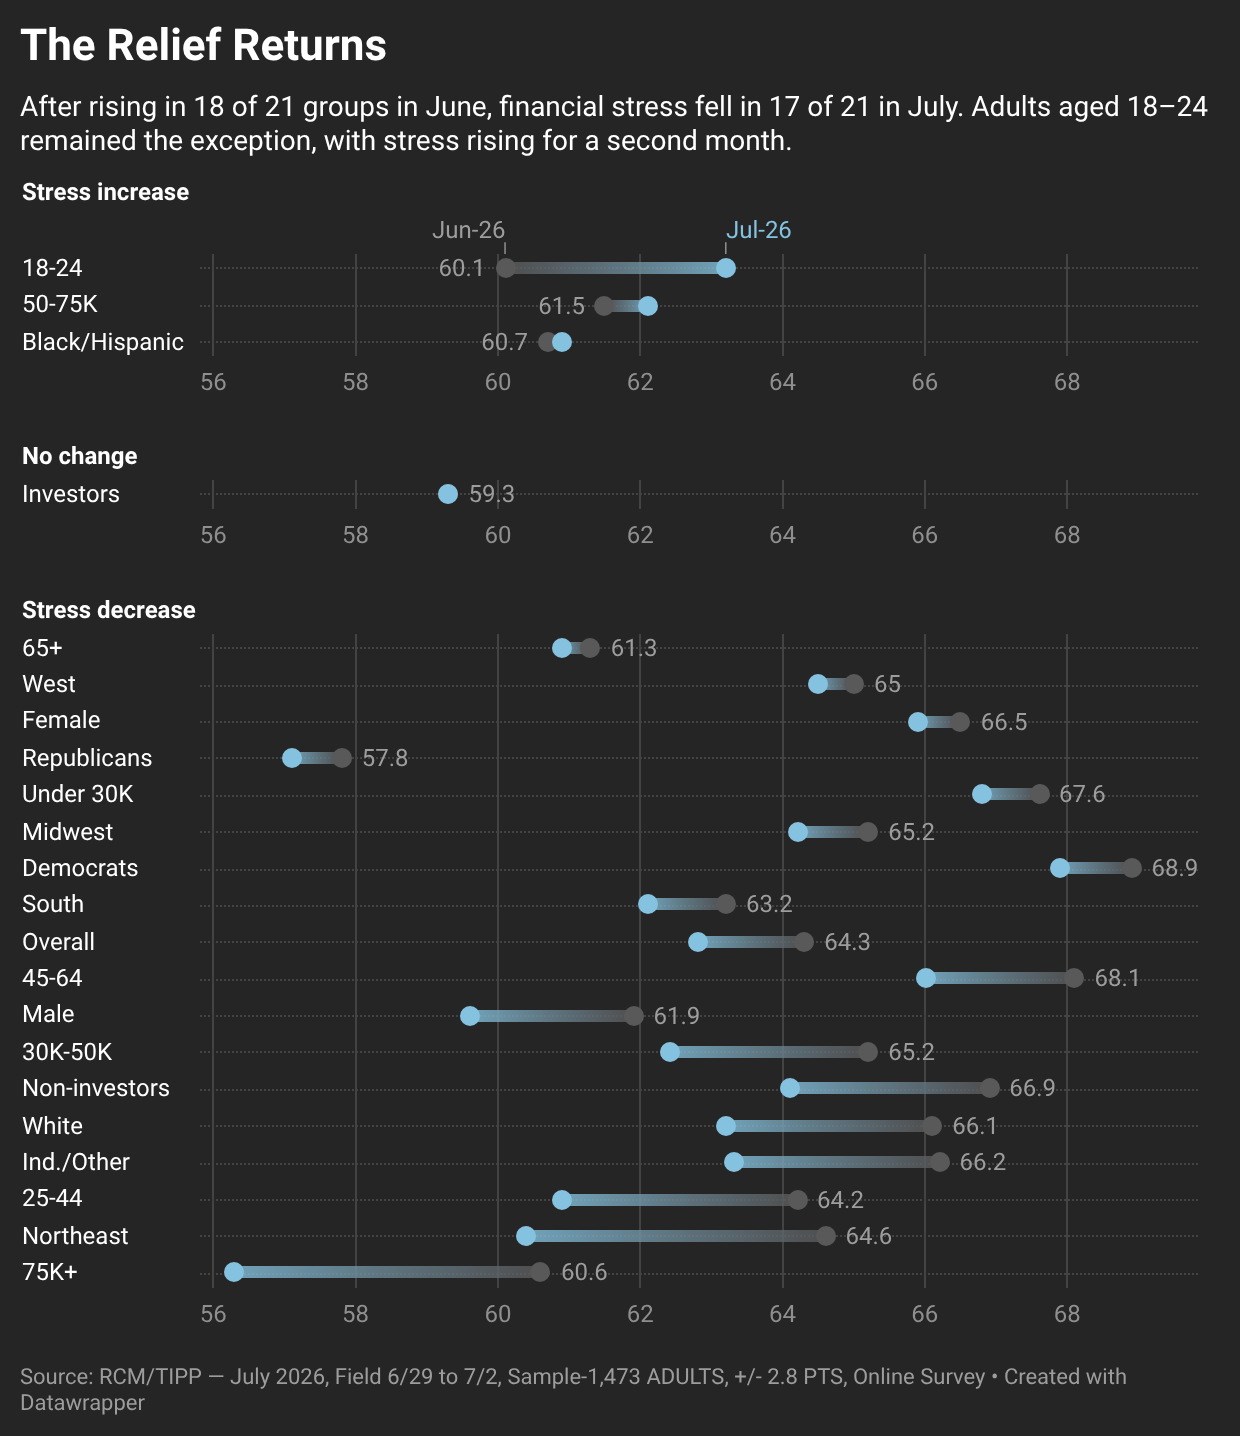
The relief was broad, but not as broad as the optimism gain. Seventeen of the 21 groups we track reported reduced stress in July. The sharpest drops came from households earning $75,000 or more (down 4.3 points), the Northeast (down 4.2), and adults aged 25–44 (down 3.3). The exception was again the youngest cohort. Adults aged 18–24 saw stress rise 3.1 points to 63.2, extending a divergence we first flagged in May and briefly reversed in June. On the stress side, the 18–24 volatility persists.
Stress And Optimism, Side By Side
The two gauges moved in the same direction for the first time in three months: optimism up, stress down. In May, the distance between the two narrowed to 19.5 points; in June it widened back to 21.8; in July it closed to 17.3, the narrowest reading since March.
The pattern is a shift from the spring, when most of the motion was on the stress side and the optimism line held nearly flat at 42.8, 42.6, 42.5. In July, both gauges moved, and both moved in the direction of relief. Whether the move continues, or reverses as some past large monthly moves have, is the question August will answer.
RealClearMarkets will release the next report at 10 a.m. EST on Tuesday, August 4, 2026.
Loved it, hated it, or somewhere in between — tell us. Grade this article here and help shape what lands in your inbox next.
🧭 Power & Capital · July 8, 2026
Where state power meets the boardroom.
🔷 Trump Administration Ends Iran Oil Sales Authorization
🔷 House Panel Urges Wizards, Capitals Owner To End Alibaba Ties
🔷 Congress And Insider Trading: The Rules Don’t Apply When You Make The Rules
🔷 Netanyahu Says F-35 Deal With Turkey Would Upset Regional Balance
🌍 Global Affairs
The world's flashpoints, in motion.
🟥 Let’s Leave The Strait Of Hormuz Alone – Ron Paul, Ron Paul Institute for Peace and Prosperity
🟥 U.S. Says More Than 80 Iranian Targets Hit In New Strikes – TIPP News
🟥 Why The NATO Summit In Ankara Matters To The US – Wilson Beaver & Elizabeth Krajc, The Daily Signal
🏛️ National Affairs
The fights shaping America right now.
🟫 The Taqiyya Communists – Editorial Board, Issues & Insights
🟫 Court Rejects Justice Department Subpoena In Fulton Election Probe – TIPP News
🟫 ICE Officer Fatally Shoots Motorist During Houston Enforcement Operation – TIPP News
🟫 Minnesota To Withdraw National Guard Troops From Washington Early – TIPP News
🟫 Congress Can Still Ban Birthright Citizenship. Here’s How. – Josh Hammer, The Daily Signal
🟫 Texas Lawmaker Calls For Special Session To Combat Birth Tourism After Supreme Court Ruling – Emily Medeiros, The Daily Signal
🟫 DSA Boasts—On July 4—That It Has More Members Than Any Socialist Organization In US History – Al Perrotta, The Daily Signal
🟫 Why Did The Treasury End The Harriet Tubman $20 Bill Plan – TIPP News
🟫 Obscenity Is Still Illegal—It’s Time To Enforce Laws Against Pornography – Scott Yenor & Caleb Pirc, The Daily Signal
🟫 Buckled Beams Trigger Emergency Response At NYC Construction Site – TIPP News
🟫 Florida Toddler Dies After Being Left In Hot Car – TIPP News
📈 Economy
Prices, policy, and the pressure on your wallet.
🟩 America’s Libertarian Revolution – Murray N. Rothbard, Mises Wire
🟩 No Paine, No Declaration – George Ford Smith, Mises Wire
💼 Markets & Business
The deals and tickers making moves.
🟧 Meta Faces $1.4 Trillion Penalty Demand In Youth Safety Case – TIPP News
📊 Market Mood · July 8, 2026
How the trading day is setting up.
🟩 Markets are turning more cautious as renewed U.S.-Iran hostilities interrupt what had been a fragile ceasefire, shifting investor focus back to geopolitical risk.
🟧 Oil prices are climbing again after fresh sanctions on Iran and concerns over shipping through the Strait of Hormuz revived fears of another energy-driven inflation shock.
🟦 Technology shares remain under pressure as investors reassess AI valuations, while volatility in South Korea's semiconductor sector highlights growing caution across the global chip industry.
🟨 Today's release of the Fed's June meeting minutes is expected to be the market's key catalyst, offering fresh insight into policymakers' thinking on inflation and the outlook for interest rates.
🗓️ Key Economic Events
On today's U.S. data calendar.
🟧 10:00 a.m. ET — Wholesale Inventories (May, Final)
Forecast: +0.2% | Previous: +0.2%
The report offers insight into inventory levels heading into the second quarter and their potential impact on future GDP growth.
🟧 3:00 p.m. ET — Consumer Credit (May)
Forecast: +$9.5B | Previous: +$10.0B
Consumer borrowing provides another gauge of household spending and financial confidence amid elevated interest rates.
🟧 2:00 p.m. ET — FOMC Minutes (June Meeting)
Markets will closely examine the minutes for clues on how Fed officials view inflation risks, the impact of higher oil prices, and the likelihood of additional rate hikes later this year.
Letters to the editor email: editor-tippinsights@technometrica.com
Subscribe Today And Make A Difference. Consider supporting Independent Journalism by upgrading to a paid subscription or making a donation. Your support helps tippinsights thrive as a reader-supported publication. Contact us to discuss your research or polling needs.
Reach our audience. For sponsorship and advertising opportunities, visit our Partner With Us page.